
Updated 31 August, 2019 in response to comments – changes in italics
On July 18, 2019 New York Governor Andrew Cuomo signed the Climate Leadership and Community Protection Act (CLCPA), which establishes targets for decreasing greenhouse gas emissions, increasing renewable electricity production, and improving energy efficiency. This is one of a series of posts on the ramifications of the “most aggressive climate law in the United States”. This post lays out an initial guess for the energy storage needed for CLCPA wind and solar resources at levels greater than announced to date.
CLCPA Target Overview
The Citizens Budget Commission developed an overview of the CLCPA targets in Green in Perspective: 6 Facts to Help New Yorkers Understand the Climate Leadership and Community Protection Act. The goals of the law are truly aspirational:
Reduce greenhouse gas (GHG) emissions:
-
- Reduce GHG emissions to 60 percent of 1990 emissions levels in 2030;
- Generate zero GHG emissions from electricity production by 2040; and
- Ensure GHG emissions are less than 15 percent of 1990 emissions levels in 2050, with offsets to reduce net emissions to zero.
- GHG offsets means that for every ton emitted into the air one ton is removed via GHG capture of some sort. For example, a company or individual can pay a landowner to leave trees standing that would otherwise be removed or plant additional trees to offset GHG emissions.
Increase renewable electricity:
-
- Increase renewable sources to 70 percent by 2030; and
Develop or support:
-
- 9 gigawatts (GW) of offshore wind electric generation by 2035;
- 6 GW of distributed photovoltaic solar generation by 2025; and
- 3 GW of energy storage capacity by 2030.
- Conserve 185 trillion British thermal units (TBTUs) of annual end-use energy use by 2025, of which at least 20 percent should be from energy efficiency improvements in disadvantaged communities.
- The CLCPA also requires between 35 percent and 40 percent of spending on clean energy or efficiency programs be in disadvantaged communities and mandates an air monitoring program in at least four such communities.
Simple Wind and Solar Capacity Model
I believe that CLCPA advocates have not figured out that an electric system that is completely dependent upon renewables will require much more energy storage than commonly assumed. I follow Michel at the Trust, yet Verify blog because he evaluates Belgian “green” technology quantitatively and has given me many insights into potential issues that might also arise in New York. Moreover, like me he prefers using real-world data. In a recent post Michel evaluated the potential effect of increased electricity production from intermittent energy sources in Belgium with a simple solar and wind capacity increase data analysis “model”. He downloaded solar generation, wind generation, and total load data for an entire year. The solar and wind data were summed together for every time period, in his case 15 minutes. Then he projected solar and wind by multiplying the observed sum by different values. The results graphically showed that adding a lot more intermittent wind and solar capacity increases production peaks but does not increase production nearly as much during production valleys. In addition, the results show that as renewable capacity increases more balancing mechanisms will be required.
In a previous post I adapted his methodology to New York State for 2018 with his help and analyzed data from August 2018 which represents the month with the most deficit periods. I believe that the CLCPA claims that renewable energy can completely replace the current fossil fuel load are extraordinary. As such, its proponents have to provide extraordinary evidence that it can work. In this post I look at the required balancing mechanisms for solar and wind to replace existing fossil generation in New York.
In the previous post I estimated how much energy storage may be required by incorporating reasonable assumptions about the future using assumptions about the availability of nuclear, solar, and wind using the Trust, yet Verify simple approach. The biggest future change is the forced shutdown of the Indian Pont nuclear facility in the next several years. In my previous analysis I used “best case” estimates that assumed that solar and wind are available at their rated capacities every hour in my test period. Because those sources are intermittent the amount of time when they are available at full load is not constant. For example, solar availability varies during the day and over the month of August there will be periods when the wind is blowing less than optimal. On the other hand assuming that Indian Point capacity is not available at its rated capability is a reasonable assumption because it usually runs at full load except for maintenance.
The ultimate result in that post estimated the wind and solar capacity from an aggressive CLCPA implementation plan. In that post and this one I want to estimate the least amount of energy storage needed in the future so I increased renewable additions more than have been announced to date. I don’t think there will be any significant increase in hydro or the other renewable category sources of methane, refuse, or wood firing and they are not intermittent so I made no changes to those categories. Because New York is shutting down 2,067 MW of nuclear at Indian Point in the next several years I subtracted that amount from every hour. I multiplied the existing onshore wind resource twenty times to estimate future availability. The CLCPA plan currently calls for 9,000 MW of off-shore wind power but I doubled that amount. The CLCPA plan also calls for 6,000 MW of solar PV power but I doubled that amount too. In order to account for daylight I added 6,000 MW to every time period from 0700 to 1955. In order to account for wind intermittency I made some assumptions about availability and scaled the offshore wind resource down when the on shore resource was below half of the observed maximum.
As shown in August 2018 Simple Model Aggressive CLCPA Renewables vs. Fossil Load, there are many periods of surpluses (all the renewables minus the existing fossil resource shown in blue) but there are still periods with deficits even with the best case assumptions about renewable availability. The remainder of this post examines one of the deficit periods in more detail.
Refined Renewable Resource Estimates.
In order to more realistically estimate the potential renewable resources available during one of these periods real world observations need to be included. For this analysis it is assumed that the onshore wind assumption that additional wind would be proportional to existing wind is adequate. However, I did try to modify the offshore wind and the solar components. In order to do that I chose a shorter period and collected meteorological data to get a better estimate of potential solar and off-shore wind capacity. I arbitrarily chose a deficit period on the early morning of August 8, 2018 when winds were light and the sun was either not up or not at full strength to look at the potential magnitude of energy storage required to balance the deficit.
In order to characterize the off-shore wind potential I found a National Oceanic and Atmospheric Administration buoy located 30 NM south of Islip, NY (40°15’3″ N 73°9’52” W) that I used to represent NY offshore wind resource availability. I downloaded hourly NDBC data for 2018 and scanned the data. As noted August 8 had light winds. The weather map for 8 August 2019 shows that there was a large high pressure system dominating the east coast. As a result, I am confident that this buoy characterizes NY offshore wind speeds and thus the resource of NY offshore wind.

This analysis characterizes wind energy as a function of observed wind as follows. I found a wind turbine power output variation curve, developed a straight line equation for the curve and estimated that the output of 18,000 MW of New York offshore wind equals 1714 times the wind speed minus 6000. I assumed that the observed wind speed at the hub height is proportional to the logarithm of the height above ground. For the calculations I assumed a hub height of 85 m and a surface roughness of 0.0003 while the buoy anemometer height is 4 m. The NY offshore wind output capacity in MW was calculated for every hour using this approach.
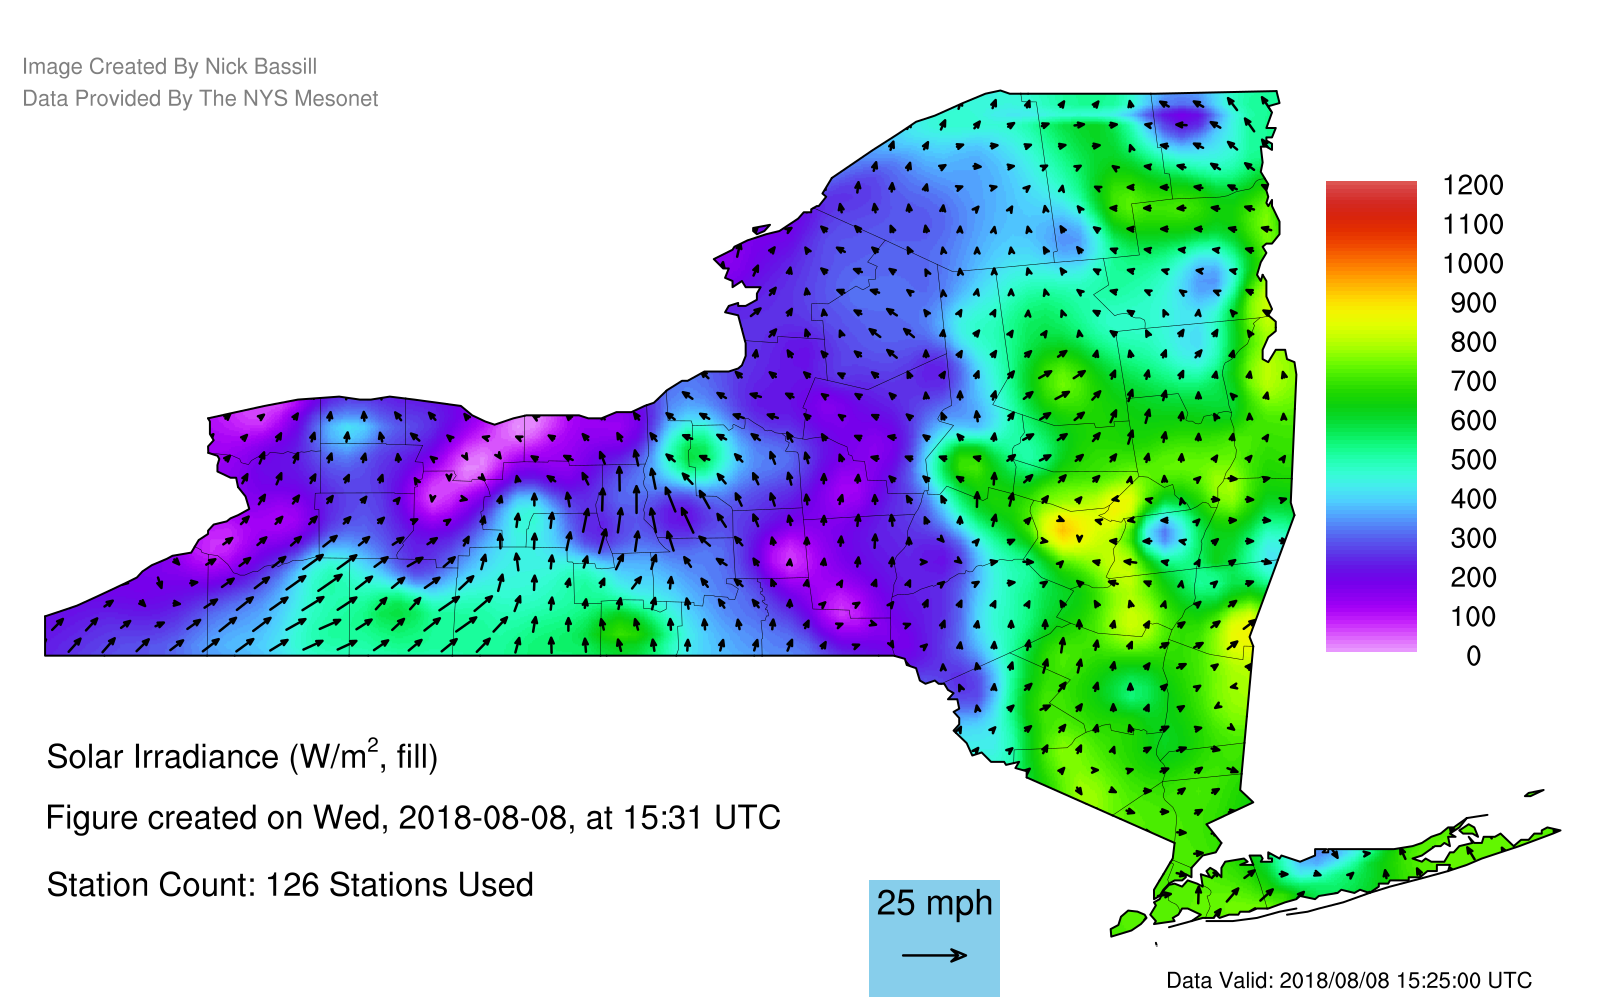
The solar output is a function of the observed solar irradiation in watts per meter squared. I assumed that 12,000 MW of solar capacity could be added in response to the CLCPA but that will be installed state wide. I downloaded solar insolation maps from the NYS Mesonet archive. I accessed the solar irradiation map in the spatial analysis directory to get solar irradiation maps and as an added bonus the maps also include gridded winds. NYS Mesonet Solar Irradiance Map 8 August 2018 at 1525 UTC shown below is an example of these maps and can be reproduced at this link. In this case there is a lot of variation across the state which makes a state-wide single number estimate of solar irradiation weak but sufficient for this first cut analysis. I estimate that the highest irradiance was 900 W/m2 and the lowest was around 100 W/m2. To do this right one would have to determine where the solar panels might be located to weight the observations. For this hour I guessed 600 W/m2 for the state. I assumed that the 12,000 MW of solar cells produced 12,000 MW when the solar irradiation equals 800 watts per square meter (the PVUSA test condition) and I did not account for any other factors such as the cell temperature or any losses. So my naïve formula for solar output was simply the observed input solar irradiation times 12,000 divided by 800.
The Deficit Example of Simple Model of Intermittent Wind and Solar Generation vs. Fossil Generation and Indian Point Shutdown table lists 5-minute from 0300 to 0955 EDT on August 18, 2018 when the assumed aggressive CLCPA renewable capacity could not replace the existing fossil capacity and loss of the Indian Point nuclear facility. The first three data columns list the total NYISO state-wide generation load, the NYISO total load, and the fossil generation load. The next four columns list the onshore wind load, CLCPA solar load, and the CLCPE off-shore wind load calculated as described above with the total shown in another column. The next three columns present the meteorological data used. Finally the sum of the onshore wind load, CLCPA solar load, and the CLCPE off-shore wind load minus the existing fossil and the Indian Point capacity of 2,067 MW is listed. In this period all the five-minute periods were negative. The first conclusion is that the post-CLCPA constraint may not be the peak load but instead a night-time low wind period.
Energy Storage Requirements and Costs
I have never seen an analysis that attempted to determine how much storage capacity would be required to meet a real-world generation capacity deficit. Clearly the total capacity has to exceed the observed deficit. In this case I estimate that the total deficit equals the sum of the average of the 12 5-minute deficits each hour or 33,548 MWh. I think that the maximum output of the energy storage has to equal the largest 5-minute deficit or 8,131 MW.
After that it is not clear how best to divvy up the energy storage requirements. I assumed that the least cost energy storage approach would maximize energy storage duration based on lower costs per MWh in a recently released report from the National Renewable Energy Lab (NREL): “2018 U.S. Utility-Scale Photovoltaics-Plus-Energy Storage System Cost Benchmark”. I reported on my estimates for different duration energy storage costs in a post at What’s Up With That. In this analysis I included the costs of the battery and did not include developer costs to site, permit and connect the facility to the grid.
In the Estimated Energy Storage Required and Potential Price table I summarize the energy storage needs and my projection for the amount of different duration energy storage needed for the seven hour deficit period with my over-built renewables future scenario. In the first hour of the deficit period the hourly average was 1,140 MW but the peak was 1,390 MW so I project 1,400 MW at 7-hour duration could be used. The next hour had the peak 5-minute deficit of 8,131 MW. In order to meet that and subsequent hours I project 1,300 MW at 6-hour duration, 2,750 MW at 5-hour duration and 2,690 MW at 1-hour duration would cover that peak and most of the subsequent deficits. In order to cover subsequent peaks I added 1,200 MW at 2-hour duration and 620 MW at 1-hour duration. The total MWh stored (37,160) exceeds the observed total deficit (33,548) by 3,612 so there is a lot of room for refining this analysis but that has to be weighed against the fact that no attempt was made to find the worst case period which has to be done at some point.
The total costs are staggering. In order to cover the deficit of energy produced by solar and wind resources at an aggressive level over current on-shore wind and proposed CLCPA solar and wind, $12.5 billion dollars of energy storage will be required to replace existing fossil generation and Indian Point. Nobody in the State has suggested how much energy storage will be required and the 3,000 MW of energy storage capacity by 2030 goal has not included any duration goals. In context 11,260 MW of energy storage capacity is needed according to this analysis and there are large amounts of seven, six and five hour duration energy storage capacity required. Needless to say, no State estimates have covered the expected costs of their storage goal much less what might ultimately be needed.
Conclusion
In order to determine the cost and feasibility of the CLCPA the State needs to do a similar analysis using real world data and historical load data. The analysis should attempt to site likely renewable energy resources and use the NYS Mesonet data to determine potential resource availability for as long a period as possible. The goal of the analysis would be to determine the energy storage capacity required to meet the CLCPA so that a cost estimate can be prepared.

Your blog is, unfortunately, devoid of “Intellectual Curiosity and adoption of Simple Practical Solutions”. Let me explain:
1. You/NewYorkers quietly accept that ONLY Electricity produced by Power Plants should meet Zero Emissions. Why is this portion of the Energy “Industry/Market” only being targeted. Why are not ALL Energy Producers and Consumers as well as other Polluters required to meet the same yardstick (Zero Pollution)…. Lack of Intellectual Curiosity…
2. The USA has over 4 Million km2 of Agricultural Land with Electric Supply to ALL Rural homes and many many farms …. today, and New York has its “fair share” too. Why do you need “exotic” off shore, floating etc… Wind or PV Insallations??
3. Using AgriVoltaics the US can generate all the Electricity to meet ALL its Energy (not just Electricity…. but also includes Electric Vehicles, Transportation, Industry, Commercial, Residential…) on ~2% of this Agricultural Land by using AgriVoltaics (AV). New York State can do likewise…
4. What is AgriVoltaics (AV)?… It is a simple Solar Energy Production Option/Technology that installs AV Solar Panels (partially/selectively transparent) on roofs of AV Structures (like enclosed or open sided Greenhouses) as one continues farming below on the same land and at the same time (Dual use) without affecting Agricultural Production either. (In case of New York State…. using enclosed PV Structures, these greenhouses like AV Structures can potentially provide year round farming…. or as a minimim, extend the farming seasons resulting in additional produce/income for farmers).
5. The World has 15Million km2 of Agricultural Land today and the World requires a 150TW System generating ~200,000 TWhrs / yr for ALL its Energy needs (by 2050… 10 Billion people @20,000KWhrs/pp/yr) ) on barely 1Million km2 using AV…. Easily Done…. no fancy simulations, projections, highly paid consultants, etc… or “newer” Land or Resources needed or divereted or laid to waste (as in Solar Farms with “ground mounted” PV Panels). No new/space age Installation skills, Unknown or Unproven Technology or Science needed either … JUST DO IT… CLEAN THE ENVIRONMENT FULLY…. AND DUMP POLLUTION IN THE DUSTBIN OF HISTORY… FOREVER….
6. Now regarding night time when there is no Solar Power…. what do we do…???
Approximayely 20-25% of the Total Energy needed for Sunset-to-Sunrise and Energy Storage would be needed (for 12-14 hrs/day please…. not 3-4 hrs as is beong banded around). All Vehicle and other Charging must be done in the daytime only. Batteries are “dead-end” with limited life and produce “after-life” toxic waste (here we go again… replacing Air and other Pollution with Solid Waste…. lik Nuclear Waste from Nuclear Plants) …. the solution lies in Rural Village size (several MW size) above ground CAES (Compressed Air Energy Storage) Systems… and “Non-Polluting” CAV’s (Compressed Air Vehicles) but I will leave that for you/later… I cannot monopolize ALL answers…
LikeLike
Thank you for your comment. I have never heard of AgriVoltaics and I believe that is exactly the kind of technological innovation necessary if New York is to meet its goals. The concept does address my concerns about land use and solar farms, but my main fear is that the New York climate is not conducive enough for any solar PV technology to provide sufficient energy for the state’s needs during winter peak load conditions. I encourage you to contact the State at ClimateAct@dec.ny.gov and tell them what you told me.
LikeLike
Roger….
There is more than enough Agricultural Land in NY State to install more than ten more than NY State needs with plenty of land to spare….
As per NY State Deptt. of Agriculture and Markets States there are 7 Million Acres (70,000km2) of Agricultural Land. 1% of this Area can accomodate 100GWe of AV (150W/m2) which can generate, conservatively, 100TWhrs/yr (@1KWhr/W/yr)…. I think you will readily conclude there is more than enough Farmland to meet NY State Energy (Not just the Electricity) needs …. forever..??? as long as the sun shines… I guess!!!
As far as “not having heard” of AgriVoltaics… it is there, backed by “research”on Agriculture, for sometime now…. but not to worry… one lives and learns…. Believe me… I am 73years old & retired for 15 years…. and learn something new… every day…. Life’s “journey ends” only when it ends….
The “HOLY GRAIL” OF ENERGY WITHOUT POLLUTION IS THERE BEFORE US…. ONE JUST HAS TO GRASP IT… All the best….
LikeLike