In a recent article I noted instances where Governor Hochul and Public Service Commission Chair Rory Christian have raised the possibility for limited changes to the Climate Leadership & Community Protection Act (Climate Act) interim targets primarily because of affordability concerns. Proponents disagree insisting that renewables currently provide cheapest electricity. I addressed this myth based on an article by Matt Jacobson at Matt’s Substack. I promised to follow up with more details. This article is based on a series of articles at the Science of Doom blog by Steve Carson. It is a long post documenting all the reasons cheap renewables is misinformation.
I am convinced that implementation of the Climate Act net-zero mandates will do more harm than good if the future electric system relies only on wind, solar, and energy storage because of reliability and affordability risks. I have followed the Climate Act since it was first proposed, submitted comments on the Climate Act implementation plan, and have written over 600 articles about New York’s net-zero transition. The opinions expressed in this article do not reflect the position of any of my previous employers or any other organization I have been associated with, these comments are mine alone.
Overview
The Climate Act established a New York “Net Zero” target (85% reduction in GHG emissions and 15% offset of emissions) by 2050. It includes an interim reduction target of a 40% GHG reduction by 2030. Two targets address the electric sector: 70% of the electricity must come from renewable energy by 2030 and all electricity must be generated by “zero-emissions” resources by 2040. A recent recommendation by Governor Hochul to adjust the deadlines has spurred conversations about the schedule and ambition of the Climate Act. A primary concern is affordability.
Carson’s series of articles provided the supporting arguments for a detailed rebuttal of the myth of cheap renewables. An article by Emily Pontecorvo summarizes the Green Energy Blob take on decarbonization and affordability if you are interested.
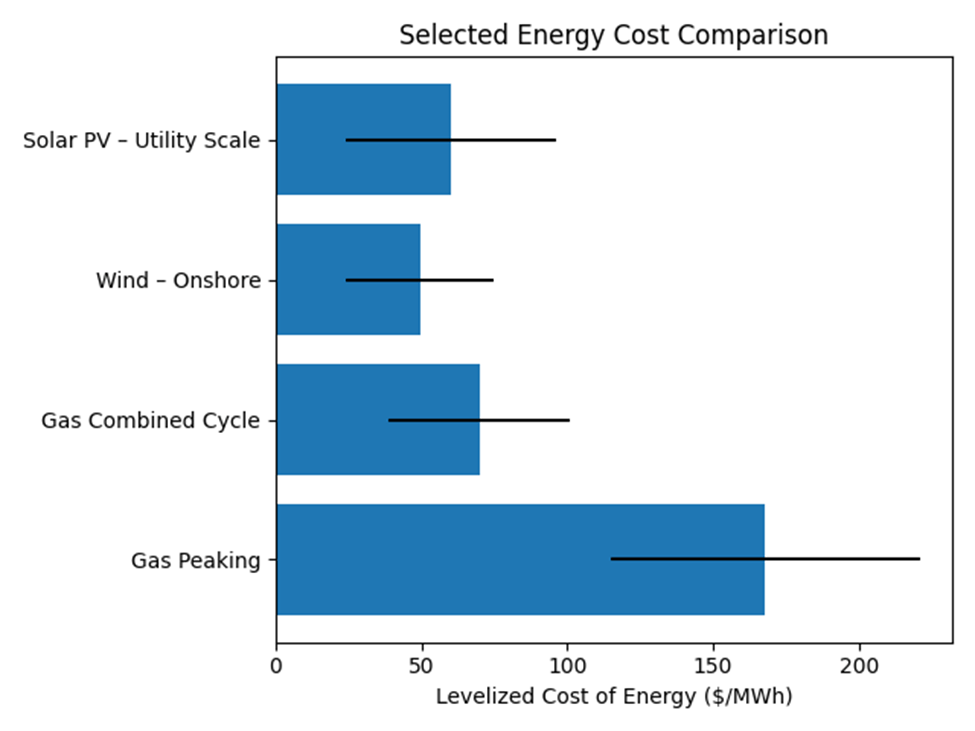
The primary basis of the myth that wind and solar are now the “cheapest” sources of electricity is Lazard’s Levelized cost of energy (LCOE). This parameter claims renewables beat coal, gas, and nuclear on a dollar-per-megawatt-hour basis. This underpins the narrative that renewable energy should translate into lower electricity bills for consumers. However, LCOE project-level costs are junk.
Steve Carson explains that the reality of jurisdictions trying to transition tells a different story than the LCOE theory. Germany has massively expanded wind and solar while shutting down coal and nuclear, but German households face some of Europe’s highest electricity prices. The United Kingdom’s coal phaseout and wind surge haven’t delivered cheap power. South Australia, with the world’s highest penetration of rooftop solar and substantial wind capacity, maintains some of the developed world’s highest retail electricity rates.
This disconnect between “cheap renewables” and expensive electricity isn’t a coincidence or a policy failure in implementation. It reflects that the LCOE narrative obscures the fundamental truth that the cost of a reliable electricity system is not the same as the cost of intermittent generation. As Science of Doom’s comprehensive series demonstrates, when you need electricity every hour of every day, the system must pay for flexibility, backup capacity, grid stability services, and expanded transmission infrastructure—costs that persist regardless of how low the marginal cost of wind and solar generation falls.
What “Cheap Renewables” Actually Means – Blind Spots in the LCOE Metric
The levelized cost of electricity is the net present value of the unit-cost of electricity over the lifetime of a generating system. It divides total lifetime costs (capital, operations, maintenance, fuel) by total expected lifetime electricity output. LCOE is useful for comparing similar technologies under similar conditions, but it has significant limitations when applied to system planning or comparing dispatchable and intermittent resources.
LCOE looks attractive for wind and solar because these technologies have:
- High upfront capital costs but near-zero marginal operating costs
- No fuel expenses
- Relatively predictable maintenance schedules
- Declining capital costs due to manufacturing scale and technological improvements
In New York’s electric dispatch system, renewables with zero fuel cost naturally displace higher marginal-cost fossil generation when available. This creates the appearance of “cheap” electricity—wind and solar bid low or even negative in wholesale markets, setting clearing prices near zero during periods of abundant renewable output.
The critical problem is what LCOE excludes from its calculation.
- Dispatchability and timing: LCOE treats all megawatt-hours as equal, whether generated at 2 PM on a sunny summer afternoon when demand is moderate and supply is abundant, or at 7 PM on a windless winter evening when demand peaks and solar is unavailable. The market value of these megawatt-hours is radically different, but LCOE treats them identically.
- Capacity value degradation: The first wind farm in a system has significant capacity value—it can reliably displace fossil capacity. But as wind penetration grows and multiple wind farms experience correlated low-output periods, the system cannot count on wind for reliability. Capacity value falls toward zero at high penetration, even as LCOE remains constant.
- Integration and system costs: LCOE does not account for the costs of integrating intermittent generation into a reliable grid. These expenses include: transmission upgrades and expansion to connect remote renewable resources; grid stability and frequency control services (increasingly needed as synchronous generation declines); backup and flexible capacity to cover renewable output variability; energy storage or other time-shifting mechanisms; and curtailment costs when renewable generation exceeds instantaneous demand
- Correlation with demand: Solar generates during midday but not during evening peak hours. Wind output is weather-dependent and poorly correlated with demand patterns. LCOE cannot capture the system cost of this mismatch.
New York’s electric system dispatches on merit order, but when renewables set the wholesale clearing price at near-zero during sunny, windy periods, it creates a misleading signal. Yes, wholesale prices fall—sometimes into negative territory. But the system still requires dispatchable capacity for the hours when renewables cannot generate. That dispatchable capacity must recover its fixed costs from fewer operating hours at higher prices, leading to extreme price volatility. Retailers must price their offerings to survive the high-price periods, so negative wholesale prices do not translate into lower retail bills.
Germany provides a clear test case. From 2010 to 2025, Germany dramatically reduced coal generation, phased out nuclear entirely, and massively expanded wind and solar capacity. Renewable generation now regularly exceeds 50% of domestic production on favorable days. If cheap renewables meant cheap electricity, German consumers should be celebrating. Instead, German households pay among the highest electricity prices in Europe—often 30-35 euro cents per kilowatt-hour, more than double the rates in France
The merit-order cost stack includes far more than energy and is the reason for the high prices:
- Grid charges: Massive transmission expansion to connect offshore wind in the north to demand centers in the south, plus distribution upgrades to handle distributed solar,
- Capacity payments: Gas plants kept available for reliability despite operating far fewer hours,
- Interconnector costs: Germany now relies heavily on electricity imports from neighbors during low-renewable periods, requiring expensive cross-border infrastructure
- Renewable subsidies: Feed-in tariffs and other support mechanisms recovered through consumer surcharges, and
- Ancillary services: Frequency control, voltage support, and system strength services previously provided “free” by synchronous generators now are procured separately.
The Power Grid as Extended Grid Storage
Steve Carson highlights a critical but often invisible function of grid interconnections: they act as “extended grid storage” by allowing regional transmission operators to share both cheap generation and backup capacity. For example, when German wind and solar are abundant, exports flow to neighbors. When German renewables underperform, imports flow back—often from French nuclear, Scandinavian hydro, or even Polish coal.
This flexibility is valuable, but it isn’t free. The infrastructure costs billions, and Germany effectively outsources reliability to its neighbors’ dispatchable capacity. The neighboring countries must maintain that capacity, and those costs ultimately appear in electricity prices across the interconnected system. This is an inevitable result in North America.
South Australia -The World’s Renewable Laboratory
South Australia offers the clearest real-world experiment in high-renewable electricity systems. This small state (1.8 million population) transformed its grid faster and more completely than almost any comparable jurisdiction:
- Extremely high rooftop solar penetration—over 40% of households with solar panels,
- Substantial utility-scale wind capacity,
- Tight interconnection to the rest of Australia’s National Electricity Market (NEM),
- Aggressive renewable energy targets and supportive policies, and
- Near-complete exit from coal generation
If cheap renewables automatically produced cheap electricity, South Australia should have the lowest power bills in the developed world. Instead, it consistently ranks among the highest.
The Canyon Curve: Free Solar, Expensive Evenings
South Australia has better solar resource potential than New York. Carson’s analysis reveals the “pricing paradox” at the heart of South Australia’s solar experience. The wholesale price pattern creates a dramatic “canyon curve”, i.e., a more intense duck curve load and generation pattern:
- Midday (high solar output): Wholesale prices regularly fall to zero or go negative. In 2025, nearly half of all trading intervals saw negative prices during midday hours. Generators literally pay to produce electricity because they cannot or will not curtail output.
- Evening ramp (solar fades, demand peaks): Prices spike dramatically, often reaching several thousand dollars per megawatt-hour. Extreme spikes to $15,000/MWh (the market price cap) occur dozens of times per year during tight supply conditions.
This extreme volatility creates a counterintuitive result: even though wholesale prices are “free” or negative for many hours, retail bills remain very high. Several mechanisms drive this outcome:
- Scarcity pricing sets clearing prices for everyone: In the NEM’s energy-only market, the last, most expensive generator needed to meet demand sets the wholesale price for all generators in that interval. Even if 95% of electricity comes from “cheap” wind, batteries, and gas, if the final 5% requires an expensive gas peaker bidding $10,000/MWh to cover its costs in limited operating hours, everyone gets paid $10,000/MWh for that interval.
- Retailers must survive the spikes: Retail electricity providers offer customers flat-rate contracts, but they purchase wholesale power at volatile spot prices. To avoid bankruptcy during extreme price events, retailers must build a substantial risk premium into their retail tariffs. A few hours per year at $15,000/MWh can exceed the cost of thousands of hours at negative prices.
- Time-of-use tariffs have limited adoption: Most residential customers remain on flat-rate tariffs and cannot respond to price signals. Even customers with solar panels typically don’t have battery storage to arbitrage the price differential, so they export at negative prices and import at extreme prices.
Invisible Costs: Flexibility, Backup, and Wiring
Carson’s detailed analysis of South Australia’s battery deployments reveals a critical misunderstanding in public discourse about energy storage. Large-scale batteries are not being built to store “a day” or even “several hours” of electricity for later use. They’re being built because the market pays premium prices for fast response in specific narrow windows. I have never seen this distinction mentioned relative to New York but suspect that we are not there yet.
Two articles (Batteries in SA: The Market in Operation and Batteries and the Market Machinery — How the Grid’s ‘Invisible Hand’ Rewards Speed) describe the actual function of grid batteries in South Australia (Table 1).
Table 1: Grid battery revenue streams in South Australia
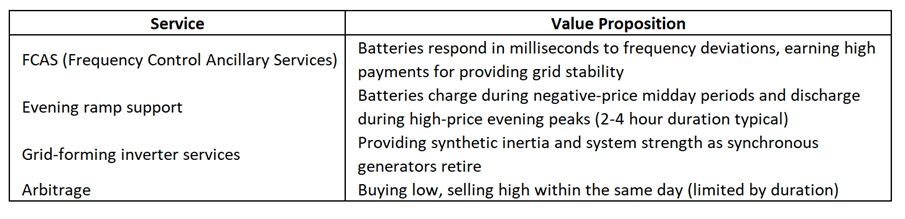
Batteries are valuable and economically rational investments given current market design, but they don’t fundamentally solve the integration challenge. Their limited duration (typically 2-4 hours) means they cannot address multi-day weather events or seasonal renewable output variations.
Transmission: The 1,500km Relay Race
Carson’s analysis of European transmission interconnections illustrates another hidden cost: transmission infrastructure operates as a multi-decade, multi-billion-dollar “relay race” to move power across vast distances. Green energy advocates in New York universally ignore the challenges of supplying renewables across great distances but claim that this is a solution to local renewable lulls.
Carson describes the challenge for jurisdictions further along the transition to renewables, Spain, for example, often experiences weather patterns opposite to Germany—sunny and windy when Germany is calm and cloudy. In principle, Spanish renewable generation could supply German demand. In practice, moving that power requires it to flow through France, with each border crossing representing a constrained bottleneck. Expanding these interconnectors requires massive investment and decades of planning and construction.
Even within countries, transmission expansion represents a substantial cost. Renewable resources are often located far from demand centers (offshore wind, remote solar farms, high-altitude wind sites). Connecting them requires new high-voltage transmission lines, substations, and grid reinforcements. These infrastructure costs are recovered from consumers through grid charges, separate from energy prices. Upstate New York electric rates are increasing because of this..
Reliability Problems in a Renewable-Based Grid
Most electricity markets were designed around a specific paradigm: generators with controllable output and marginal costs that rise with fuel consumption compete to supply demand, with the market clearing at the marginal cost of the last generator needed. This “energy-only” market design works reasonably well when most generation is dispatchable. New York’s market also includes a capacity component but problems remain. These references (one and two) describe how intermittent renewables change electric resource planning in several ways:
- Zero marginal cost undermines investment signals: When wind and solar set clearing prices at or near zero during periods of abundant output, dispatchable generators cannot recover their fixed costs. This discourages investment in the backup capacity the system requires for reliability during low-renewable periods.
- Capacity value diverges from energy value: A generator that produces cheap energy when it’s not needed has low system value. A generator that reliably produces energy during scarcity periods has high system value. Energy markets struggle to properly value this difference, leading to underinvestment in dispatchable capacity[.
- The “missing money” problem: Dispatchable plants kept available for reliability but operating only during scarcity periods cannot earn sufficient revenue from energy-only markets. This creates a “missing money” problem where economically necessary capacity cannot be sustained under market rules.
Renewable-dominated systems face what can be called the “fat tail” reliability problem. It’s relatively easy and cheap to supply electricity 90-95% of the time using wind, solar, and short-duration storage. But guaranteeing supply for the remaining 5-10% of hours—when demand is high and renewables are unavailable—becomes disproportionately expensive.
These tail events include:
- Multi-day periods of low wind across a broad geographic region (wind droughts),
- Winter evenings with high heating and lighting demand but no solar output,
- Heat waves with high air conditioning demand and reduced wind, and
- Cold snaps that strain both electricity and gas systems simultaneously.
Current market designs systematically undervalue the capacity needed to address these tail events. The result is either reliability problems (as seen in Texas and California) or out-of-market interventions and capacity payments that add to consumer costs but don’t appear in LCOE calculations and proponent claims of cheaper renewables..
LCOE is the commonly used proof that renewables are cheapest. Steve Carson’s series of articles demonstrates a fundamental point that policy discussions too often overlook: cheap intermittent megawatt-hours are not the same as cheap electricity systems. LCOE measures the former, but consumers pay for the latter.
A reliable electricity system operating 24/7/365 requires:
- Sufficient generation capacity to meet peak demand plus reserves,
- Dispatchable resources or storage to cover periods when intermittent resources underperform,
- Transmission infrastructure to connect generation to load,
- Grid stability services (frequency control, voltage support, inertia, system strength),
- Market mechanisms to ensure adequate investment in all necessary resources, and
- Coordination across time (energy storage), space (transmission), and technology (diverse generation portfolio)
Intermittent renewables with low LCOE can supply cheap megawatt-hours during favorable conditions, but they don’t eliminate or substantially reduce most of these system requirements. In many cases, high renewable penetration increases system complexity and cost:
- More transmission is needed to connect remote resources and balance geographic diversity,
- More flexibility is needed to manage output variability,
- More grid services are needed to replace functions previously provided by synchronous generators, and
- More sophisticated market designs are needed to maintain reliability incentives.
These costs appear in consumer bills as transmission charges, capacity payments, ancillary service costs, and renewable support mechanisms—not in LCOE calculations. Germany’s high consumer prices reflect genuine system costs of operating a high-renewable grid. South Australia’s price volatility reflects the challenge of balancing supply and demand with weather-dependent generation. The UK’s persistent high bills reflect the need to maintain dispatchable backup despite growing renewable capacity. New York’s transition to a renewable-based electric system will inevitably follow these examples.
Serious energy policy planning must start from total system cost, not headline LCOE numbers. This means:
- Evaluate technologies based on system value, not just LCOE. A dispatchable low-carbon resource available on demand may provide more value than a cheaper intermittent resource, even if its LCOE is higher.
- Account for all integration costs. Transmission expansion, grid stability services, backup capacity, and storage requirements must be included in cost comparisons.
- Design markets to properly value reliability. Energy-only markets systematically undervalue the capacity needed to maintain reliability in high-renewable systems. Market reforms or capacity mechanisms are necessary.
- Be honest about cost trade-offs. High renewable penetration may be desirable for emissions reduction, but it comes with real system costs. Pretending these costs don’t exist or can be eliminated through further renewables deployment undermines public trust and leads to poor planning.
- Diversify the resource portfolio. No single technology provides all necessary grid services. A mix of resources—including dispatchable low-carbon generation, energy storage, demand flexibility, and transmission—produces a more reliable and likely more cost-effective system than over-reliance on intermittent renewables.
The goal should not be the “cheapest” generation on an LCOE basis, but rather the least-cost pathway to a reliable, low-emission electricity system. As the Science of Doom series convincingly demonstrates, these are not the same thing. Until policy discussions and planning processes grapple honestly with this distinction, consumers will continue to face the disconnect between promises of “cheap renewables” and the reality of expensive electricity bills.