Over the last couple of months, I have written articles describing my concerns about the recent sharp increase in Regional Greenhouse Gas Initiative (RGGI) allowance prices since the announcement that Virginia was rejoining the program. I have argued that the RGGI allowance costs operate as a regressive, opaque tax on electricity that raises bills, stresses the grid, and may not deliver the durable climate or affordability benefits advocates claim. RGGI cheerleaders’ arguments about higher RGGI allowance prices reflect a revenue‑first mindset that treat rising auction proceeds as a “big opportunity” to expand state‑controlled climate and rebate programs. At a time when energy affordability is a concern not protecting consumer costs is inappropriate. A recent article at E&E News exemplifies the mindset that spending more on the goals of RGGI is more valuable than keeping ratepayer costs low.
I have been involved in the RGGI program process since its inception and have been writing about the about problems with the RGGI program since the start of this blog. I have worked on every cap-and-trade program affecting electric generating facilities in New York including RGGI, the Acid Rain Program, and several Nitrogen Oxide programs, since the inception of those programs. The opinions expressed in this post do not reflect the position of any of my previous employers or any other organization I have been associated with, these comments are mine alone. I acknowledge the use of Perplexity AI to generate material included in this document.
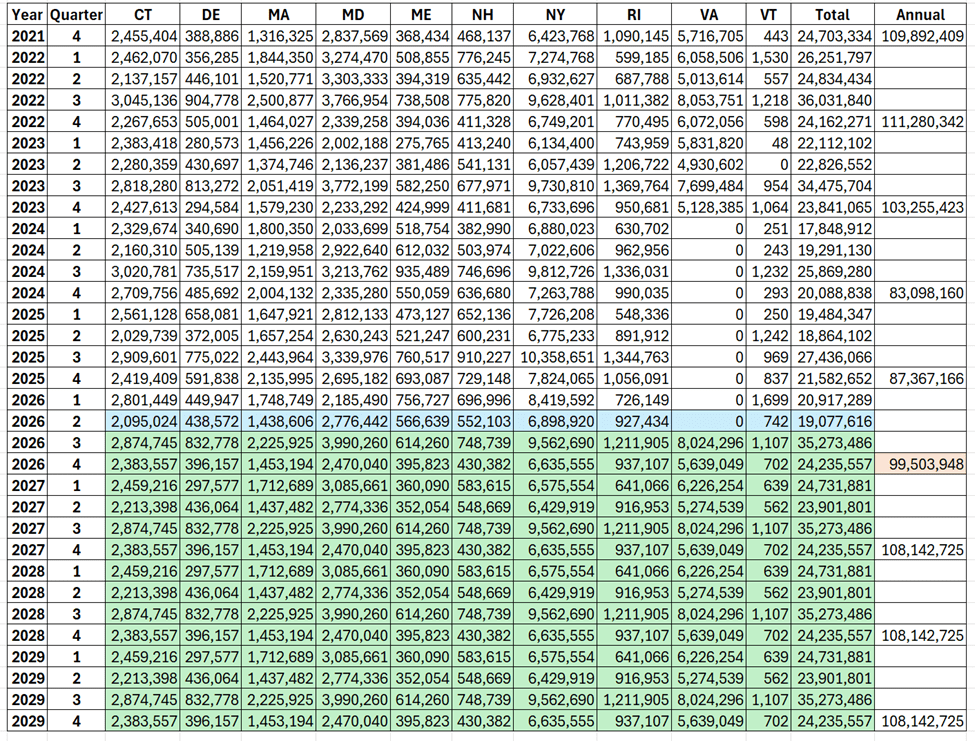
RGGI is a market-based program to reduce greenhouse gas emissions from the power sector. It has been a cooperative effort among Connecticut, Delaware, Maine, Maryland, Massachusetts, New Hampshire, New York, Rhode Island, and Vermont since 2008, with New Jersey and Virginia rejoining in 2020 and July 2026, respectively. Pennsylvania recently decided not to join.
According to the RGGI program description, the states issue CO₂ allowances that are distributed almost entirely through regional auctions, and the proceeds are then reinvested in strategic energy and consumer programs. Those investments include energy efficiency, clean and renewable energy, beneficial electrification, greenhouse gas abatement and climate adaptation, and direct bill assistance, with energy efficiency receiving the largest share. There also are unacknowledged administrative costs that reduce even rebate program benefits.
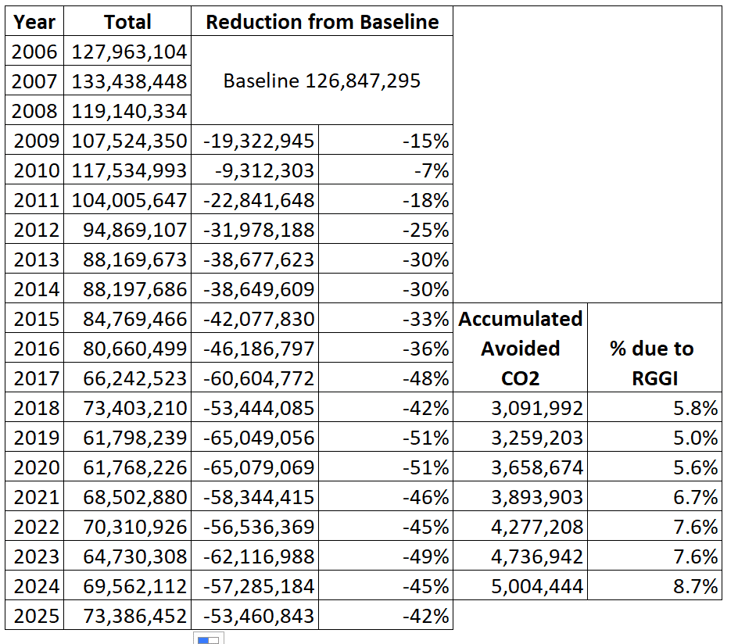
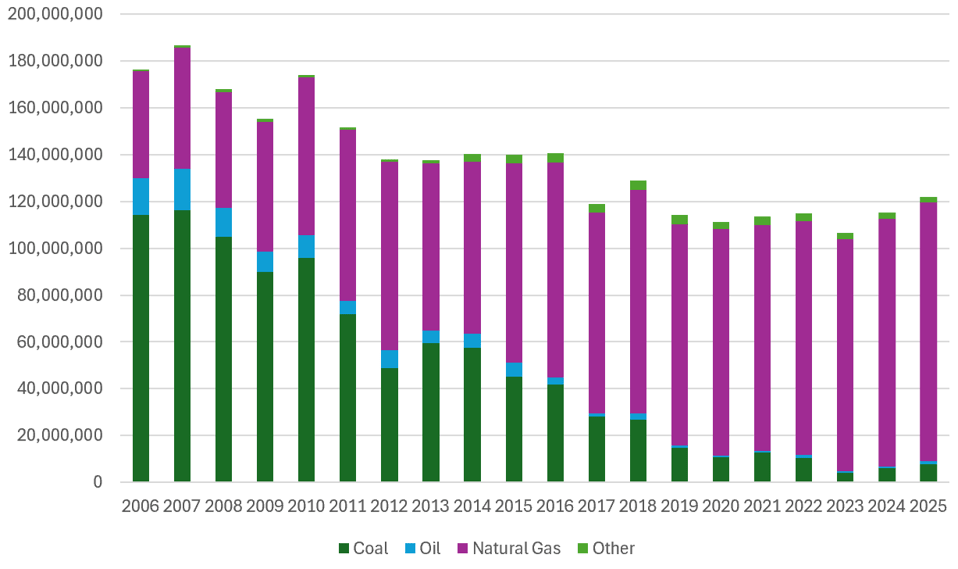
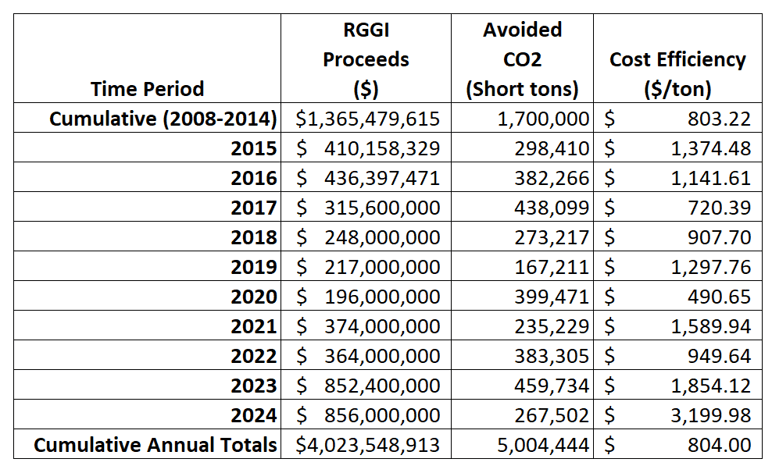
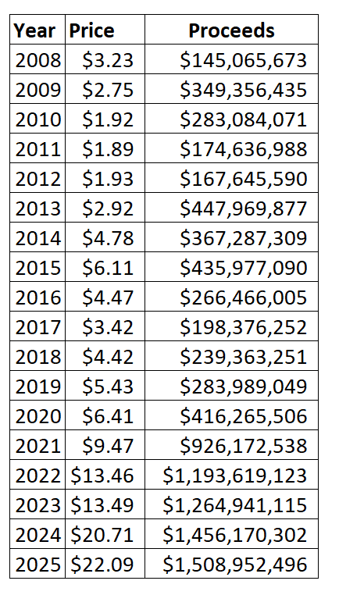
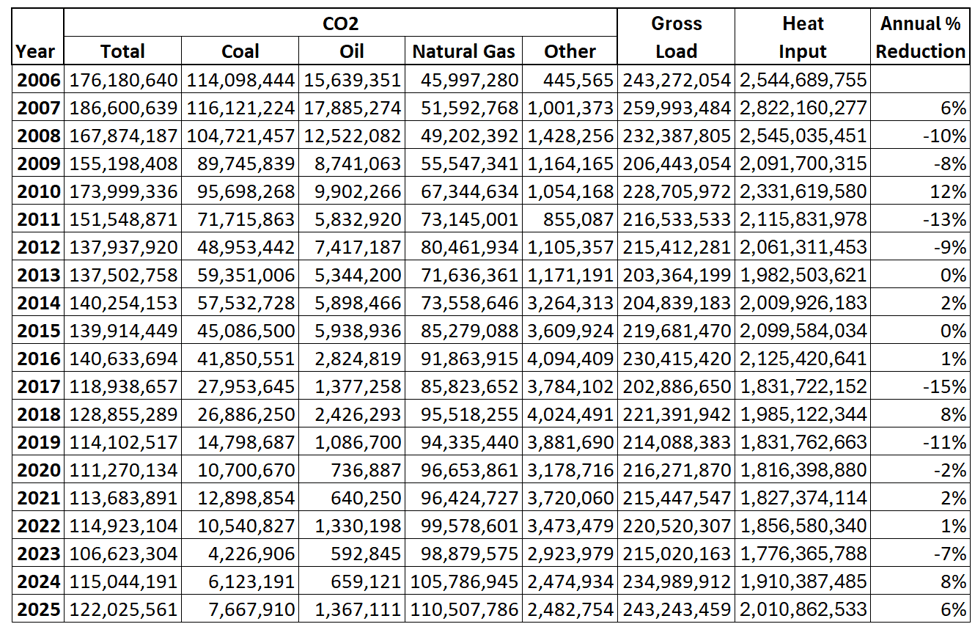
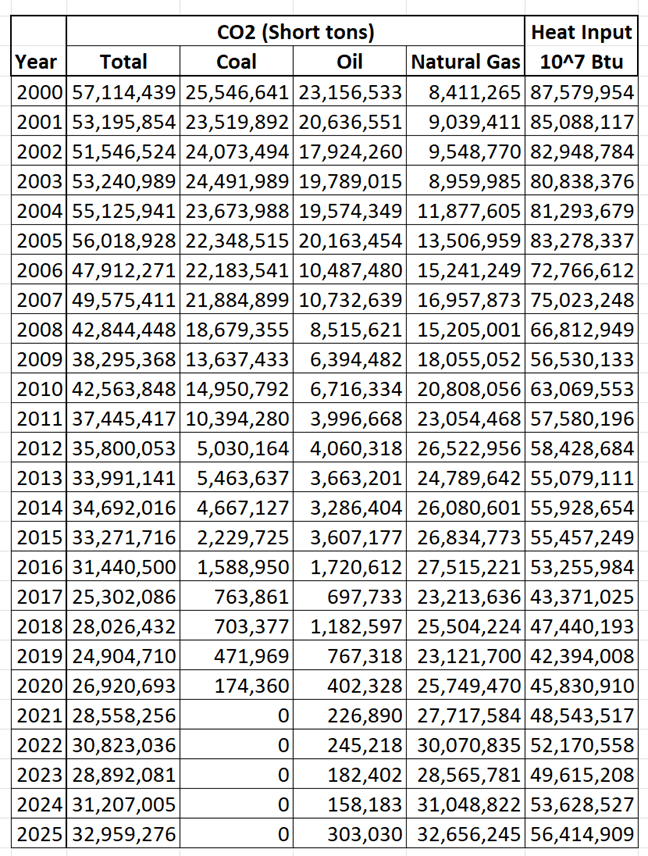
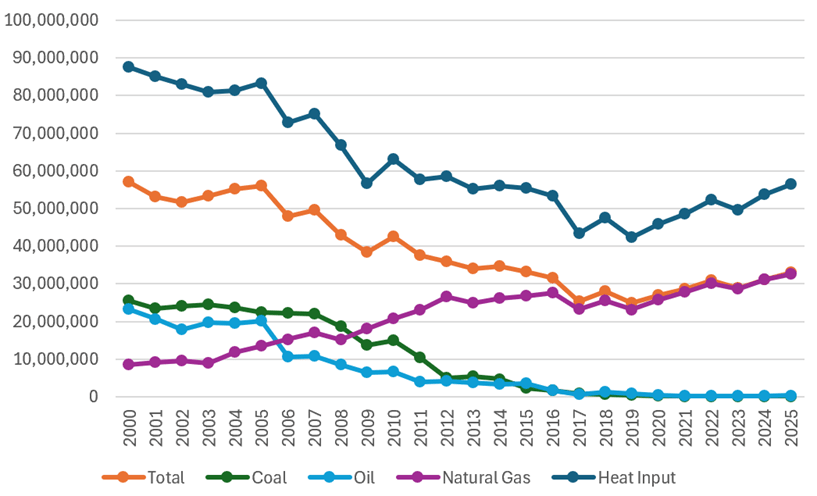
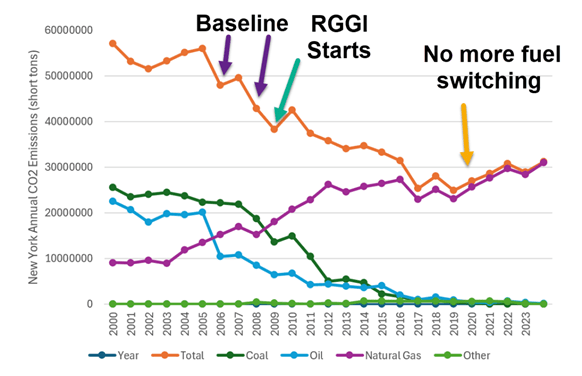
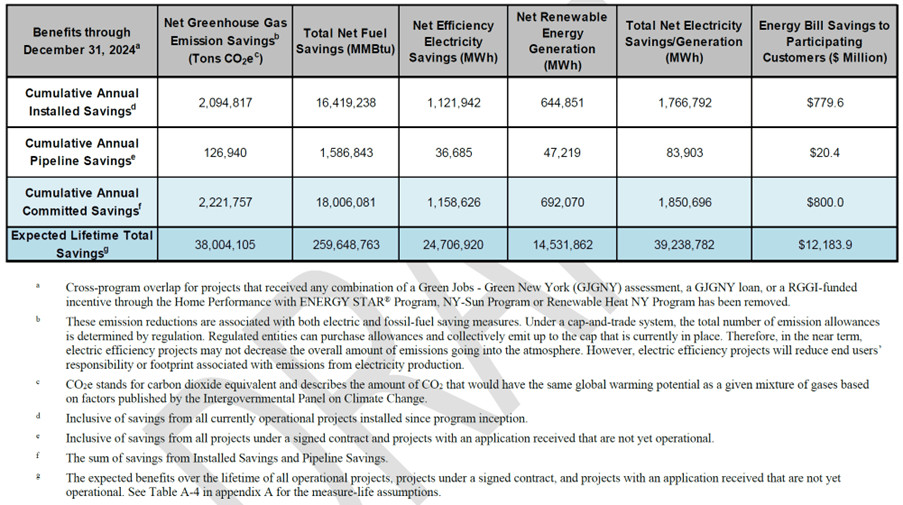
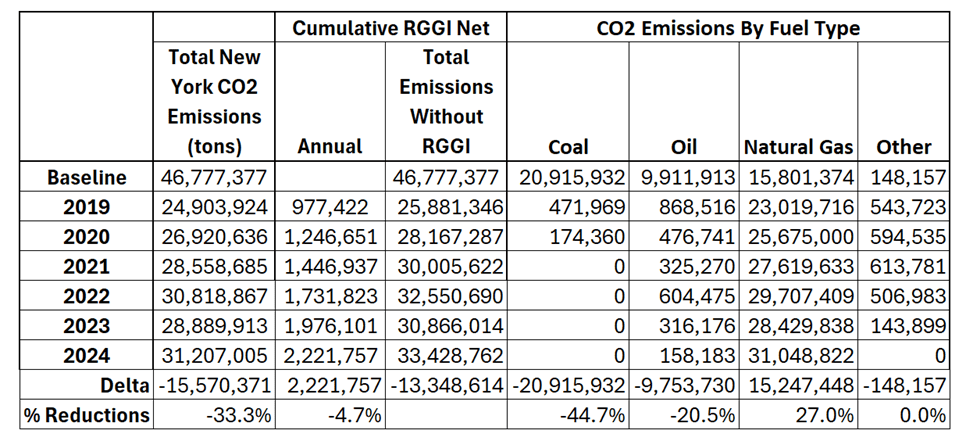
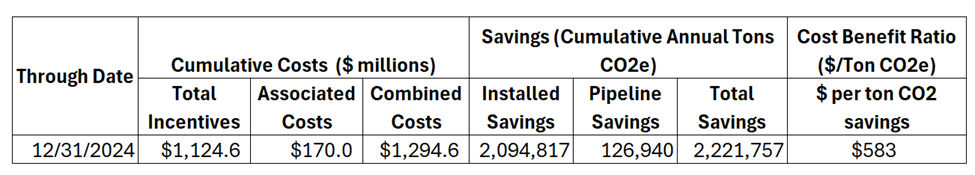
This blog has a web page dedicated to RGGI articles. My work shows that RGGI has not effectively reduced CO2 emissions from the power sector and that most of the observed reductions were caused by economic fuel switching from coal and oil to natural gas. Emission reductions associated with RGGI investments only account for 8.7% of the observed reductions. The most recent RGGI Investments of Proceeds report notes that the RGGI auctions have raised over $4 billion and investments have reduced annual emissions a little over five billion tons. That works out to a CO2 cost effectiveness of $800 per ton. At this rate, the amount raised falls far short of the funds necessary to reduce RGGI emissions in accordance with Third Program Review requirements.
Consumer Climate Cash is about to pour into East Coast States.
This E&E News article recently argued that soaring RGGI allowance prices represent “a big opportunity” for East Coast states: hundreds of millions of new dollars that can be poured into climate programs and bill rebates just as federal support erodes. The story celebrates the first half of 2026 bringing in about $1.3 billion from RGGI auctions at record prices and frames that revenue as climate‑friendly cash that states can deploy to both cut emissions and lower bills.
Climate cash or consumer stealth tax?
The E&E article argues that soaring RGGI prices are “a big opportunity” because auctions now bring in billions more that states can pour into climate programs and bill rebates as federal support wanes. It treats this revenue as climate‑friendly cash, framing RGGI as both an emissions tool and a way to lower bills.
My work shows a different reality. Higher allowance prices don’t appear as free money; they arise because generators must pay more to produce power and recover that cost through wholesale markets. What looks like a windfall in state budgets is in fact a hidden, regressive tax on the backs of consumers that show up in higher commodity prices on their bills. The key question is whether the modest bill credit or other anticipated programs offset the immediate cost impact that an individual customer faces?
What record prices really mean
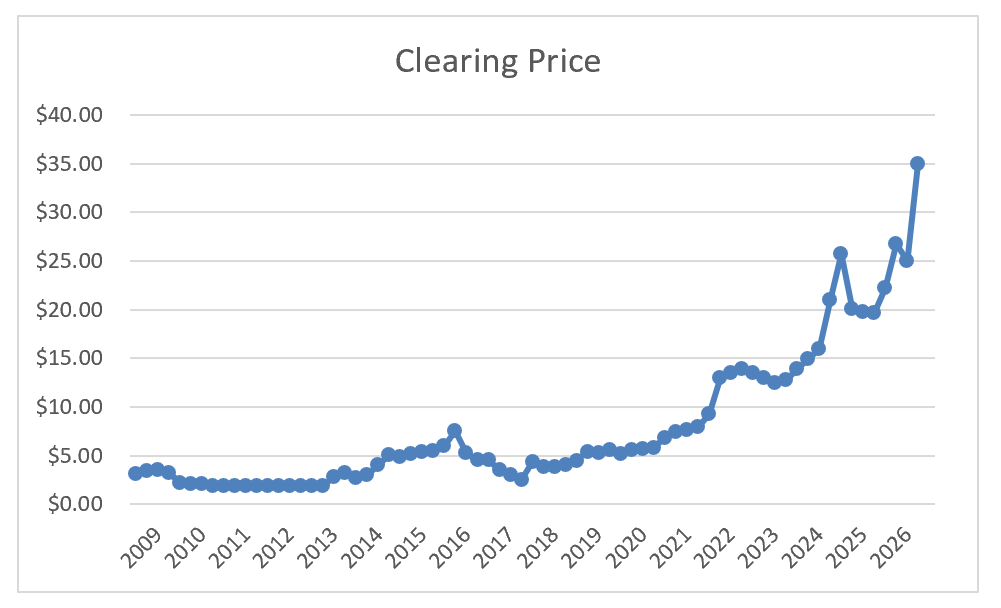
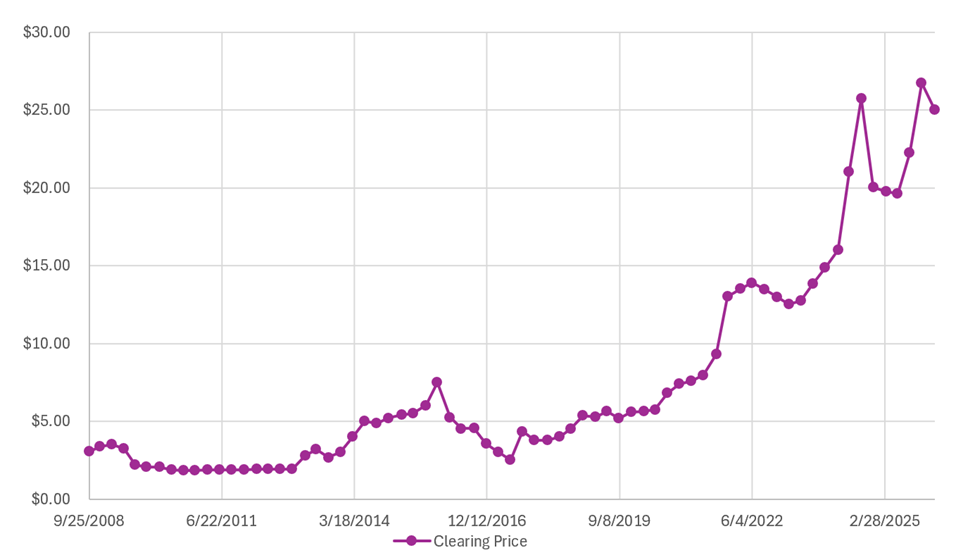
Recent RGGI auctions have cleared at about $35 per ton, a record price driven by rising load, Virginia’s re‑entry, and bottlenecks in renewable development, not by orderly decarbonization. At current emissions levels, that isn’t a marginal tweak; it’s a major cost shift onto ratepayers. Furthermore, the secondary market for RGGI allowances is higher than $35 per ton, so future costs will be even higher than shown here.
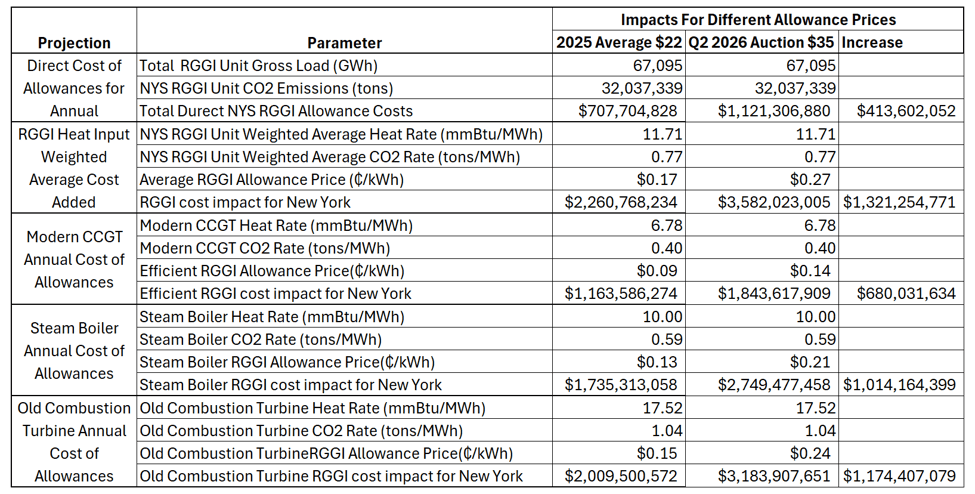
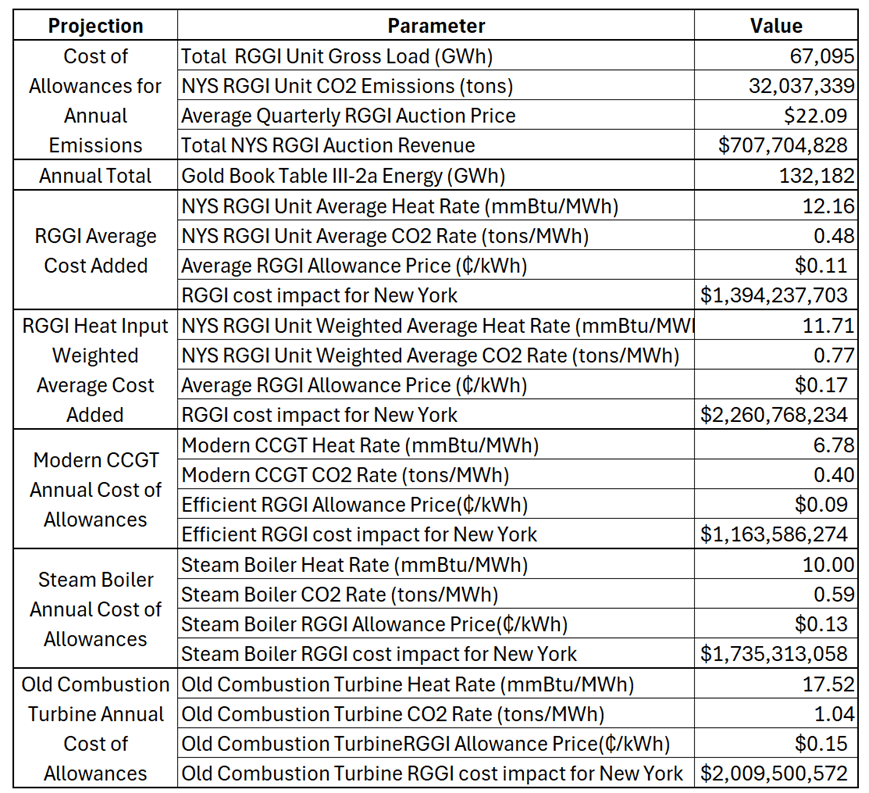
In my New York analysis, direct allowance purchases now run on the order of $0.7–1.1 billion per year for New York, with total ratepayer impacts — once wholesale price uplifts are considered — plausibly in the $1.8–3.2 billion range. The E&E article considers only the $1.3 billion in first‑half auction proceeds across RGGI states and calls it climate cash. It ignores the broader cost footprint of the wholesale market costs. To summarize, wholesale energy market impacts are $1.8 to $3.2B and auction revenues are $.7 to $1.1 billion, so the total consumer deficit is $1.1B to $2.1B. More importantly, the higher RGGI wholesale price impact flows through the energy futures trading market.
Proceeds versus total cost
The core problem in the “climate cash” narrative is its fixation on proceeds while ignoring total system costs. Every allowance a generator buys becomes a bid adder in energy markets. Because market prices are set by the marginal unit, that carbon cost flows into the clearing price and is collected on nearly every MWh sold, including from non‑emitting resources that don’t buy allowances but still receive higher revenues.
States see the portion of this money that passes through auctions, call it climate revenue, and fight over how to spend it. But ratepayers bear all the cost, and only a fraction returns to them via programs or credits. The rest is retained by non‑emitting generators or spent on administration and favored initiatives. There is no honest accounting that sets proceeds against total costs and explains the net impact on households.
The “affordability strategy” claim
To address political backlash over rising bills, the article touts RGGI‑funded rebates as an “affordability strategy.” New Hampshire returns almost all proceeds as bill credits; Virginia has earmarked about half of its RGGI revenue for new rebates when it rejoins. Advocates, citing modeling from Resources for the Future, claim higher prices can ultimately lower household electricity costs.
This is appealing but misleading. In Virginia, RGGI previously added about $4 per month to the average customer’s bill; with higher prices, the projected cost is $10–$13 per month. Policymakers propose a roughly $3 per month rebate funded from RGGI proceeds and call that affordability. RGGI raises bills with a hidden surcharge, then politicians refund part of what was collected and declare victory for ratepayers.
Rebates are also politically fragile and temporary. They can be redirected or cut in a budget cycle and don’t alter the underlying wholesale price adder from the carbon requirement. Even if they work as proposed, there is a lag between electric bill payments and rebates which could be problematic for any ratepayers with affordability issues. Furthermore, there are transactional costs incurred that someone must pay for. The structural reality remains that RGGI pushes base prices up by design. Rebates partially mask that effect for some customers in some years. That is not what most people would consider a genuine affordability strategy.
Regressive and opaque incidence
The E&E article barely addresses who pays and who benefits. Because RGGI costs flow through wholesale settlement rather than being itemized on bills, customers simply see higher prices without a clear explanation. Low‑ and moderate‑income households, who spend a larger share of income on electricity and have less ability to adapt, pay more but are not guaranteed proportional relief.
Meanwhile, proceeds are distributed across bill assistance, efficiency, resilience projects, and administrative overhead. Some households receive credits; others do not. Non‑emitting generators gain from uplifted wholesale prices. The impact of RGGI is regressive and opaque. Ordinary ratepayers shoulder most of the burden, while benefits are dispersed based on policy choices rather than a transparent link to who paid.
An affordability‑focused policy would rely on explicit charges, clear line items, and targeted assistance to vulnerable customers, not wholesale price increases and intermittent rebates. RGGI’s current structure sacrifices transparency for political convenience.
Are efficiency gains enough?
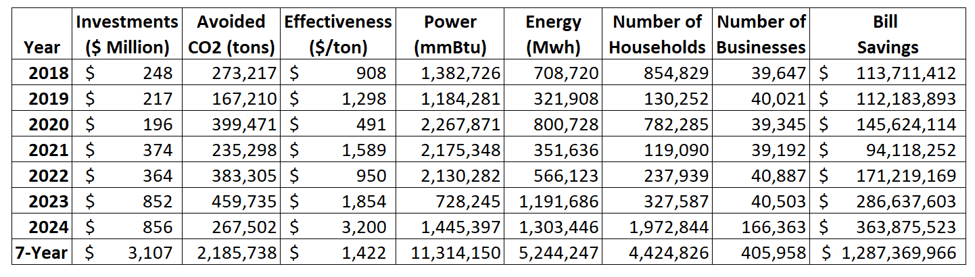
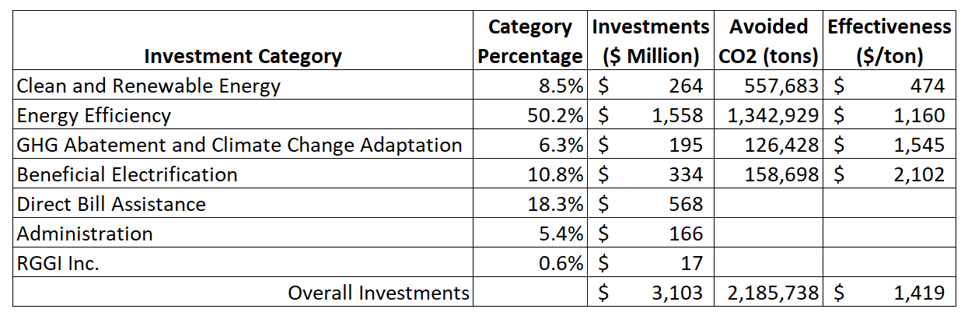
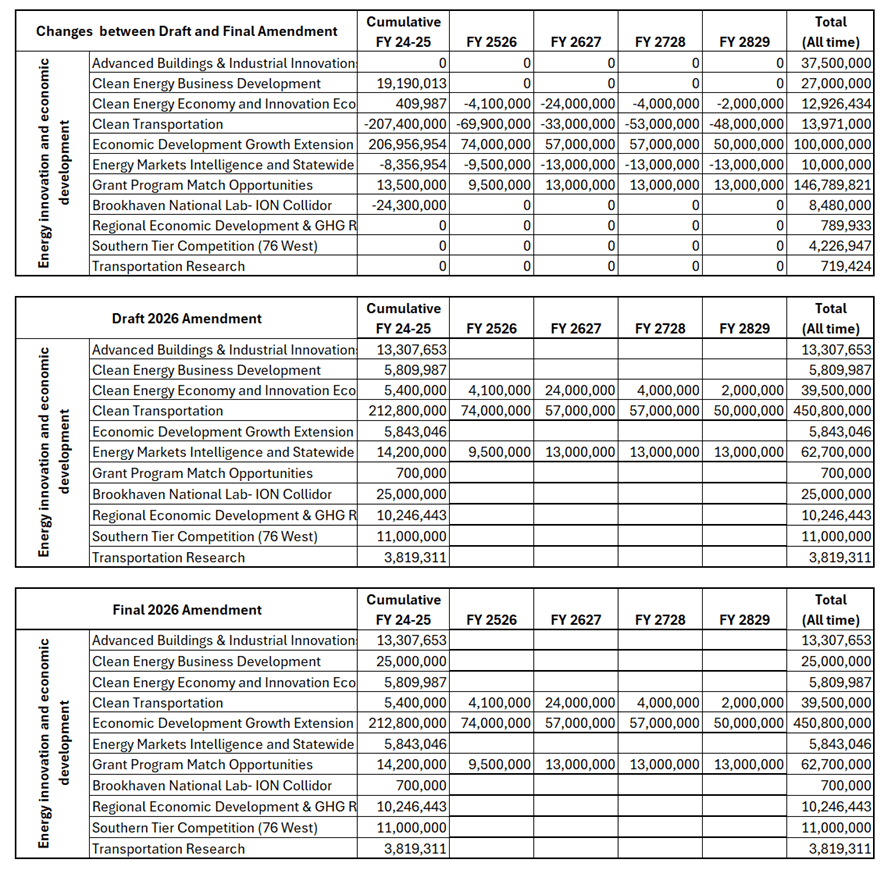
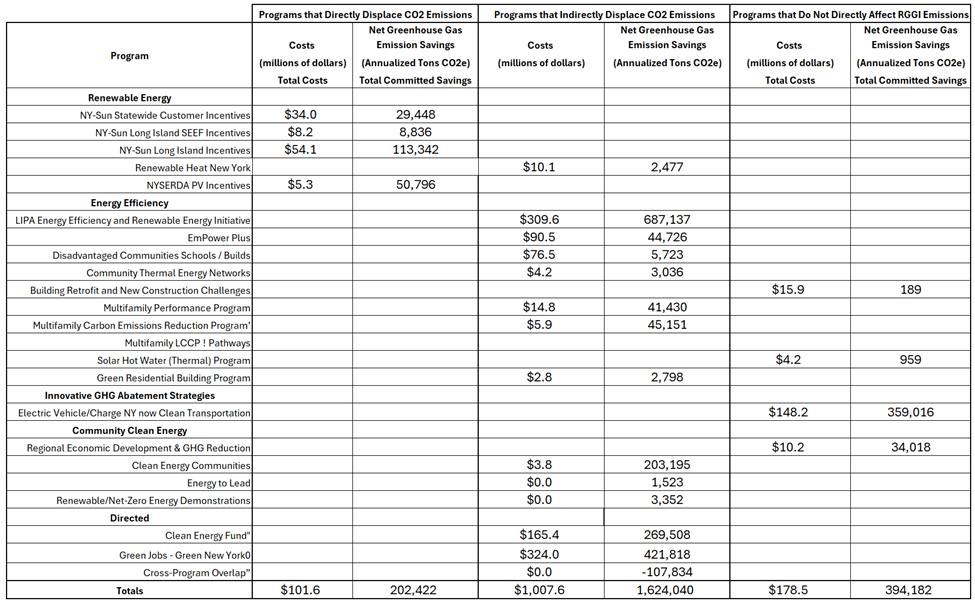
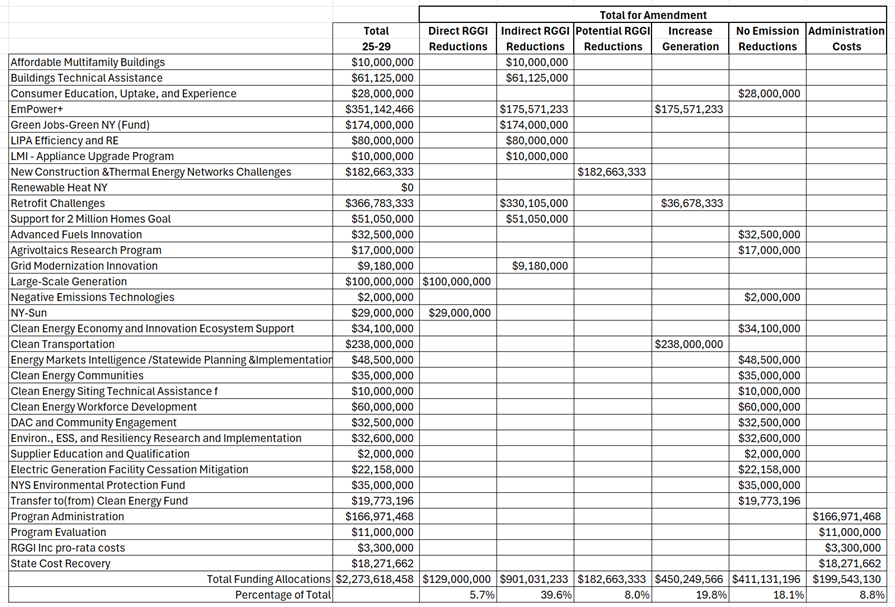
I have evaluated RGGI proceeds reports and Acadia Center claims that billions of investment dollars have produced even larger lifetime bill savings that the E&E report accepts without skepticism. Efficiency and related programs funded by RGGI do provide benefits, but those estimates are modeled, spread over many years, and largely based on periods when allowance prices were far lower and system conditions were different. It is also important to note that RGGI categorical investments are not what I believe are cost effective (Table 1).
Table 1: Summary of Recent RGGI Categorial Investments and Avoided Emissions Over the Last 7 Years

When you compare these long‑run, modeled savings to the very real, near‑term multi‑billion‑dollar annual costs implied by $35 per ton in a context of rising load and stalled renewables, the offset is much less convincing. Advocates are using uncritical assessment of historical performance under a less stressed regime to justify today’s much higher tax incidence. That’s not a sound basis for declaring RGGI an affordability success.
Leakage, effectiveness, and reliability
The article briefly mentions New Jersey concerns about leakage — the idea that RGGI shifts emissions rather than reducing them — and an alternative flat‑fee proposal. Independent analysis has gone further, suggesting RGGI may not be functioning as intended and could even increase net CO₂ emissions while costing consumers billions once cross‑border flows and market interactions are fully considered. I do not think leakage is theoretical any longer; it is inevitable, especially given the interconnected nature of PJM and the ability of non‑RGGI generators to serve load in RGGI states. If that’s true, high proceeds are not proof of climate success; they are evidence of design failure.
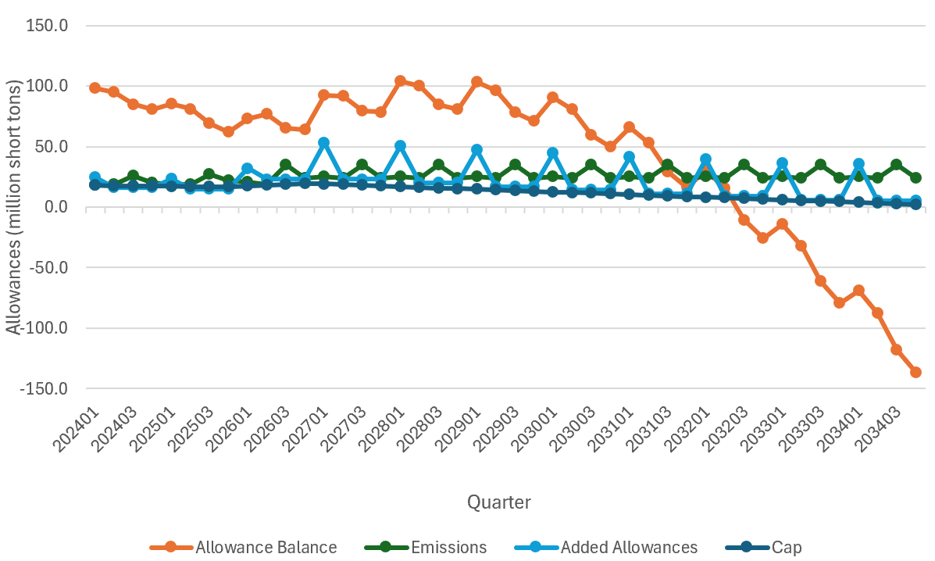
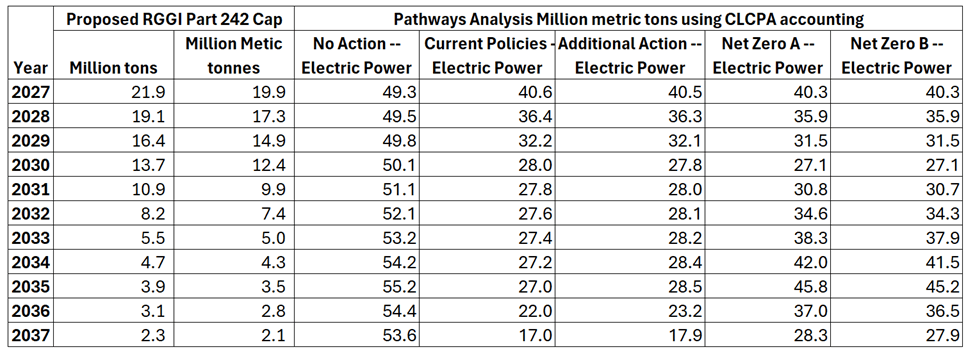
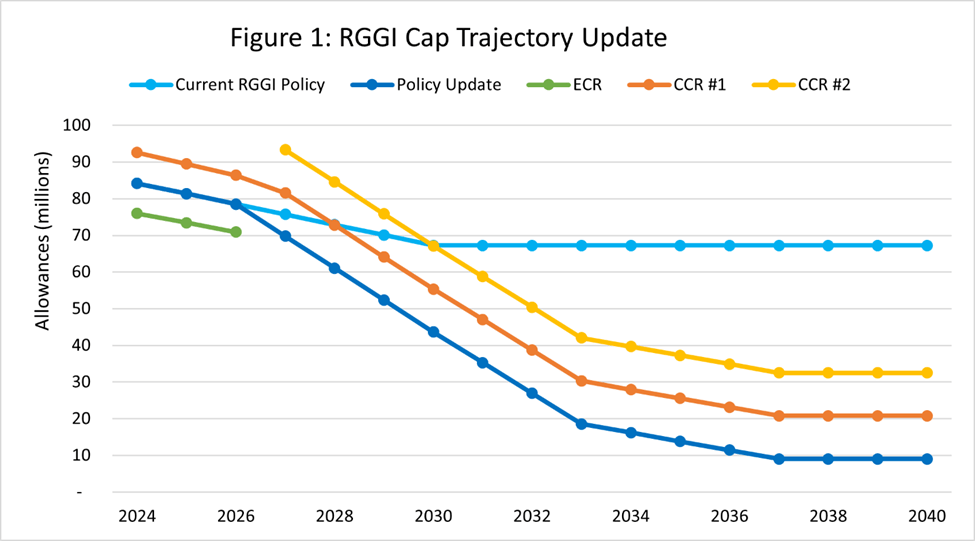
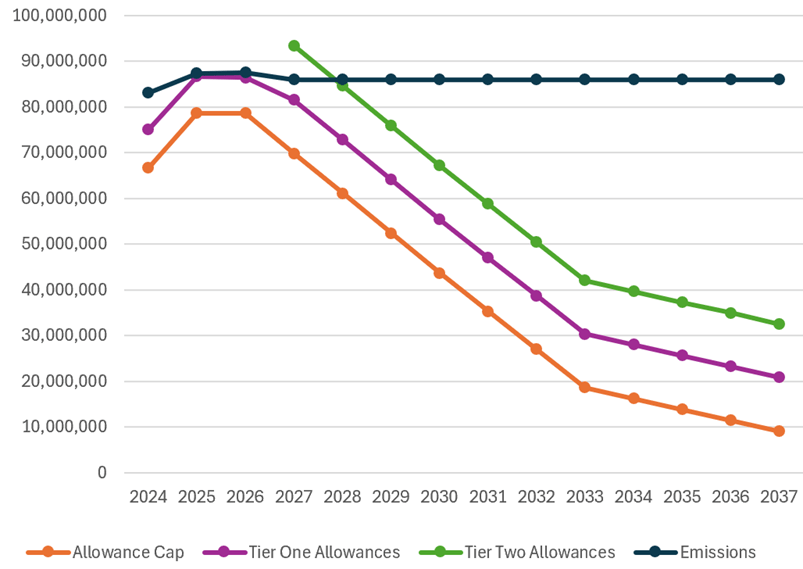
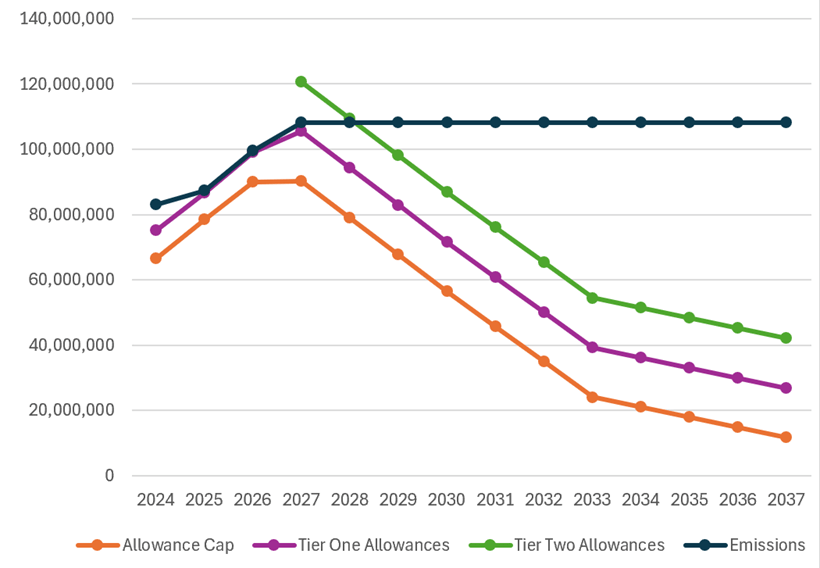
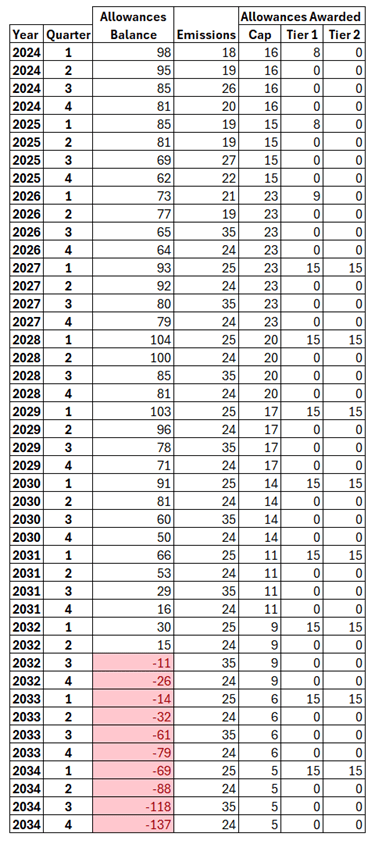
At the same time, the updated cap trajectory cuts allowances by more than 10% of the 2025 budget each year from 2027 to 2033, a pace the region has never sustained. Load is increasing; renewables face federal and local bottlenecks; dispatchable thermal capacity remains essential. Record prices in this context are a reliability warning as much as an affordability problem. Yet the article treats RGGI mostly as a fiscal tool, without grappling with its interaction with grid physics and capacity needs. Higher allowance prices, higher imports from non-RGGI states, higher CO2 emissions, consumer affordability concerns, and potential reliability based issues are the consequences of the current RGGI design.
Time for RGGI Changes
It appears to me that the E&E article is part of a concerted effort by climate NGOs, sympathetic lawmakers, and policy analysts who see RGGI as one of the few remaining levers to fund climate-related programs in a hostile federal policy environment to disparage any of the many observed issues with RGGI. RGGI is an increasingly blunt, costly, and opaque instrument to pursue climate and affordability goals.
If states truly care about both, they should:
- Use transparent funding mechanisms instead of hiding costs in wholesale prices.
- Align any carbon price with realistic emissions paths and reliability needs.
- Build strong safeguards against leakage and measure net emissions outcomes honestly.
- Explicitly compare total RGGI costs with proceeds and commit to returning a defined share of net costs to ratepayers in predictable ways.
As things stand, RGGI at $35 per ton looks more like a stressed carbon tax with uncertain climate benefits than a stable source of “climate cash.” Higher allowance prices should be treated as a warning signal that the program’s design and trajectory need serious re‑evaluation, not a cause for celebration.
interest. I believe that given the energy affordability concerns within the RGGI states and the poor performance of this emission reduction program, that RGGI needs to be paused if not rescinded altogether.