

The New York Independent System Operator (NYISO) prepares an annual report on “forces shaping the electric grid and wholesale electricity markets.” NYISO’s Power Trends 2026 is a notable document because it says many of the right things, even if it still does not say them quite as bluntly as the situation deserves. The report acknowledges that electrification, large new energy-intensive loads, retirement of conventional resources, and weather-dependent generation are combining to make the system more uncertain and more fragile. It also says reliability margins are shrinking and that winter conditions are becoming a defining challenge. That is an important step forward, but it is also an implicit admission that the Climate Leadership & Community Protection Act (Climate Act) implementation process has been pushing the grid toward a level of risk that the state has not honestly grappled with.
I have written over 650 articles about the Climate Act and I am convinced that implementation of the Climate Act net-zero mandates will do more harm than good if the future electric system relies only on wind, solar, and energy storage because of reliability and affordability risks. The opinions expressed in this post and in my filing do not reflect the position of any of my previous employers or any other organization with which I have been associated; these comments are mine alone. I acknowledge the use of Perplexity AI to outline this post and draft the text used in this document.
Power Trends 2026
The Executive Summary states:
Power Trends explores the issues shaping New York’s electric system as it undergoes a historic transformation driven by simultaneous changes in supply, demand, and infrastructure.
The report highlights increasing and more uncertain electricity demand, a changing generation mix, and a system that is more geographically dispersed, weather‑dependent, and operationally complex. Maintaining reliability depends on disciplined planning, timely investment, and market structures that align investment with system needs and value operational performance during stressed conditions.
NYISO provides the report, a key trends fact sheet, a note from the NYISO president and CEO, and report figures and resources.
Key Findings
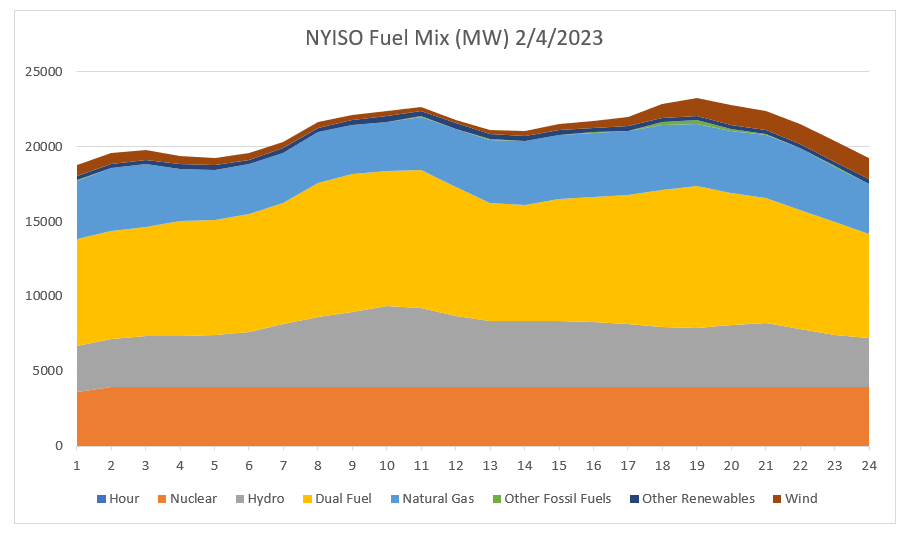
The report highlights five big trends: declining reliability margins, rapid and uncertain load growth, shifting seasonal risks, a changing resource mix, and expanding system uncertainty. That is a polite way of saying the grid is getting harder to run while the policy environment keeps adding complexity. NYISO is also explicit that the system needs generation, storage, transmission, and demand-side solutions that can perform during extended periods of high demand.
The press release makes one point especially clear: NYISO wants an “all-of-the-above” investment approach supported by competitive markets. In plain English, that means New York cannot afford to bet the system on a single preferred technology or an aspiration about how fast a transformation will happen. It needs resources that are available when needed, not just resources that look good in a policy presentation.
Where this fits my concerns
My long-running concern with Climate Act implementation has been that the process has treated emissions targets as if they were operational plans. The result has been an unfortunate habit of confusing policy preference with system capability. NYISO’s report does not use that language, but it does describe the consequences: less margin for error, greater weather dependence, more uncertainty, and increasing pressure on winter operations.
That is exactly the kind of caution that should have been part of the implementation process from the beginning. Instead, the state has often acted as though the answer to every reliability question was “more renewables, more quickly,” with insufficient attention to the timing and performance of the resources that keep the lights on. NYISO now says the system needs disciplined planning and timely investment, which is a far cry from the casual optimism that has often accompanied Climate Act roll-out discussions. I remain concerned that there still are unresolved differences between the New York State Energy Research & Development Authority (NYSERDA) implementation descriptions of the transition in the Scoping Plan and the State Energy Plan and NYISO planning reports.
The report also reinforces a point that has been obvious for years: load growth is not a static assumption anymore. Electrification, data centers, and other large projects are changing demand in ways that can swamp neat planning narratives. The idea that energy efficiency and energy conservation efforts will prevent load growth is also no longer valid. That means the state’s implementation process should be more conservative, not less, because uncertainty is rising on both the supply and demand sides.
Not so Independent NYISO
One reason NYISO’s documents are often carefully crafted to not contradict NYSERDA’s transition planning documents is that they must operate in a political environment where outright candor can be punished. That does not mean the report is wrong; it means the language is often muted. In my view, that restraint is not accidental. It reflects years of pressure on NYISO to avoid sounding too skeptical about the transition path the state has chosen.
“Energy Czar” Richard Kauffman’s role in that pressure campaign should not be forgotten. In 2016 NYISO filed comments with the state saying its goal to power the state with 50 percent renewable energy by 2030 was unrealistic unless a massive investment in new transmission lines were undertaken. Kauffman sent a letter saying it was misleading, incomplete, and grossly inaccurate. Even though the NYISO filing has since proven to be correct NYISO has every incentive to soften language that might be interpreted as resistance. I believe that dynamic has contributed to NYISO documents pulling their punches when discussing the risks of the zero-emissions transition and the practical limits of the Climate Act pathway.
That matters because the public needs more than carefully crafted phrases about “uncertainty” and “scenario-based planning.” It needs a frank explanation that the current policy path creates real reliability risks unless the state changes course on pace, technology assumptions, and resource adequacy. NYISO is getting closer to that point, but it is still speaking in institutional code.
What the report gets right
To NYISO’s credit, Power Trends 2026 is not a celebratory document. It acknowledges declining reliability margins and says retirements and performance problems are outpacing additions to supply. It recognizes that winter is becoming a defining reliability season. It also states that a diverse resource mix is necessary, including generation, storage, transmission, and demand-side measures.
That is a welcome correction to the oversimplified narrative that has dominated much of Albany’s energy policymaking. The report’s emphasis on competitive wholesale markets is also important because markets are where resource adequacy should be tested in practice, not in press releases. If policymakers want reliable electricity, they should listen carefully when the grid operator says performance under stress matters. It would also be appropriate for the press to qualify any transition story lauding renewables with the concerns described in this report.
What it leaves unsaid
Even so, the report still avoids saying the most uncomfortable thing plainly: Climate Act implementation has been moving faster in policy than in infrastructure. That gap is the heart of the problem. You can mandate a future, but you cannot mandate transmission buildout, generator construction, interconnection readiness, or seasonal fuel security on a slogan-driven schedule. This means that the transition schedule must be reconsidered.
The report also does not dwell on the institutional failure implied by repeated assurances that the transition is manageable without significant tradeoffs. NYISO is now warning that the system’s margin for error is shrinking. That should be read as a warning not just about the grid, but about the policy process that created these pressures in the first place.
A better reading of the outlook
The right takeaway from Power Trends 2026 is not that New York should abandon decarbonization. It is that the future electric system must be treated as an engineering problem, not a moral assertion. Reliability, affordability, and emissions all matter, but they do not obey the same timeline, and they certainly do not respond well to wishful thinking.
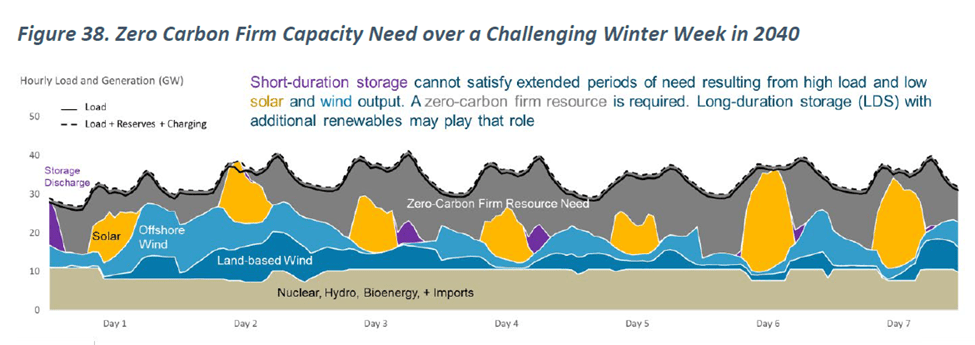
Nowhere is this more evident than the undeniable need for Dispatchable Emissions-Free Resources (DEFR). Power Trends 2026 defines this as:
A resource designed to provide reliable, on-demand electricity without emitting carbon. Unlike intermittent renewable sources like wind and solar, DEFRs can be dispatched as needed to meet demand. Many of the potential technologies are still in development and may face challenges in terms of economic viability and scalability
My concern is that DEFR is indispensable for a wind an solar dependent system, yet there is still no concrete plan to commercialize and deploy any DEFR technology at the scale required. Significant technical, economic, and regulatory uncertainties remain for all proposed DEFR options, so assuming a viable solution will simply emerge when needed amounts to taking an extraordinary reliability risk with the bulk power system. If nuclear ultimately proves to be the only practical DEFR candidate, then a grid architecture centered on wind, solar, and short duration storage cannot be implemented reliably without large scale nuclear generation. However, nuclear power is best suited to continuous, high-capacity factor operation, so holding it in reserve as an infrequently used DEFR “backup” misuses the technology and wastes its economic advantages. This problem should be resolved sooner than later.
If the Climate Act implementation process is to become credible, it needs a more honest accounting of resource availability, winter performance, the lead times for transmission and generation, and DEFR technology. NYISO’s latest outlook is useful because it points in that direction, even if cautiously. The report should be read as a signal that reality is asserting itself over rhetoric.
Conclusion
The most important thing about Power Trends 2026 is that it reflects a system under stress and a planning environment that has grown much more complicated than policymakers seem willing to admit. NYISO is telling us that New York needs a broad, reliable, market-based resource buildout, not a narrow ideology dressed up as planning. That is exactly the direction the state should have taken from the start. Instead, it is now being forced to catch up with the consequences of the flawed Climate Act and State Energy Plan implementation process. New York policy has talked as though ambitious emissions targets could be translated into real-world electric system performance simply by declaring them so. NYISO’s latest power trends report is a reminder that physics, infrastructure lead times, fuel availability, and operating reserves do not care about slogans.


