On September 18, 2025 the Public Service Commission (PSC) announced that they “received an update from Department of Public Service (DPS) staff regarding progress toward the clean energy goals of the 2019 Climate Leadership & Community Protection Act (Climate Act or CLCPA)”. The Second Informational Report (Report) prepared by Department of Public Service (DPS) staff “focuses on Commission actions from January 2023 through August 2025, and includes the estimated costs and outcomes from 2023 through 2029 to provide the most up to date information.” This post summarizes my first impressions of the Report.
I am convinced that implementation of the Climate Act net-zero mandates will do more harm than good if the future electric system relies only on wind, solar, and energy storage because of reliability and affordability risks. I have followed the Climate Act since it was first proposed, submitted comments on the Climate Act implementation plan, and have written over 575 articles about New York’s net-zero transition. The opinions expressed in this article do not reflect the position of any of my previous employers or any other organization I have been associated with, these comments are mine alone.
Background
The Climate Act established a New York “Net Zero” target (85% reduction in GHG emissions and 15% offset of emissions) by 2050 and has two electric sector targets: 70% of the electricity must come from renewable energy by 2030 and all electricity must be generated by “zero-emissions” resources by 2040. Proponents of the Climate Act argue that the transition strategies in the law must be implemented to meet these targets. However, they do not acknowledge that Public Service Law (PSL) Section 66-P, Establishment of a renewable energy program, is also a law. PSL 66-P requires the Commission to establish a program to ensure the State meets the 2030 and 2040 Climate Act obligations. It includes provisions stating that the PSC is empowered to temporarily suspend or modify these obligations if, after conducting an appropriate hearing, it finds that PSL 66-P impedes the provision of safe and adequate electric service.
Report Summary
DPS Staff prepared a presentation that summarizes the report. It explains why this report was prepared in the following slide. Note that although this is an annual report, the previous report came out in July 2023, so it is over a year late. I found no explanation for the delay in the document. This absence of any explanation for the delay is notable, particularly given that this report is intended to provide transparency and accountability regarding CLCPA implementation progress to stakeholders and the public. In my opinion, the reason it is so late is because of the messaging implications associated with explicit estimates of ratepayer costs included in the Report. I have no doubts that the Hochul Administration reviewed every statement in this document for consistency with the political messaging affordability goal of the Administration.
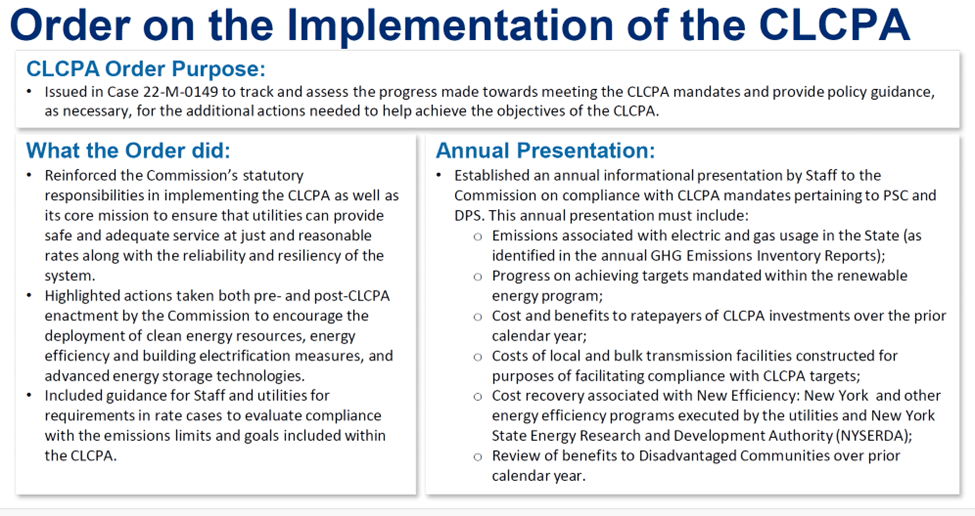
The presentation includes an outline of the Report.
- Introduction
- Summary of Actions Taken to Reduce Ratepayer Impacts of the Clean Energy Transition
- Background and Progress to Date (updates since 1st report)
- Data Collection and General Compliance
- Summary of Cost Recoveries and Benefits to Ratepayers of CLCPA Investments
- Conclusion
- Appendix:
- Generic Cases related to the Commission’s Implementation of the CLCPA
- Additional Data Points Regarding NYSERDA’s Clean Energy Standard (CES) Numbers
- Historical Electric and Gas Bills 2023-2024
- Forecasted Electric and Gas Bills 2025-2029
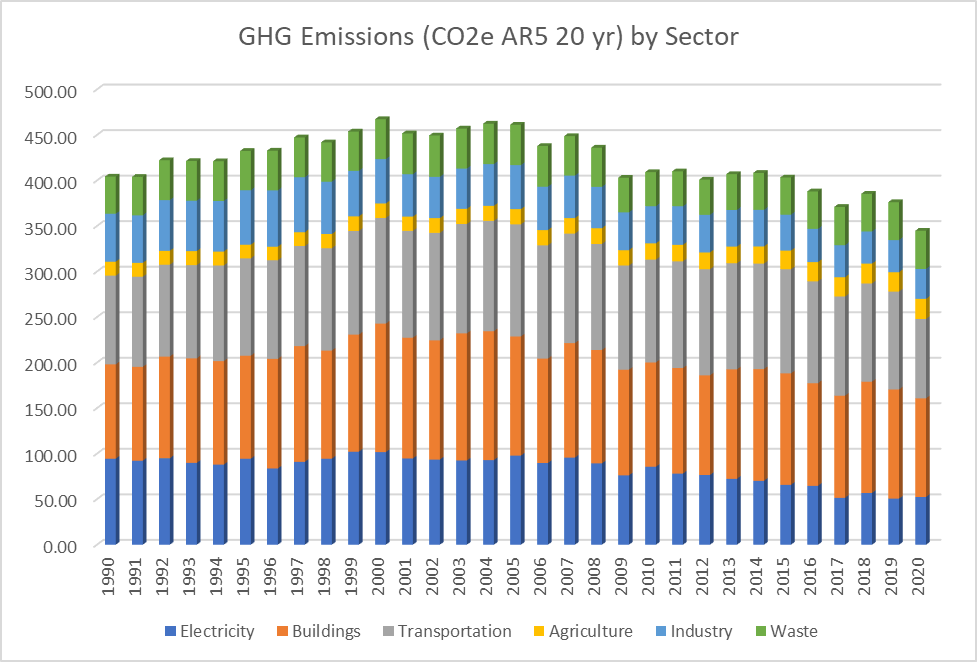
The Progress to Date section includes estimates of GHG emission reductions. I will address those claims in a subsequent post.
2025 CLCPA Report Presentation Conclusion
There is a lot of information in this report making it difficult to decide what points to summarize. This overview will concentrate on the DPS Staff conclusions because it is indicative of the intended message of the Report.
The conclusions in the presentation and my comments are listed below.
• The CLCPA was passed by the legislature and the main source of funding to achieve its objectives is through utility rates; although the CLCPA is a component of rates, it is not the primary component of rates.
• There are also significant compounding factors beyond the legislative directives in the CLCPA that are driving up utility rates.
The first two conclusions introduce the message that even though ratepayer costs are going up don’t blame the CLCPA for the increases.
• New York’s utility infrastructure is aging and requires significant investment to maintain safety and reliability; replacement and upgrade costs are higher than what was experienced in the past.
• New York is experiencing unprecedented energy demand due to economic development and electrification which is going to require tens of billions of dollars in investments, including those in generation resources, over the next several years. Investing in any new generation will drive up utility rates.
The other primary message that the Hochul Administration is trying to sell is that utility rate case increases are inevitable because of aging infrastructure. Two points need to be considered. Because rate case increases are so politically charged, pressure to bring down costs is huge. Investments to replace aging infrastructure are easy to defer because there are no stakeholder advocates for them. The result is illustrated by the New York State Electric & Gas/ Rochester Gas & Electric ongoing rate case where the largest component of rate increase projects is for “legacy corrections” which is an euphemism for work that everyone agreed needed to be done in the last rate request but got cut out when the costs got too high. That decision was made by politicians but do not expect that they will accept responsibility for the impact on costs in the current rate case.
The second point is choosing what costs are associated with state CLCPA policies to eliminate fossil fuel use is a judgement call. The “unprecedented energy demand due to economic development and electrification” includes demand that, were it not for the push to electrify everything to reduce emissions in the CLCPA, would not be required. For example, the push to use heat pumps everywhere ignores the reality that total energy costs are higher when heat pumps replace high efficiency gas-fired furnaces. There will also be increased electric demand for electric vehicle charging. Apportioning aging infrastructure replacements to upgrades only necessary to provide the extra capacity necessitated by CLCPA electrification goals is a judgement call that I believe is biased to favor keeping the CLCPA costs as low as possible.
• New York is seeing increases in energy supply costs due to rising commodity prices in the global markets; these macroeconomic pressures directly increase New Yorkers’ utility bills.
I agree with this. However, cynics like me could point out that if we had developed our own natural gas resources that we would not be so dependent upon global markets.
• Some of the programs reflected in the report predate the CLCPA, and it is true that we would still be doing some of them—namely the energy efficiency programs—absent the CLCPA because they provide system- wide benefits. This makes it challenging to split out the portion of existing initiatives that are exclusively linked to the CLCPA.
This is an encouraging paragraph. As far as I can tell, DPS staff did not try to break out costs solely due to the CLCPA law like New York State Energy Research & Development Authority (NYSERDA) did in the Scoping Plan and is doing with the Draft Energy Plan. NYSERDA’s approach deliberately parses out costs to hide the true cost of the transition. I applaud DPS staff for considering all costs necessary to meet the CLCPA goals.
• There are several direct and indirect benefits of CLCPA implementation, including economic and workforce development, improved public health outcomes, and increased tax revenue. These benefits will materialize across a variety of sectors, parties, and timeframes, and are therefore difficult to standardize and quantify in a yearly report.
I am not impressed with these claims. Proponents of CLCPA implementation tout economic development but the reality is that there are significant downsides related to cost, efficiency, job displacement, and long-term viability for jobs dependent upon subsidies like those associated with CLCPA implementation. I found no relationship between inhalable particulates and asthma-related emergency room visits and that suggests the health outcome benefits are not as definitive as suggested.
• The cost recoveries, benefits, and other information reported are focused on the direct effects of CLCPA implementation for which the Commission has oversight authority as well as Federal Energy Regulatory Commission (FERC) jurisdictional transmission projects associated with achieving CLCPA targets.
This is a reminder that the costs described are only a portion of the total. For example, mandates to electrify homes and transportation will require New Yorkers to purchase more expensive infrastructure that is not included.
• DPS will continue to explore pathways to refine data definition, collection, comparability, and accessibility.
Ratepayer Costs
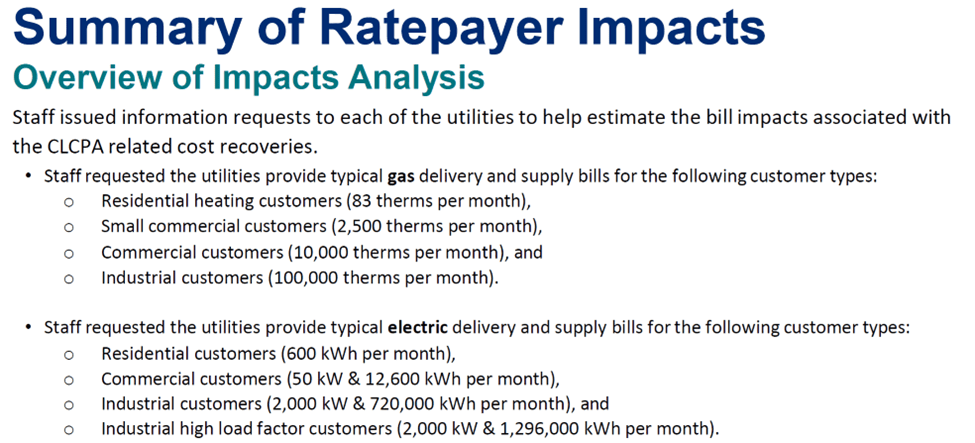
I believe costs are the biggest concern of New Yorkers. With the caveat that the people preparing these estimates have many reasons to bias the CLCPA costs low I include the following tables from the presentation. Costs presented for typical users are defined in the following figure.
4
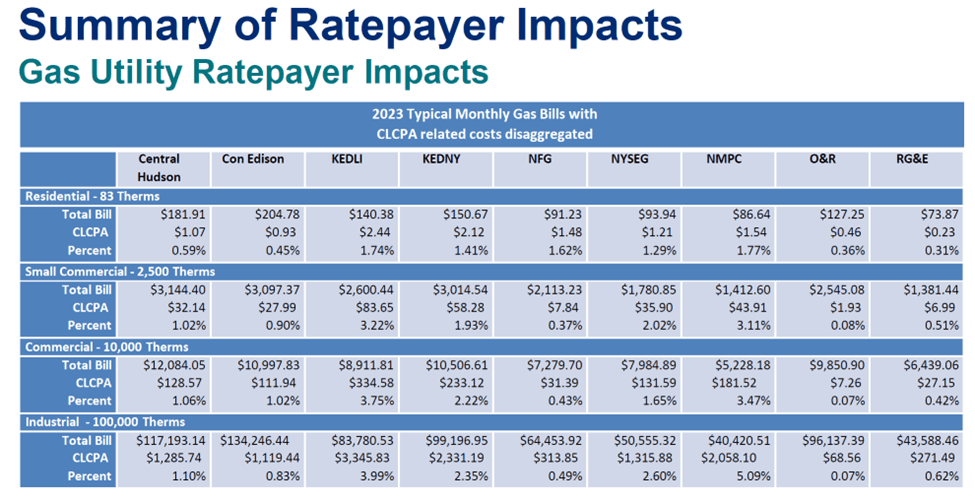
The next table describes the 2023 gas utility impacts. CLCPA impacts are minor
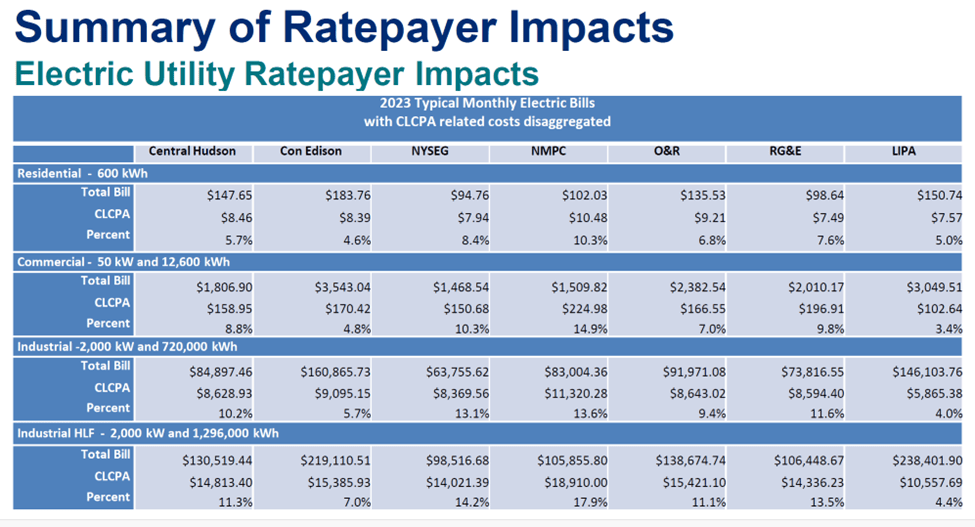
The following table describes the impact of the CLCPA on 2023 electric utility ratepayers. The numbers are indeed a small component of total costs.
I will follow up with another post looking at the cost numbers in more detail in a subsequent post.
Discussion
Although the Informational Report quantifies ratepayer impacts, I believe that the pressure to downplay costs attributable to CLCPA projects biases the results. The projections for the future are frankly unbelievable. Proving that will be the subject of a later post.
The report advances two claims. The first is the political message that even though ratepayer costs are going up don’t blame the CLCPA for the increases. While the CLCPA costs are relatively minor, they are optional at a time when affordability is a crisis. The second claim is that utility rate case increases are inevitable because of aging infrastructure. As noted, the lack of investment in infrastructure is at least partially due to political limitations on those programs in previous rate cases.
Conclusion
In my opinion, this is another New York agency report that is more about messaging than providing New Yorkers with unbiased information. I plan to follow up on some details in this report so stay tuned.