UPDATE: Two weeks after this was published I can safely now say that nobody I contacted responded. I thought that showing that $593 per month in added energy expenses would have prompted some kind of response.
A recent court decision and findings presented at the 1 December 2025 State Energy Planning (SEP) Board meeting present overwhelming evidence that implementing the Climate Leadership & Community Protection Act (Climate Act) as mandated will be unaffordable and the 2030 CLCPA 40% emission reduction target and 70% renewable energy in the electric system mandate will not be achieved. I don’t think that most New Yorkers are aware of the Climate Act much less its potential impacts, so I prepared a press release that I distributed to various New York press outlets explaining why it is time to reconsider the Climate Act. This article documents the findings included in the press release and refers to recent articles published on this blog.
I am convinced that implementation of the Climate Act net-zero mandates will do more harm than good if the future electric system relies only on wind, solar, and energy storage because of reliability and affordability risks. I have followed the Climate Act since it was first proposed, submitted comments on the Climate Act implementation plan, and have written over 600 articles about New York’s net-zero transition. The opinions expressed in this article do not reflect the position of any of my previous employers or any other organization I have been associated with, these comments are mine alone.
Overview
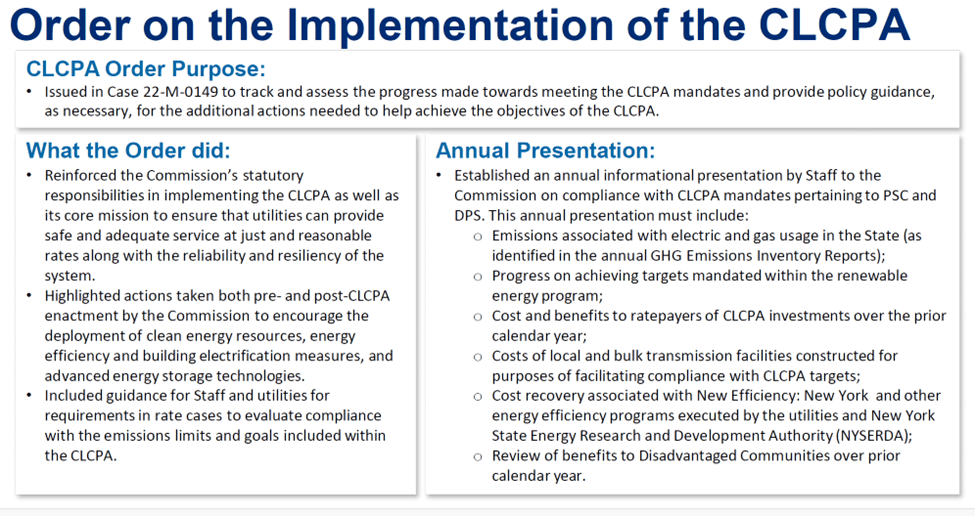
The Climate Act established a New York “Net Zero” target (85% reduction in GHG emissions and 15% offset of emissions) by 2050 and has two interim 2030 targets: 70% of the electricity must come from renewable energy and GHG emissions must be reduced 40%. The Climate Action Council (CAC) was responsible for preparing the Scoping Plan that outlined how to “achieve the State’s bold clean energy and climate agenda.” The Integration Analysis prepared by the New York State Energy Research and Development Authority (NYSERDA) and its consultants quantified the impact of the electrification strategies. That material was used to develop the Draft Scoping Plan outline of strategies. After a year-long review, the Scoping Plan was finalized at the end of 2022. Since then, the State has been trying to implement the Scoping Plan recommendations through regulations, proceedings, and legislation.
Note there is a second implementation law. Public Service Law (PSL) Section 66-P, Establishment of a renewable energy program, that requires the Public Service Commission to establish a program to ensure the State meets the 2030 and 2040 electric system Climate Act requirements.
Energy Plan Overview
In 2025 another overarching evaluation of the energy system was initiated. According to the New York State Energy Plan website (Accessed 3/16/25):
The State Energy Plan is a comprehensive roadmap to build a clean, resilient, and affordable energy system for all New Yorkers. The Plan provides broad program and policy development direction to guide energy-related decision-making in the public and private sectors within New York State.
The New York State Energy Research & Development Authority (NYSERDA) released the Draft Energy Plan last summer. Stakeholder comments were accepted until early October. The Energy Planning Board has the responsibility to approve the document. At the November 13, 2025 Board meeting there was a perfunctory description of the comments received. There was another meeting on December 1 that presented results from additional analyses. During the wrap up for the latest meeting Chair Doreen Harris said the Board will meet later this month to approve the plan. I have provided background information and a list of relevant articles on my Energy Plan page.
Court Decision
On Oct. 24, 2025, there was an Albany County New York Supreme Court decision ordering the Department of Environmental Conservation to issue final regulations establishing economy-wide greenhouse gas emission (GHG) limits on or before Feb. 6, 2026 or go to the Legislature and get the Climate Act 2030 GHG reduction mandate schedule changed. On November 3, I published an article providing detailed information about the decision.
In another article I explained that during the legal process the State submitted a letter that addressed “two categories of new developments: (1) the publication of the 2025 Draft New York State Energy Plan by the New York State Energy Planning Board on July 23, 2025 and (2) additional actions by the federal government that impede New York’s efforts to achieve the Climate Act.” The letter argued that it was inappropriate to implement regulations that would ensure compliance with the 2030 40% reduction in GHG emissions Climate Act mandate because meeting the target is “currently infeasible”.
Ordering achievement of the 2030 target would equate to even higher costs than the net zero scenarios and would affect consumers even sooner. Undoubtedly, greenhouse-gas reducing policies can lead to longer-term benefits such as health improvements. This does not, however, offset the insurmountable upfront costs that New Yorkers would face if DEC were forced to try to achieve the Legislature’s aspirational emissions reductions by the 2030 deadline rather than proceeding at an ambitious but sustainable pace.
The letter concluded that the Climate Act is unaffordable:
Petitioners have not shown a plausible scenario where the 2030 greenhouse gas reduction goal can be achieved without inflicting unanticipated and undue harm on New York consumers, and the concrete analysis in the 2025 Draft Energy Plan dispels any uncertainty on the topic: New Yorkers will face alarming financial consequences if speed is given preference over sustainability.
The Judge acknowledged that this information was relevant but ruled that DEC must promulgate regulations implementing a law however persuasive their arguments it is inappropriate are. The Hochul Administration and DEC appealed the decision on November 25, 2025 claiming that “it is impossible for the Department to simultaneously comply with both the Court’s order and its substantive statutory obligations.”
Energy Affordability
In addition to the Attorney General’s supplemental letter arguing that the Climate Act is unaffordable, there were findings presented at the State Energy Planning (SEP) Board meeting on December 1, 2025 that present extraordinary cost estimates. My article on the Energy Affordability presentation at the meeting documents the projections for a moderate-income household in Upstate New York that uses natural gas. My article found the difference between replacement of conventional existing equipment and the highly efficient electrification equipment necessary for CLCPA compliance increases monthly average energy expenditures $593 when capital costs are considered. That number was in a slide but there was only passing mention of the cost.
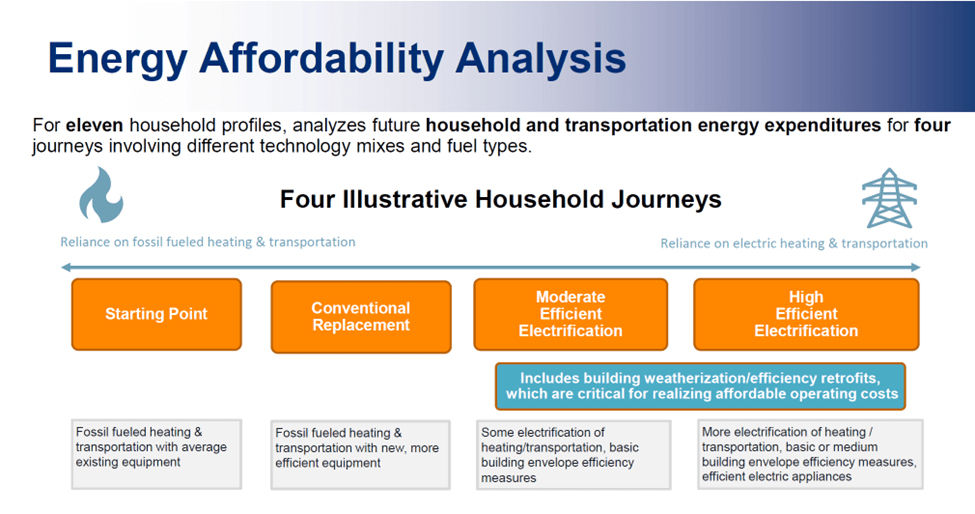
I derived explanatory numbers from information presented at the SEP Board meeting. The following energy affordability analysis slide summarizes the projection approach. It explains that for eleven household profiles, NYSERDA evaluated future household and transportation energy expenditures for four cases involving different technology mixes and fuel types. These “Illustrative Household Journeys” include:
- Starting Point: Fossil fueled heating and transportation with average existing equipment
- Conventional Replacement: Fossil fueled heating and transportation with new, more efficient equipment
- Moderate Efficient Electrification: Some electrification of heating and transportation, with basic building envelope efficiency measures
- High Efficient Electrification: More electrification of heating and transportation, with basic or medium building envelope efficiency measures, and efficient electric appliances
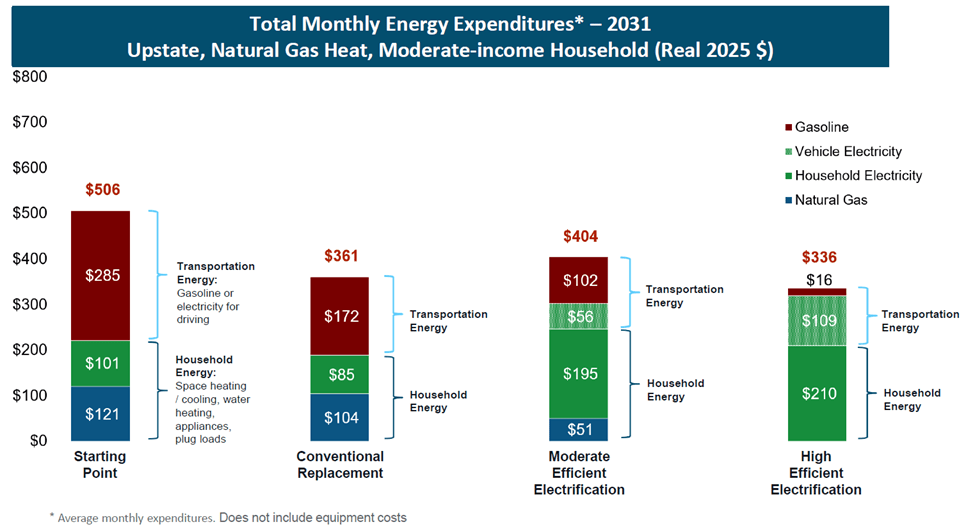
Slides were presented that describe the four journeys for several profiles. My numbers were derived from the typical Upstate moderate-income household that uses natural gas for heat household profile. This was the only profile that included all the information needed to project total cost. In the following slide, three projected “household journeys” reduce monthly energy expenditures relative to the current starting point. However, buried at the bottom of the page is the notation that these values are “Average monthly expenditures. Does not include equipment costs”.
It turns out that including equipment costs makes a difference as shown in the next slide.
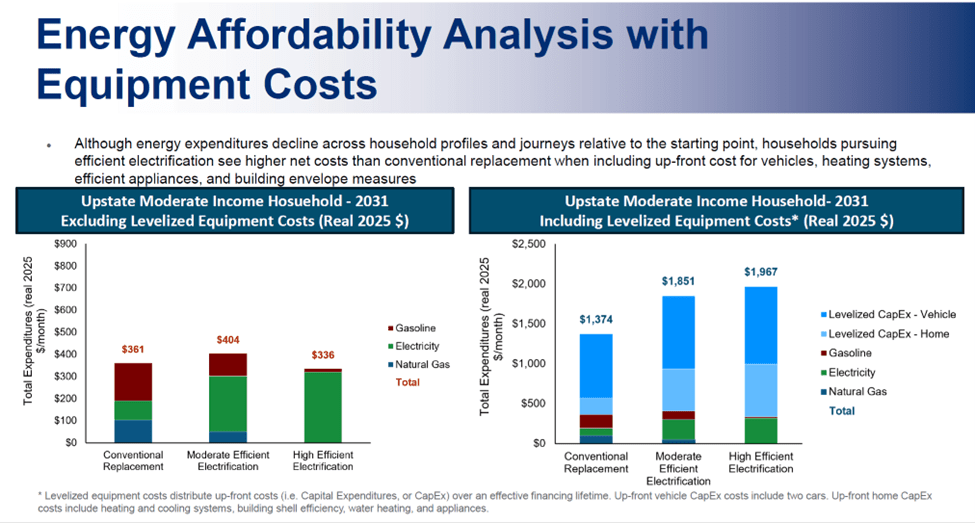
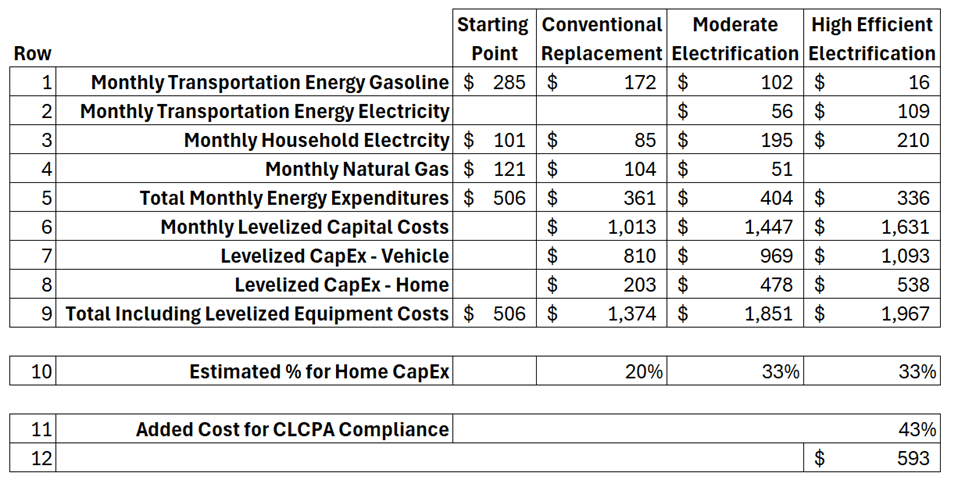
I extracted information from these slides to prepare Table 1. Rows 1-4 list the monthly energy expenditures with the total in row 5 from the first slide. The increase in efficiency decreases monthly energy costs for all three journeys but that changes when CapEx is considered. The CapEx monthly total cost in row 6 is available on the second slide. However, the breakdown between the costs of a new plugin hybrid electric vehicle (moderate electrification) in row 7 and a battery electric vehicle (high efficiency electrification) relative to home energy electrification row 8 is not listed on the included slides. I estimated the percentage of home electrification from the size of the blue bars on the right side of the second slide. (Row 10). When the CapEx costs are included all the projected alternative journeys are more expensive. Row 9 lists the total monthly energy costs including the costs of equipment from the second slide. The cost of Climate Act compliance is the difference between replacement of conventional equipment and the highly efficient electrification equipment. Row 12 lists the $593 difference necessary for Climate Act compliance and row 11 lists the 43% increase in energy costs.
Table 1: Upstate New York Moderate Income Household That Uses Natural Gas for Heat Projected Monthly Costs and Costs Necessary to Comply with the Climate Act
The affordability messaging is embedded in this table. I prepared an annotated transcript for this presentation that includes a heading for questions made during the meeting with a link to each person who commented or asked a question. I believe that this presentation and the questions asked was scripted to further the messaging of the Administration. Chair Doreen Harris of the Energy Planning Board asked NYSERDA presenter James Wilcox about energy price uncertainty. He admitted that the key driver of change over the next five years is “change in energy price”. The modeling shows that this could increase household energy spending 3% to 8% in the starting point base case but could go up to as much as 14% to 19% even if they do nothing. Chair Harris elicited a response from him that summarizes the public messaging: “That is what I was trying to elicit: What does doing nothing get you?” Even if you do nothing costs could rise as much as 19%. That is misleading because the equipment costs are the main causes of future cost not changes in energy prices.
The presentations emphasized that Climate Act costs are not the primary energy cost increase driver and that multiple factors beyond climate policy contribute to expected costs. The other implementation cost message in the NYSERDA presentations is that the additional costs to meet the Climate Act mandates are smaller than expected cost increases. This table quantifies that claim. If this example household replaces its internal combustion car with another one and replaces household appliances with natural gas appliances total costs will go up $868 from $506 to $1,374. The cost to meet the Climate Act mandates beyond conventional replacement is “only” $593 more which is less than the cost of conventional replacement.
I think the magnitude of these impacts are being downplayed as much as possible. After I published my analysis I went to the Draft Energy Plan supporting documentation page and reviewed the Energy Affordability Outputs and Input Data spreadsheet. The equipment costs are only provided as a sensitivity for one household. I think that this is by design because these costs are so extraordinary. I believe these numbers indicate a serious energy affordability crisis is coming. In my opinion, including an additional 43% cost increase is unconscionable. New York GHG emissions are less than one half of one percent of global emissions and global emissions have been increasing on average by more than one half of one percent per year since 1990. New York cannot solve global warming by itself.
Implementation Timing
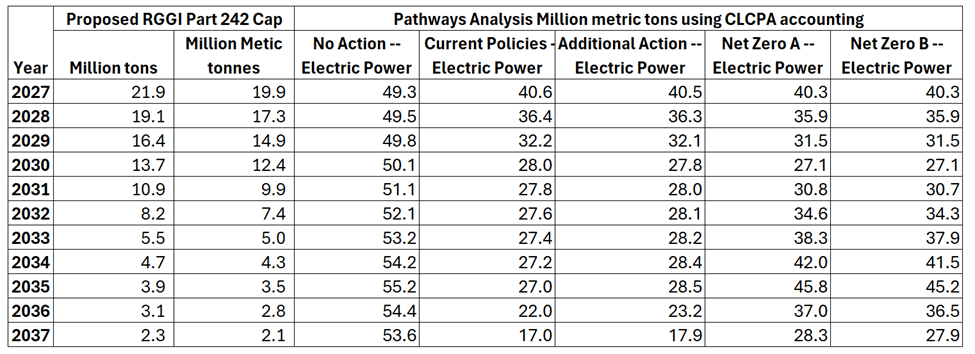
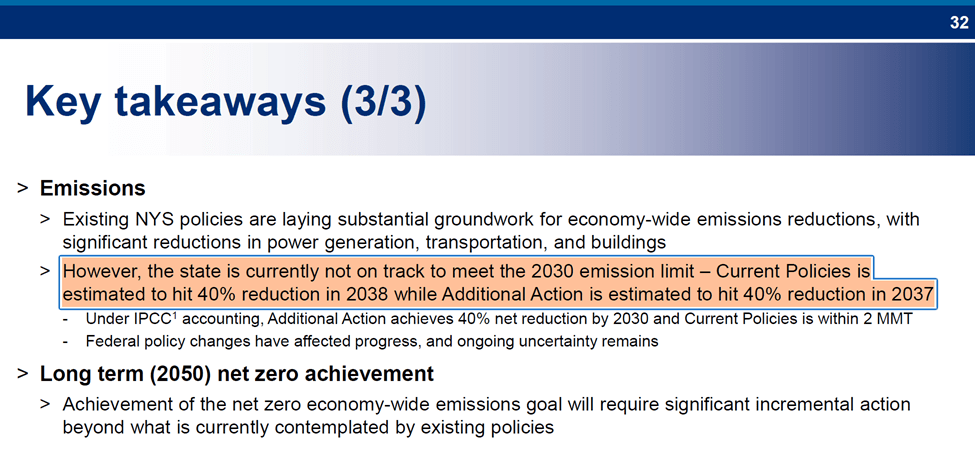
I summarized my initial thoughts about the Pathways Analysis presentation at the December SEP Planning Board meeting. The presentation found that neither the CLCPA 40% GHG emission reduction target nor the electric system 70% renewable energy mandate would be achieved on time. The “Key Takeaways (3/3)” Slide (#31) in the meeting presentation states that “the state is currently not on track to meet the 2030 emission limit – Current Policies is estimated to hit 40% reduction in 2038 while Additional Action is estimated to hit 40% reduction in 2037.”
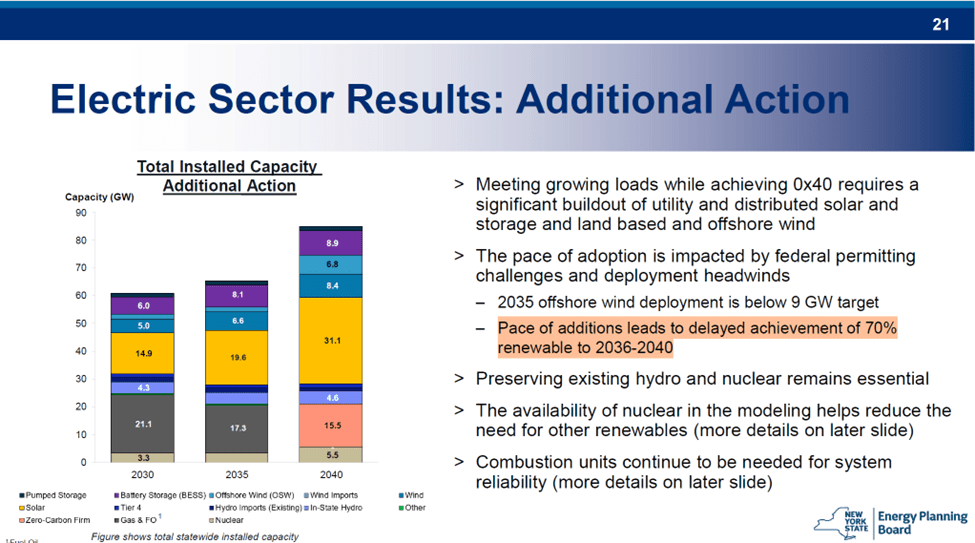
The Electric Sector Results: Additional Action slide (#21) states that “Pace of additions leads to delayed achievement of 70% renewable to 2036-2040”.
Discussion
The Court Decision and the Energy Plan findings are not the only reasons given by state agencies that it would be appropriate to reconsider the Climate Act. I described three other findings in an article last month. The New York State Comptroller Office audit of the NYSERDA and PSC implementation efforts for the Climate Act was an early acknowledgement that the implementation plan needs to be revised. The Public Service Commission (PSC) compared the renewable energy deployment progress relative to the Climate Act goal to obtain 70% of New York’s electricity from renewable sources by 2030. The final Clean Energy Standard Biennial Review Report document found that 2030 goal will likely not be achieved until 2033. Finally, The Second Informational Report prepared by Department of Public Service (DPS) staff described four feasibility concerns: the 2030 renewable energy target is “likely unattainable”, offshore wind faces major obstacles, transmission remains a “critical bottleneck”, and grid reliability challenges are mounting
There have been other recent articles arguing that New York has impossible targets. David Wojick recently published an article explaining implementation issues that I backed up with observed data. Tom Shepstone describes a New York Post editorial that cites a Progressive Policy Institute article that calls the Climate Act an “undeniable” failure.
These findings should inspire the Hochul Administration to amend the Climate Act. It is troubling that the SEP Board meeting presentations did not mention these ramifications in the presentation. Furthermore, there has been no sign that the Hochul Administration or the majority leadership in the Legislature are amenable to considering amendments to the Climate Act.
Conclusion
I was motivated to publish this and distribute it to the media because these findings have significant implications for the future New York energy system. In the near term, something must be done to reconcile the reality that the CLCPA schedule is too ambitious to have any hope of compliance. More importantly, the findings described should become the basis for a discussion of more New Yorkers. As it stands now New York energy policy is being guided by a small but extremely vocal and motivated constituency that does not understand the physics of the energy system. Thomas Sowell has been quoted as saying: “It is hard to imagine a more stupid or more dangerous way of making decisions than by putting those decisions in the hands of people who pay no price for being wrong”. In this instance, there is nothing more stupid or dangerous than ignoring the people who will pay the price if there are problems with the energy system.