Note: This is a summary of the presentation that is a version of a post at Watts Up With That. In order to prepare the summary, I documented all the slides and made that into another post.
In order to meet the Climate Leadership & Community Protection Act (Climate Act) mandates for a zero-emissions electric grid by 2040 a massive effort to deploy wind, solar, and energy storage resources and an enormous upgrade to the electric transmission system is needed. I have previously described issues associated with generating portion of this transition. This post summarizes the Alliance for Clean Energy New York (ACENY) webinar “Grid Planning to Meet Climate Act Goals” that addressed the transmission challenges in a lot of detail.
I have followed the Climate Act since it was first proposed, submitted comments on the Climate Act implementation plan, and have written over 400 articles about New York’s net-zero transition. The opinions expressed in this post do not reflect the position of any of my previous employers or any other organization I have been associated with, these comments are mine alone.
Overview
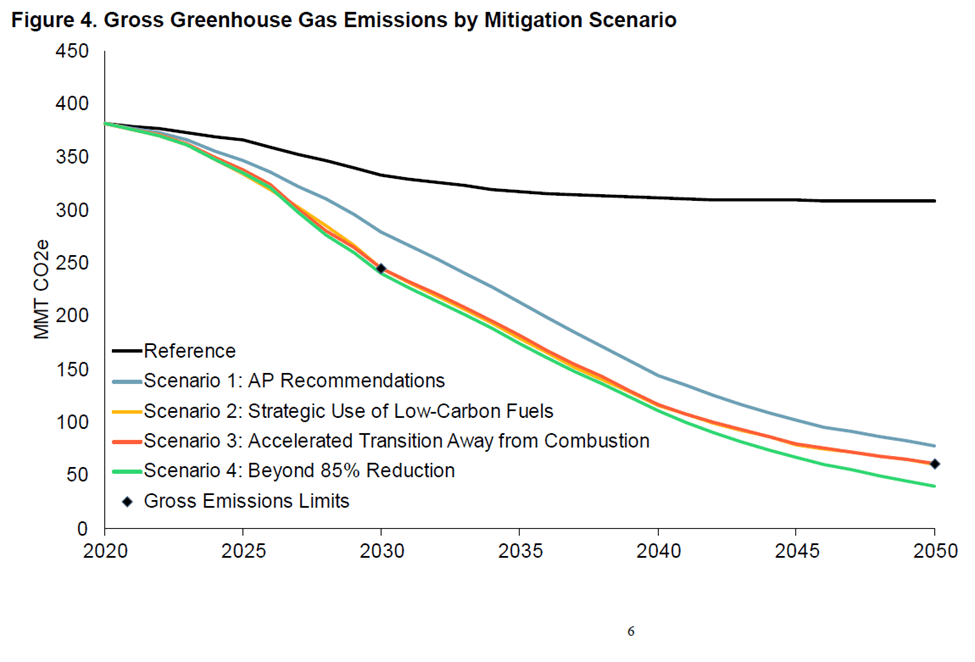
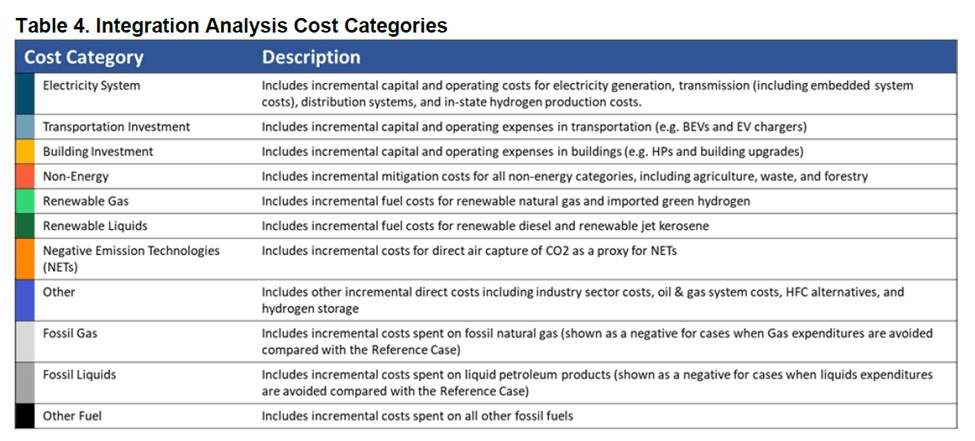
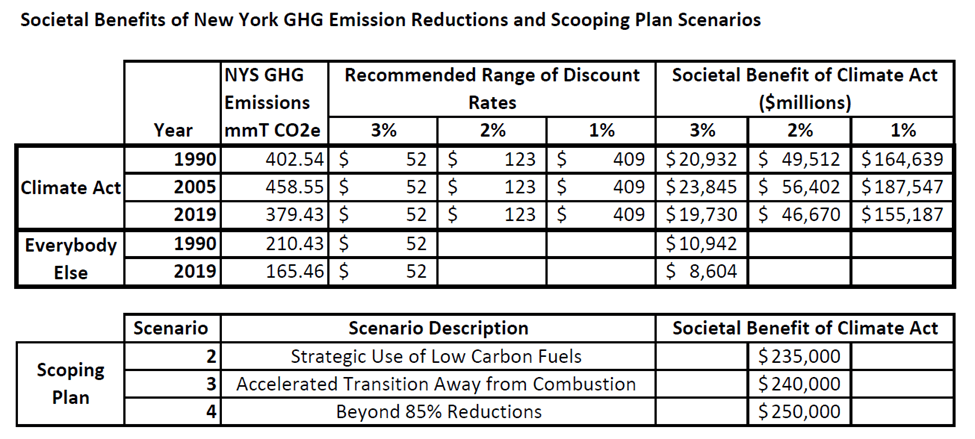
The Climate Act established a New York “Net Zero” target (85% reduction in GHG emissions and 15% offset of emissions) by 2050. It includes an interim 2030 reduction target of a 40% reduction by 2030 and a requirement that all electricity generated be “zero-emissions” by 2040. The Climate Action Council (CAC) was responsible for preparing the Scoping Plan that outlined how to “achieve the State’s bold clean energy and climate agenda.” In brief, that plan is to electrify everything possible using zero-emissions electricity. The Integration Analysis prepared by the New York State Energy Research and Development Authority (NYSERDA) and its consultants quantifies the impact of the electrification strategies. That material was used to develop the Draft Scoping Plan outline of strategies. After a year-long review, the Scoping Plan was finalized at the end of 2022. In 2023 the Scoping Plan recommendations were supposed to be implemented through regulation, PSC orders, and legislation. Not surprisingly, the aspirational schedule of the Climate Act has proven to be more difficult to implement than planned and many aspects of the transition are falling behind.
ACENY Webinar
On April 11, 2024, the Alliance for Clean Energy New York (ACENY) hosted a webinar entitled “Grid Planning to Meet Climate Act Goals” that was recorded on a video. The webinar was moderated by Chris Casey, from the Natural Resources Defense Council (NRDC) and featured speakers from the Department of Public Service (DPS), New York Independent System Operator (NYISO), and National Grid. This article describes each speaker’s presentation and provides links to sections of the video so that readers can follow the presentations.
Chris Casey, a lawyer from the NRDC opened the webinar with an overview. It was not surprising that his introduction ticked all the boxes. New York is on the “forefront of the transition to address the “impacts of destructive climate change”, increase access to “affordable” renewable energy, bolster “resilience against life-threatening extreme energy events”, all while “creating jobs and delivering substantial economic benefits”. Behind the rhetoric, however, reality lurks, and it does not look so grand. In the following sections I include slides and links to the section of the video that discusses the slide.
DPS Presentation
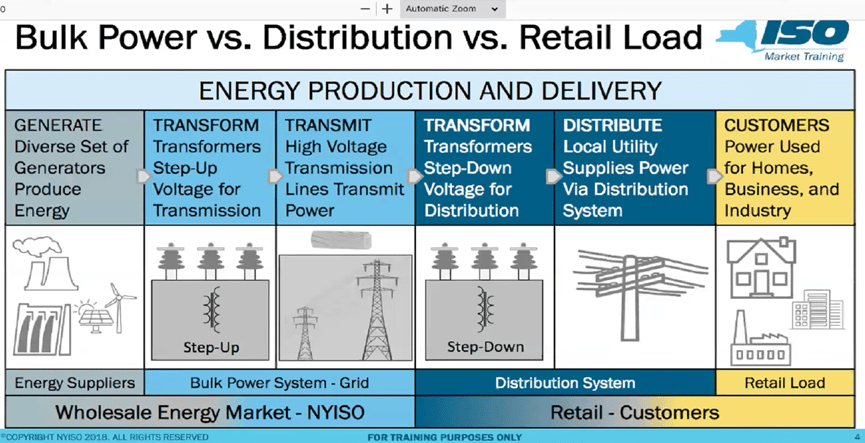
Elizabeth Grisaru (Senior Policy Advisor) from the DPS made the first presentation “Planning for Future Electric System Needs”. One of her main job responsibilities is transmission planning associated with the Climate Act transition. During her introduction she included a slide that illustrates the connections between generators and customers that were the focus of the webinar.
Since the inception of the Climate Act, DPS has begun several initiatives. These projects total $6 billion over and above what is needed to keep the system running. The investments are for both Climate Act needs and reliability issues. What was not included was the breakdown between the two needs or any estimate of how much more will be needed. Clearly many more investments will be required.
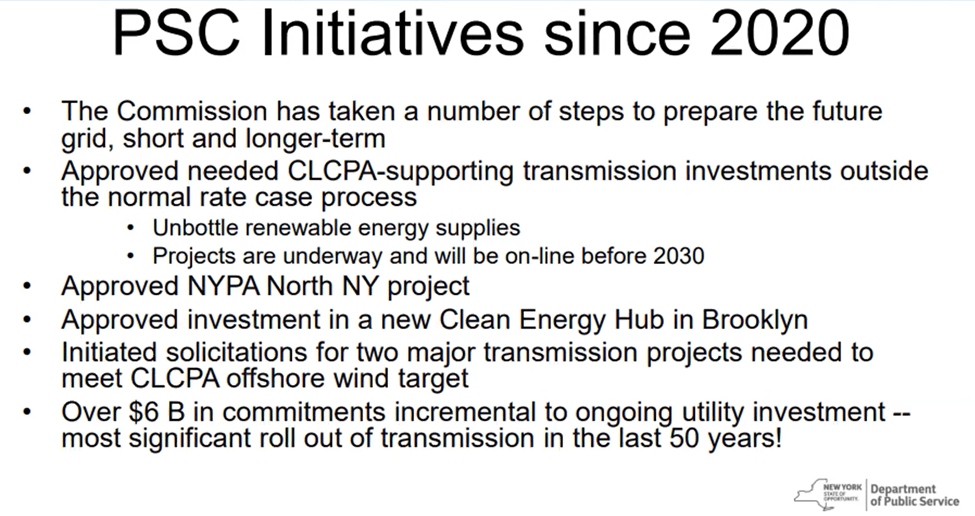
The transition to an electric system that depends upon diffuse wind and solar requires a significant upgrade to the transmission system. The PSC has a new “Coordinated Grid Planning Process” to address this issue. However, the first report will not be available until the fall of 2025. The Climate Act an interim 2030 electric grid target of 70% power from renewable sources by 2030 and a requirement that all electricity generated be “zero-emissions” by 2040. I have to say I don’t think the schedules match.
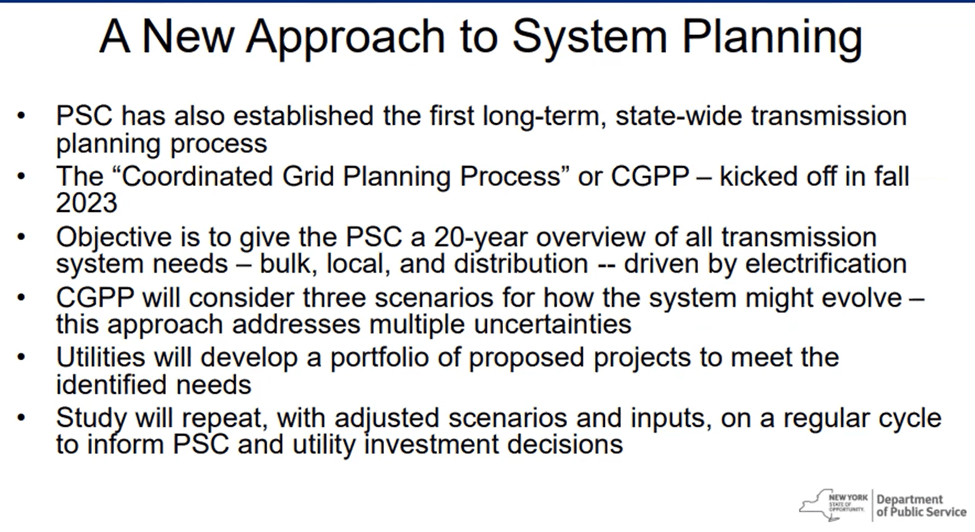
The DPS final slide addresses outstanding issues. On one hand existing sources of generation are being forced to retire while on the other hand electrification initiatives are increasing loads. Grisaru claimed that at the PSC “We all agree reliability is the most important thing we have to worry about”.

NYISO Presentation
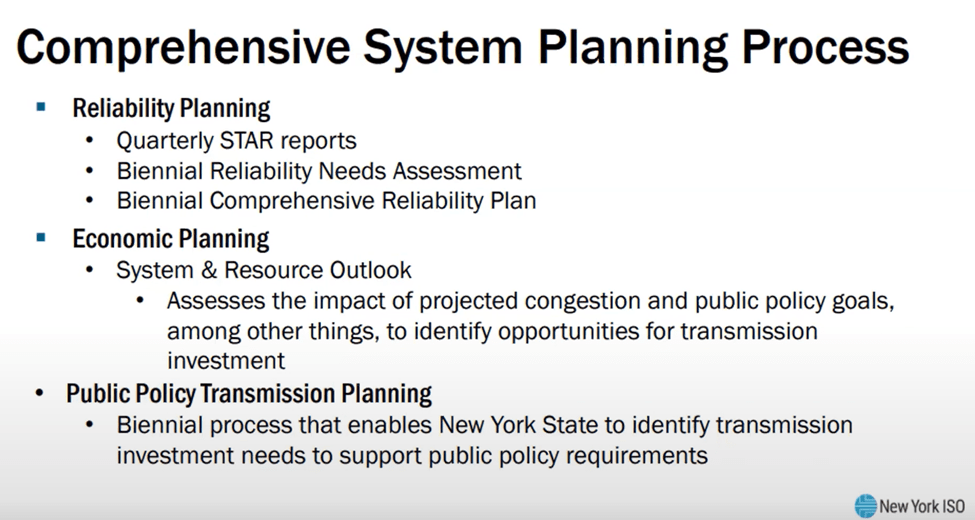
NYISO Director of System Planning Yachi Lin talked about their plans to implement a clean and reliable grid. The following slide describes the NYISO planning process. There is a two-year cycle of reliability planning that includes quarterly checks on the status of the system. NYISO is constantly evaluating future reliability needs.
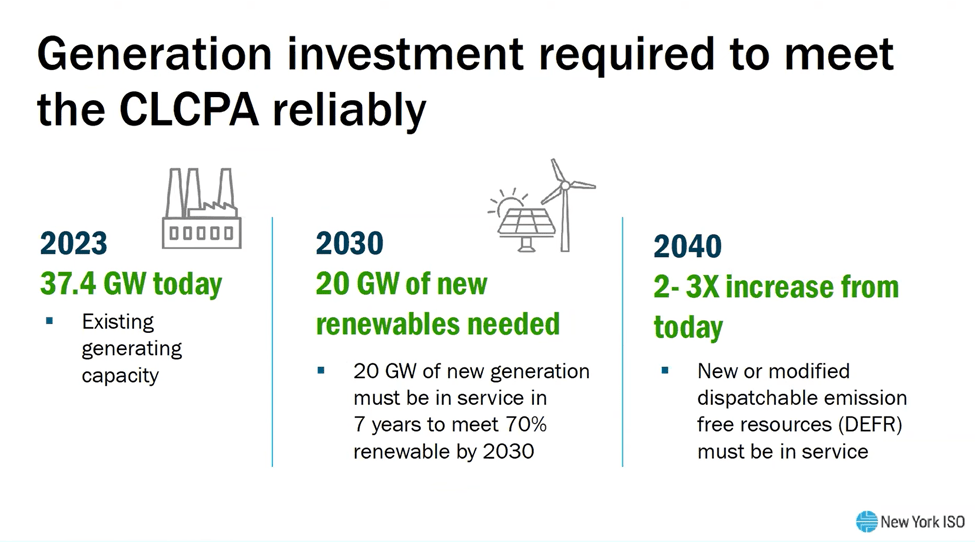
The following slide describes the generation system and the investments expected to be needed. Existing generating capacity is 37.4 GW, but an additional 20 GW must be in service in seven years to meet the 2030 goal. Note that the feasibility question has been studiously avoided by the state and the NYISO and utility companies have not overtly called the aspirational schedule out as impractical.
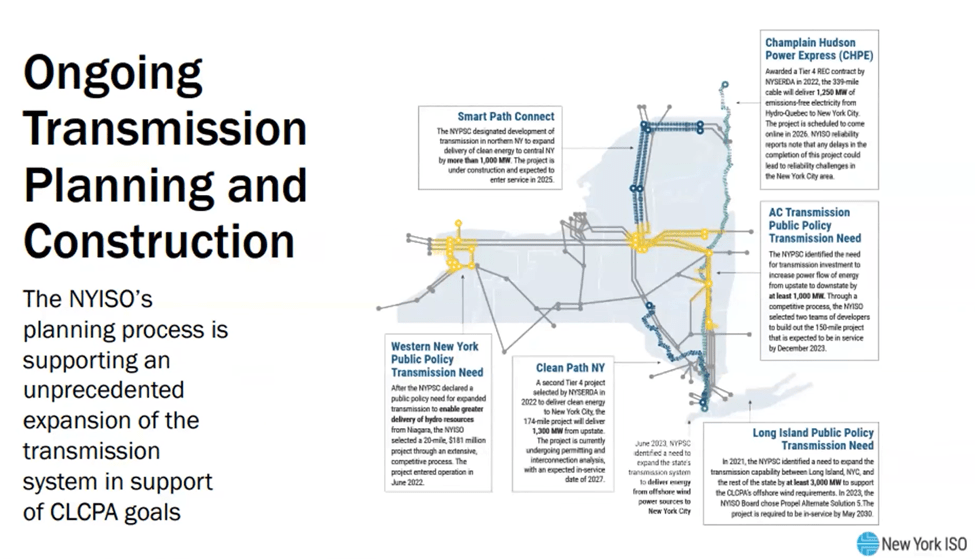
Lin explained that additional transmission is needed to meet the 2030 70% renewable energy goal. There are different areas of the state that do not have adequate transmission capabilities to move the solar and wind power out without curtailments. To address those needs the NYISO planning process is supporting “unprecedented expansion”.
One of the planning reports is the quarterly Short-Term Assessment of Reliability (STAR). Anyone interested in the status of the New York electric system would do well to listen to Lin’s explanation. The following slide notes that last year’s second quarter report noted that there was a reliability deficit of 446 MW in the summer of 2025. The deficit was projected because of fossil unit deactivations. In response, NYISO opened a solicitation for market solutions or regulatory solutions. No feasible market solution was submitted so they had to go to Plan B.
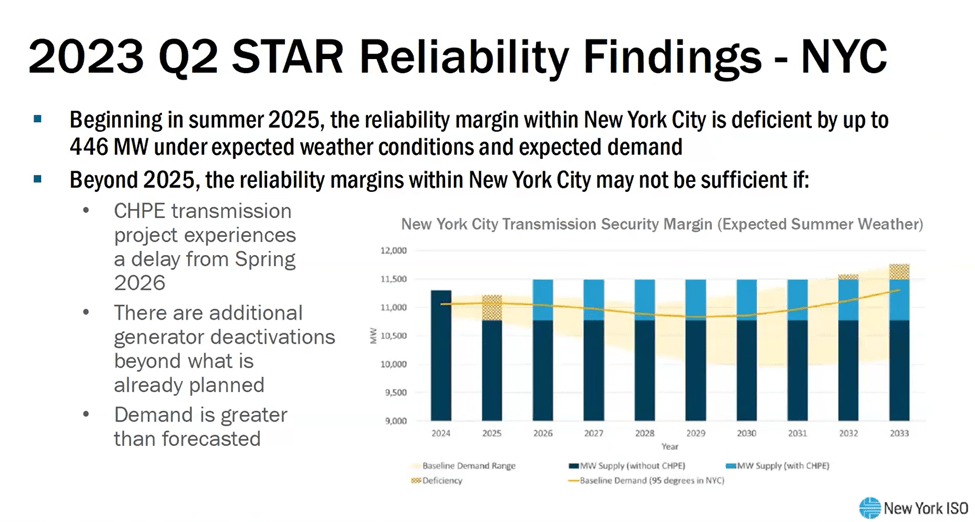
To maintain reliability, NYISO had to resort to a regulatory solution. They designated two peaking generation plants as reliability needs and postponed their retirement for two years. The NY Department of Environmental Conservation “Peaker Rule” incorporates this provision and there is a potential for an additional two-year extension. If the Champlain Hudson Power Express transmission project is delayed beyond 2026 the additional extension might be required.

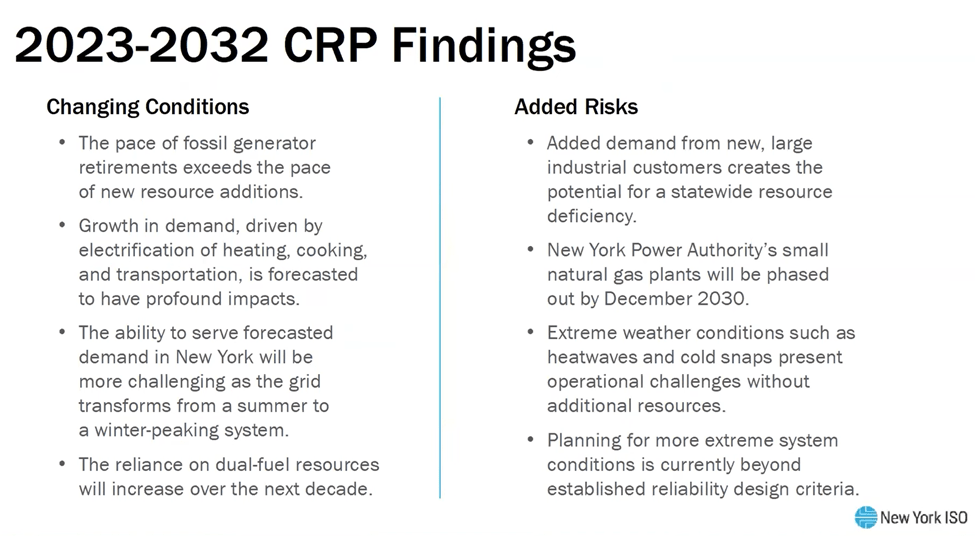
The Comprehensive Reliability Planning (CRP) report incorporates changes associated with demand growth. In the following slide NYISO describes expected changes. As mentioned previously, fossil generator retirements and growth in demand are primary expected changes to the system. Part of the load demand shift changes the peak loads from summer to winter. This is troublesome because the winter diurnal peak will occur when there is no solar. She also mentioned the dual-fuel units. Many New York generating units normally burn natural gas because it is cheaper but have the capability to switch to oil firing when natural gas is needed by residential consumers. The increased reliance on these units, which at the same time are targeted for retirement is a problem. The CRP analysis also identified added risks. The addition of the Micron chip fab plant near Syracuse will add load equivalent to the total load of Vermont and New Hampshire. The New York Power Authority operates small natural gas plants in New York City that are supposed to be phased out by December 2030 due to political pressure. Lin had to make the obligatory gesture that climate changes to extreme weather was a risk. Finally, the shift to a weather-dependent generating system means that reliability design criteria need to be revised to account for extreme weather conditions outside current planning horizons.
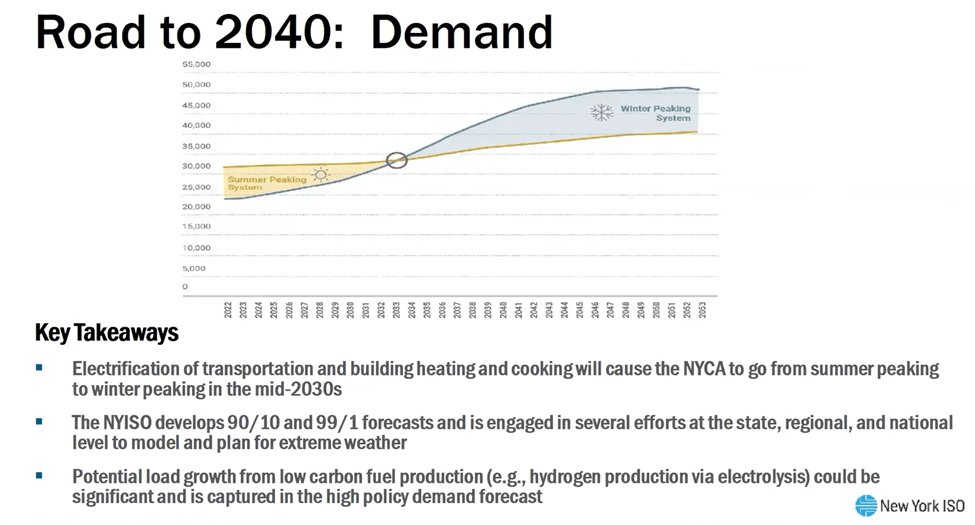
The next four slides summarize the challenges to meet the 2040 Climate Act mandate for a “zero-emissions” electric grid. The next slide repeats the points raised in the previous slide. Lin remarked that the year of the cross over from summer to winter peaking can only be guessed at this time. Depending on the trends in load it could be almost any time in the next decade. The 90/10 and 99/1 forecasts are probability estimates for the likelihood of extreme weather events. The final bullet in the slide points out that there could be substantial load growth needed to provide reliability services. The NYISO includes a high load policy case that incorporates this possibility.
The next slide lists the challenges on the generation side. Lin makes the point that generation issues extend beyond simply evaluating the capacity needed to match the load projections. Wind, solar, and energy storage are inverter-based resources that require ancillary service support to make the transmissions system reliable. Weak-grid interconnection and common mode failures are issues that most people, including me, do not understand well. The key point is that all the people that I know who understand these issues are worried but there has not been any wavering of the official political position that all is well. Consequently, the Scoping Plan outline produced by the Hochul Administration to guide the energy transition is incomplete. Lin makes the little recognized point that the Dispatchable Emissions Free Resources are not needed just for the long periods of low renewable resource availability but also to provide these ancillary services.

The next slide addresses DEFR specifically. I will not discuss this much because I covered the Department The next slide addresses DEFR specifically. I will not discuss this much because I already covered the Department of Public Service (DPS) two-day technical conference last December that focused on characterization of the potential “gap” caused by low renewable energy resource availability over long periods of time. I mentioned but did not emphasize the importance of providing the “reliability attributes of retired synchronous generation”.

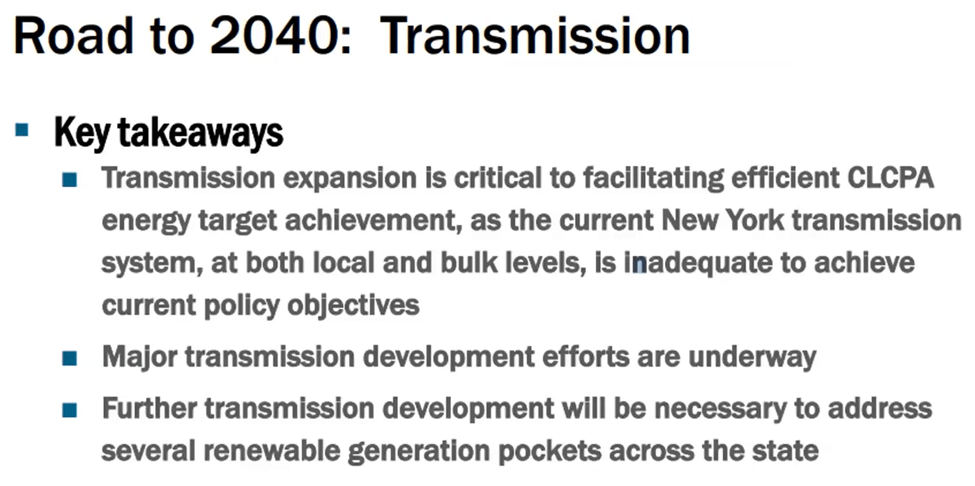
The focus of this webinar was on the transmission challenges as covered in the following slide. Lin explained that transmission expansion is required to get the diffuse wind and solar energy from where it is collected to where it is needed. The existing system is not adequate for this task.
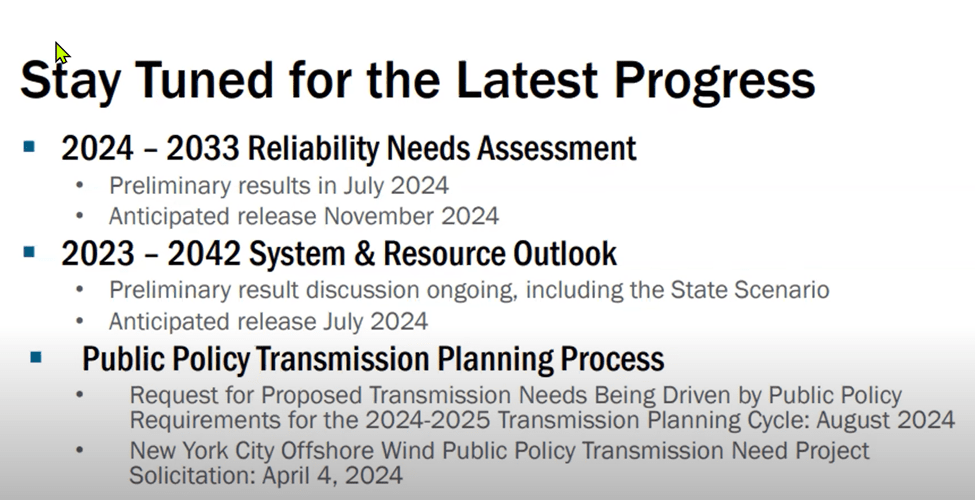
The final slide in Lin’s presentation presented the planning process expected progress. There is an enormous amount of work underway, but the analysts have a big challenge dealing with changes in the development of resources. As noted earlier, the 2026 expectation is that the Champlain Hudson Power Express project will be online. Even after years of development work the right of way is still not fully permitted and there are numerous examples of supply chain issues delaying other projects, so this may not occur. Clearly longer-term planning is subject to massive uncertainty.
National Grid Presentation Brad Franey Vice President Clean Energy Development explained how National Grid is addressing the need for transmission support. As he points out the utilities receive funding for their transmission and distribution (T&D) system investments from rate cases. Those rate cases are, in no small part, influenced by politics. As a result, New York’s utility companies are held hostage and are not going to overtly challenge the political narrative that the Climate Act objectives can be achieved on schedules mandated by the law. The following slide probably went through multiple iterations to achieve a description of plans that checks all the boxes for what the company thinks that the politicians want to hear.

In the remainder of his presentation he described specific projects that the utility is doing in its service territory. If you are interested in that information, check out my post that covers all the slides.
Questions and Answers
The question and answer portion of the webinar was interesting. The first question asked was “Is reliability a prerequisite for everything else or is it co-equal with our policy objectives?” I have heard suggestions from climate activists that policy objectives should be considered more than they are currently but anyone hoping to hear that there have been changes to protections in place to make sure that those policies don’t get ahead of reliability would have been disappointed in the answers. Elizabeth Grisaru from the DPS made it clear that reliability comes first, that there are “off ramps” for the implementation schedule, and that the PSC will not let the zeal for meeting de-carbonization goals get out in front of reliability. Yachi Lin from the NYISO emphasized the point that they are constantly evaluating reliability. The quarterly short term assessment of reliability and the longer term reliability needs assessment both address it. She admitted that we are going to have outages because the network is not built to be 100% risk-free or outage free. The alternative it “gold plating the system” which we cannot afford.
that the NYISO resource adequacy process identifies risk factors and the timelines to develop the responses. Franey explained that the building component is the fastest but still takes years. The process has to determine what is needed and where before the planning permitting, and construction plans can be developed. Only when all that is done can construction begin but there are potential delays due to procurement and supply chain issues that also must be addressed.
Discussion
My impression of the speakers at this meeting is that they were desperately trying to make the point that the transmission challenges for the Climate Act mandates and schedule were impossible goals without actually saying that. I believe that all the technical people who really understand the electric grid in the DPS, NYISO and the electric companies are being held hostage to the political narrative that “All is well”. That did not work out for Kevin Bacon in Animal House and it won’t work out here either.
The transmission challenges are different than the generation challenges. While it may not be necessary to develop and deploy a not yet commercially available technology like the generation sector to make this all work there still are inverter-based resource integration issues that need to be resolved. I have the utmost respect for the electric system engineers, but I fear that they will be hit by unanticipated combinations of conditions that they could not foresee. The result will be blackouts.
In my opinion the bigger problem is the scale of the transmission upgrades and additions needed. New York has already committed $6 billion to start “unbottling” renewable resources which is code in New York for Upstate utilities paying for support for New York City access to renewables. New York also has plans for three major bulk transmission projects to get hydroelectric power from Quebec, another to collect the energy from part of Upstate to New York City, and the third to start the process of connecting the expected 9 GW of offshore wind into the grid. Nobody has admitted to the total costs.
The other New York problem that I suspect is common elsewhere is that the politicians who enacted these net-zero laws were more concerned with the optics of aspirational timelines and not the feasibility of those schedules. A question about longer planning processes planning and deployment timing made the point that the NYISO resource adequacy process that identifies specific need for transmission development, New York’s de-regulated market process to propose, bid, and choose the development, and the project planning, permitting, and construction plans development which all need to be completed before construction can begin takes a lot of time. Reading between the lines all the speakers are highly skeptical that the artificial deadlines of the Climate Act can be achieved.
One final point not addressed in the webinar but certainly affecting the viability of New York’s energy transition goal is the decarbonization of heating and transportation. That is going to require a complete rewiring of the distribution network.
Conclusion
The magnitude, costs, and technical challenges of the generation and transmission electric grid transition ensure that that there is no question that New York will hit the Green Energy Wall. The Hochul Administration has not provided a feasibility analysis that includes the expected costs, ensures that current reliability standards can be maintained, and documents the cumulative environmental impacts of the generation resources and the transmission and distribution deployments for the electric system to meet the 2030 70% renewable energy mandate. The fact that no jurisdiction anywhere has developed a system that depends on wind and solar as in the proposed New York system suggests that a proof-of-concept demonstration is appropriate.