I previously described revisions to the Climate Leadership & Community Protection Act (Climate Act) in the New York State budget bill. I believe the budget bill addresses some of the most egregious technical and accounting problems I have criticized since 2019, but it leaves my central concerns about feasibility, affordability, and reliability largely untouched. A key shortcoming in the transition process has been non-existent consideration of input contrary to the political narrative. This post describes a provision in the budget bill for a “blue-ribbon” commission to address ratepayer affordability that I believe will continue that same approach.
I am convinced that implementation of the Climate Act net-zero mandates will do more harm than good if the future electric system relies only on wind, solar, and energy storage because of reliability and affordability risks. I have followed the Climate Act since it was first proposed, submitted comments on the Climate Act implementation plan, and have written over 650 articles about New York’s net-zero transition. The opinions expressed in this article do not reflect the position of any of my previous employers or any other organization I have been associated with, these comments are mine alone. I acknowledge the use of Perplexity AI to generate summaries and references included in this document.
Overview
The Climate Act (Climate Act or CLCPA) created the Climate Action Council and charged it with developing a Scoping Plan that recommends strategies and policies to achieve the statute’s emission-reduction and clean energy mandates. The plan was finalized in December 2022 and outlines how New York proposes to implement the Climate Act across all sectors of the economy.
Under the State Energy Law, the New York State Energy Planning Board—made up of agency heads, gubernatorial and legislative appointees, and the NYISO president—develops and adopts a comprehensive State Energy Plan every four years. The most recent plan explicitly incorporates and advances the Climate Action Council Scoping Plan’s recommendations so that they guide the State’s energy-related decision making through about 2040.
Part TT of the 2026 Budget Bill establishes another appointed group. This legislation establishes a temporary commission to be known as the blue-ribbon commission on residential affordability through energy savings, or RATES commission. The RATES commission will “study the causes and origins of rising utility rates and to recommend any actions or reforms to reduce such rates.”
Because the entire RATES commission is appointed by one party, I believe that the findings are pre-ordained to be whatever is politically convenient. At the top of that list is to claim that the Climate Act has little to do with rising utility rates.
Climate Action Council
The fundamental problem with the Climate Action Council was evident by July 2021, sixteen months after the bylaws were adopted. The statute emphasized climate‑advocacy and social‑justice perspectives over power‑system engineering, economics, or utility operations, so the Council’s recommendations reflected ideological commitments (electrify everything; rapid fossil shutdowns) rather than an honest assessment of feasibility. Decisions were made on the presumption of expertise by some Climate Action Council members who have no relevant background or experience on power-system topics. For example, regarding electric grid reliability, they went so far to state anyone who disagrees with them is a mis-informer. Paul Shepson, Dean, School of Marine and Atmospheric Sciences at Stony Brook University, stated at the 26 May 2022 Council meeting recording:
Mis-representation I see as on-going. One of you mentioned the word reliability. I think the word reliability is very intentionally presented as a way of expressing the improper idea that renewable energy will not be reliable. I don’t accept that will be the case. In fact, it cannot be the case for the CLCPA that installation of renewable energy, the conversion to renewable energy, will be unreliable. It cannot be.
Another example was Council member Rober Howarth. Howarth claims that he played a key role in the drafting of the Climate Act and his statement at the meeting where the Scoping Plan was approved claims that no new technology is needed:
I further wish to acknowledge the incredible role that Prof. Mark Jacobson of Stanford has played in moving the entire world towards a carbon-free future, including New York State. A decade ago, Jacobson, I and others laid out a specific plan for New York (Jacobson et al. 2013). In that peer-reviewed analysis, we demonstrated that our State could rapidly move away from fossil fuels and instead be fueled completely by the power of the wind, the sun, and hydro. We further demonstrated that it could be done completely with technologies available at that time (a decade ago), that it could be cost effective, that it would be hugely beneficial for public health and energy security, and that it would stimulate a large increase in well-paying jobs. I have seen nothing in the past decade that would dissuade me from pushing for the same path forward. The economic arguments have only grown stronger, the climate crisis more severe. The fundamental arguments remain the same.
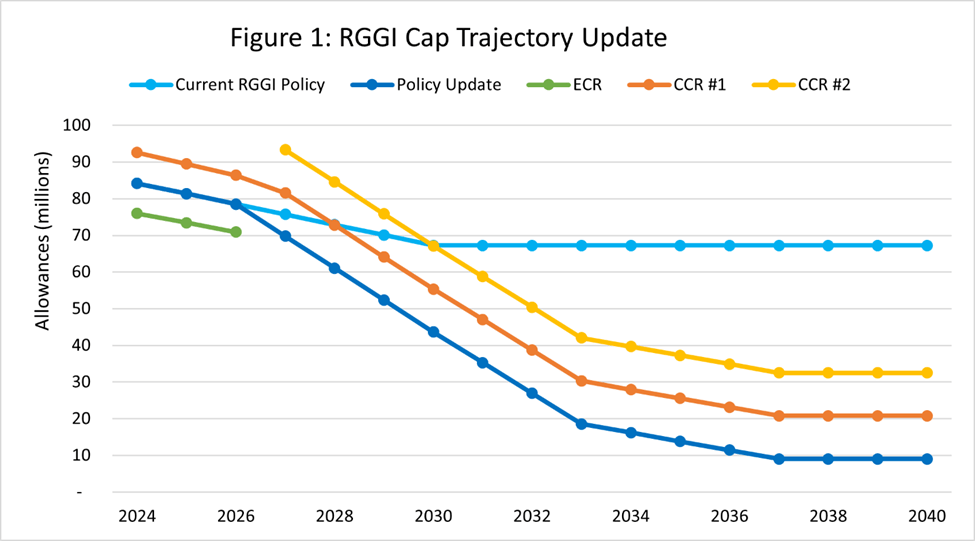
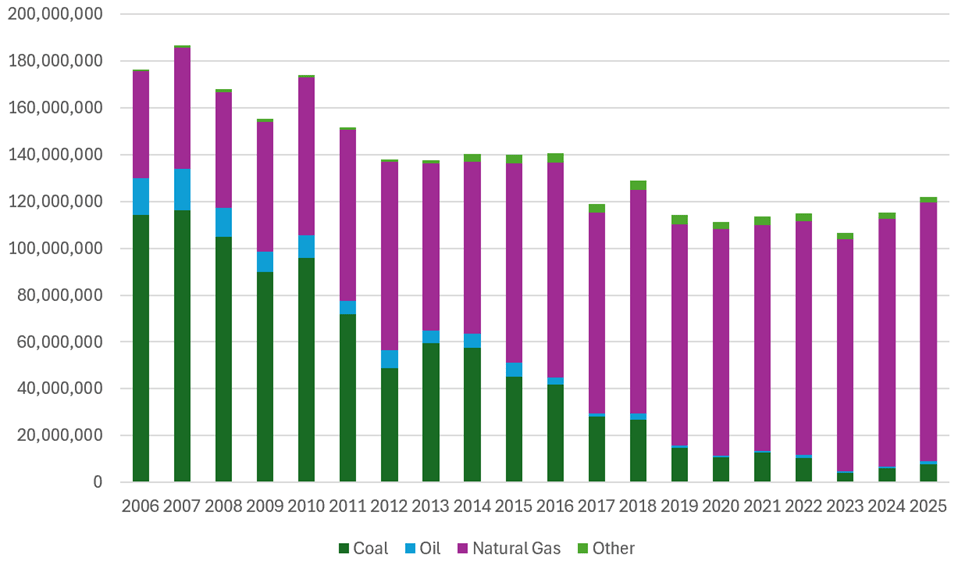
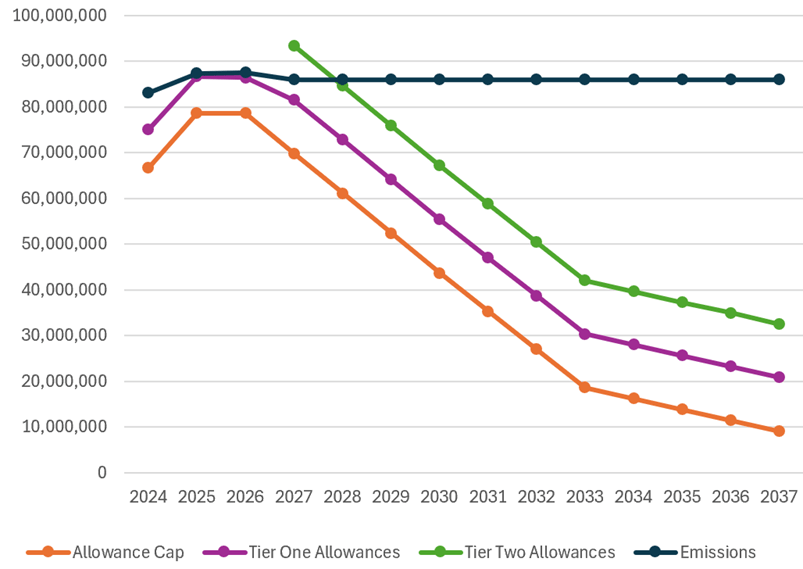
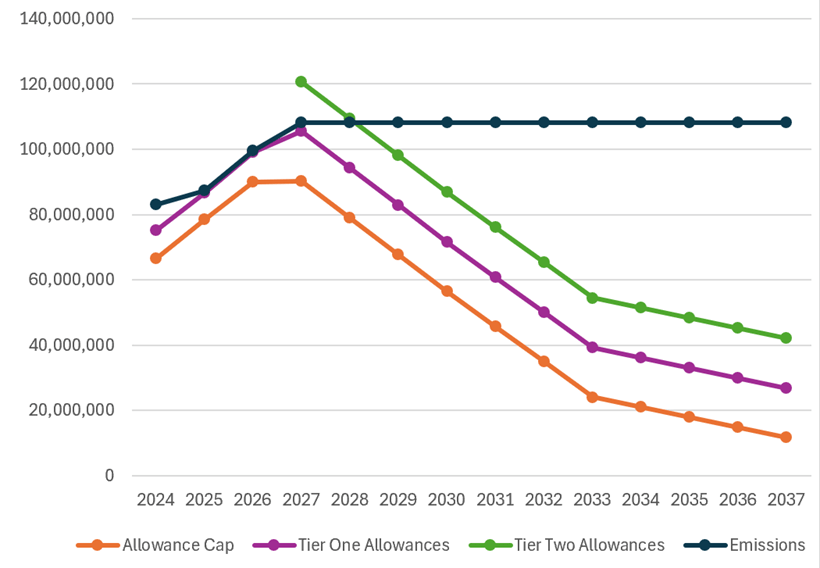
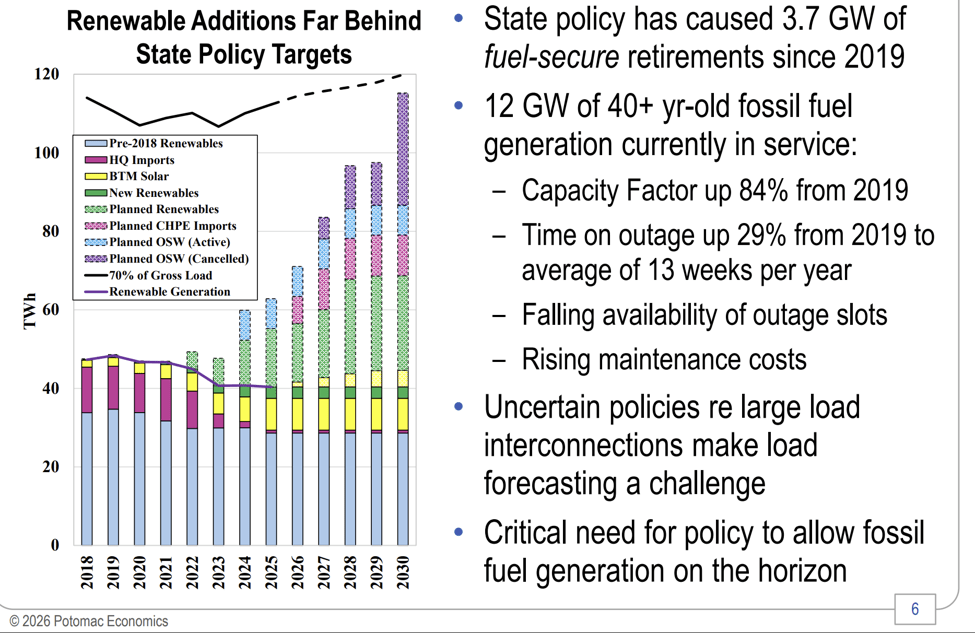
The “Highlights from the 2025 State of the Market Report for the NYISO Markets” presentation to the NYISO Management Committee by the NYISO Market Monitoring Unit, Potomac Economics on May 27, 2026 included the following slide documenting issues contradicting Howarth’s statement. The failure of the Climate Action Council to demand a feasibility study and a conditional transition plan because “the conversion to renewable energy would be reliable” has resulted in significant retirements of the resources necessary for reliability and other impacts unacknowledged by ideologues on the Council.
State Energy Planning Board
The same basic problem shows up in the State Energy Planning Board, which is supposed to be the more sober, technocratic body that translates the Climate Action Council’s ambitions into an official State Energy Plan. Under Article 6 of the State Energy Law, the Board is stacked with senior state officials: the heads of ten agencies and authorities, one appointee each from the Governor, the Assembly Speaker, and the Senate Temporary President, and the president of NYSERDA as chair. The only person at the table with direct responsibility for keeping the bulk power system operating, the presiding officer of the federally designated bulk system operator (the NYISO), is there as a non‑voting member.
On paper, the Board is supposed to balance multiple objectives. The statute says the State Energy Plan should improve reliability, protect consumers from price volatility, reduce overall energy costs, and minimize health and environmental impacts. In reality, because the voting members are drawn from the very institutions already committed to the Climate Act agenda, the Board behaves more like an internal ratification committee than an independent check. When NYSERDA announced that the State Energy Planning Board had approved the 2025 State Energy Plan, it emphasized that the Board “comprised of multiple State agency heads, appointees from the Governor, Senate, and Assembly, and the president of the New York Independent System Operator” adopted the plan unanimously and that the Plan explicitly advances the Climate Action Council’s Scoping Plan recommendations.
Notice what is missing from that description: there is no guaranteed voting seat for a consumer advocate whose job is to push back on bill impacts, no requirement for independent power‑system engineers, and no formal role for utility planners or market economists whose professional obligation is to question whether the numbers add up. The NYISO can raise concerns about reliability, but at the end of the day, the NYISO representative does not get a vote when the Board decides whether to bless a plan that folds in the Climate Action Council’s assumptions and timelines. That structure guarantees that any serious challenge to the political narrative — for example, that the pace of mandated retirements is inconsistent with maintaining reliability at reasonable cost — will be treated as a nuisance rather than a core planning issue.
In other words, the State Energy Planning Board is not a neutral referee standing above the Climate Action Council. It is an extension of the same political narrative, organized to give the appearance of comprehensive, expert‑driven state energy planning while insulating the underlying policy from meaningful technical or economic scrutiny. That helps explain why the 2025 State Energy Plan reads more like a translation of the Scoping Plan into agency task lists than a candid assessment of what is achievable without blowing up reliability and affordability.
RATES Commission
The political sales pitch for the RATES Commission is straightforward. Governor Hochul and the legislature recognize that utility bills are punishing households and are a political liability. In response they want a “blue‑ribbon” panel to get to the bottom of it. The reactions to Part TT, and the way the membership is structured, suggest what the commission is likely to do—and what it will avoid.
On the supportive side, Assembly leadership, AARP, and several majority legislators point to the RATES Commission as proof that this budget delivers “strong utility reforms,” grouping it with one‑time rebate checks and changes in how PSC and NYSERDA assessments show up on bills. Their messaging emphasizes “cracking down” on utility profits, increasing transparency, and protecting working families from “corporate greed,” not reevaluating the Climate Act. The appointment scheme reinforces that emphasis: all members are named by the Governor and legislative majorities, with designated seats for administration officials and majority‑aligned appointees, and no guaranteed voting role for an independent consumer advocate, power‑system engineer, or NYISO representative.
Business‑oriented groups are more conditional. Upstate United, for example, has framed the commission as a potential vehicle to force transparency around what is really driving costs, especially in upstate regions that have seen sharp delivery and supply increases while being told they already live in a “clean energy success story.” Their implicit challenge is that if the commission is serious about affordability, it must finally addres the full cost of CLCPA implementation, NYSERDA surcharges, and transmission and resource‑adequacy investments that flow directly from the Climate Act.
Republican legislators focus on process and composition: every voting appointment is controlled by the Governor and legislative leaders who supported the Climate Act, the Scoping Plan, and the 2025 State Energy Plan. The absence of built‑in representation for independent consumer advocates, utility planners, or market economists, and the lack of a voting role for NYISO, signals that the same political coalition that designed the transition will decide which rate drivers are fair game for criticism.
Given that context, it is not hard to predict how the RATES Commission will treat Climate Act cost drivers and NYISO reliability warnings. It is politically easier for the commission to treat Climate Act‑driven spending as non‑negotiable “public policy costs,” blame rising bills on utility behavior and generic “infrastructure needs,” and recast NYISO’s reliability warnings as implementation problems rather than evidence that the mandates themselves are out of sync with what the power system can safely deliver.
Conclusion
The most probable outcome is a final report that acknowledges bills are too high, recommends more rebates and cost‑shifting to taxpayers, proposes tougher oversight of utilities, and treats NYISO reliability concerns as justification for even more spending on renewables, storage, and transmission—not as a warning sign about the CLCPA transition. In other words, given who will sit on it and who won’t, the RATES Commission is unlikely to be the place where New York finally confronts the affordability and reliability consequences of implementing the Climate Act as written; it is more likely to become an additional layer of political insulation around a transition whose costs and technical risks remain off‑limits.