In late February the Hochul Administration “leaked” a New York Energy Research & Development Authority (NYSERDA) memo that said that “full compliance with New York’s 2019 Climate Leadership and Community Protection Act could cost upstate households more than $4,000 a year – on top of what they are already paying today and gas prices could jump over $2 a gallon.” I believe they recognized that the Climate Leadership & Community Protection Act (Climate Act) is so expensive that it would be a re-election campaign liability. Sunce then there have been many hints during budget negotiations but nothing specific in the opaque New York budget process. I got a copy of the relevant part of the budget bill and this is a summary of what is included.
I am convinced that implementation of the Climate Act net-zero mandates will do more harm than good if the future electric system relies only on wind, solar, and energy storage because of reliability and affordability risks. I have followed the Climate Act since it was first proposed, submitted comments on the Climate Act implementation plan, and have written over 600 articles about New York’s net-zero transition. The opinions expressed in this article do not reflect the position of any of my previous employers or any other organization I have been associated with, these comments are mine alone.
Overview
There are substantive issues that can no longer be ignored. Most targets are behind schedule, and the obvious increased costs of the Climate Act will exacerbate the existing energy affordability crisis. New York State Department of Environmental Conservation needs to respond to the New York Cap-and-Invest (NYCI) economy wide emission reduction initiative requirements and will have to eventually respond to the litigation saying that the State must implement the regulations or amend the law.
Budget Bill CLCPA Revisions
The Climate Act revisions are in Part VV of the TED bill.
The revisions specify specific amendments to Section 1. Subdivisions 2, 8 and 13 of section 75-0101 of the environmental conservation law, as added by chapter 106 of the laws of 2019.
- Subdivision 2 changes GHG accounting from 20GWP to 100GWP, making us comparable to everyone else. This enables us to interact with other jurisdictions seamlessly and reduces impacts of the irrational methane obsession in the 2019 Climate Act.
- Subdivision 8 changes exclude biogenic (e.g., organic matter like wood, although they don’t add a definition) emissions from our GHG limit (again matching other jurisdictions)
- Subdivision 13 eliminates out of state extraction and transportation of fossil fuels from our state GHG limit emissions accounting. It does not revise out of state emissions from generation of electric power imported to NYS as part of our inventory.
The Climate Action Council planning process is revised to modify the charge to the Climate Action Council to developing a plan “toward” rather than “for” achieving the state’s GHG limits, requires an undated Climate Action Plan in 2008, then updates every six years, rather than an update every five years (under current law, the Plan would have been updated in 2026)
There is a technical correction that requires separate reporting for biogenic emissions “consistent with” treatment by the IPCC.
One of the big changes requires DEC, by 12/31/28 to adopt regulations that “to the maximum extent feasible and cost effective” to achieve a 60% reduction in GHG by 2040, from a 1990 baseline. The current law requires a 40% reduction by 2030.
Revisions also require DEC to consider the feasibility of a cap and invest program that could be linked to other jurisdictions, including its affordability for residents, business and other entities, its impact on economic development and energy costs, and other factors.
There also is a revision that requires evaluation of the reduction measures. DEC is required to issue a report on recommended GHG reduction measures four years after the adoption of these regulations.
There are changes to the environmental justice mandates. The revisions require that climate-related state funds be spent with a goal of 40% in or for the benefit of disadvantaged communities, with a goal of 45% (up from 30% and 35%, respectively.)
Impression
The budget bill makes several important technical changes to the CLCPA that intersect directly with concerns I have raised over the last few years. First, it finally abandons the outlier 20‑year global warming potential metric and redefines “carbon dioxide equivalent” using a 100‑year time frame, bringing New York’s accounting back in line with IPCC practice and most other jurisdictions. The bill also narrows the definition of “statewide greenhouse gas emissions” by removing upstream emissions from the extraction and transmission of fossil fuels imported into the state, while continuing to count emissions associated with imported electricity. Both changes move the law modestly toward a more conventional and transparent accounting framework, which I have argued is a necessary precondition for honest discussion of New York’s role in global emissions.
The revisions also adjust several process and timing provisions without changing the underlying statutory end‑points. The deadline for DEC’s implementing regulations is pushed back to December 31, 2028, and updates to the Climate Action Council plan are now scheduled for 2028 and every six years thereafter, rather than “at least once every five years.” This effectively concedes that the original schedule was unrealistic but does not revisit the 2040 and 2050 outcome targets or introduce any formal safety valve tied to costs or reliability. In that sense, the law’s ambition is unchanged; only the official calendar has been stretched.
On the regulatory design side, the bill adds more explicit direction around issues I have frequently highlighted—affordability, leakage, economic competitiveness, and the potential role of a cap‑and‑invest program. DEC is instructed to design rules that minimize costs and maximize benefits, ensure reductions are “real, permanent, quantifiable, verifiable, and enforceable,” incorporate measures to minimize leakage, and consider options such as an economy‑wide, market‑based cap‑and‑invest system that may include linkages and cost‑containment features. However, all of this remains in the language of “considerations” and broad objectives; there are no hard affordability limits, no explicit reliability criteria, and no defined thresholds at which the state must slow down or change course if costs, leakage, or reliability impacts become unacceptable.
Finally, the bill strengthens the statutory commitment to disadvantaged communities by raising both the goal and minimum share of “overall benefits” that must accrue to those communities, from 40 to 45 percent (goal) and from 35 to 40 percent (floor) of spending on clean energy and energy efficiency programs. As with the original CLCPA, these percentages are defined in terms of “benefits,” not costs, and the bill does not resolve the practical questions of how those benefits are measured or how these distributional targets interact with least‑cost system planning.
Reliability Problem
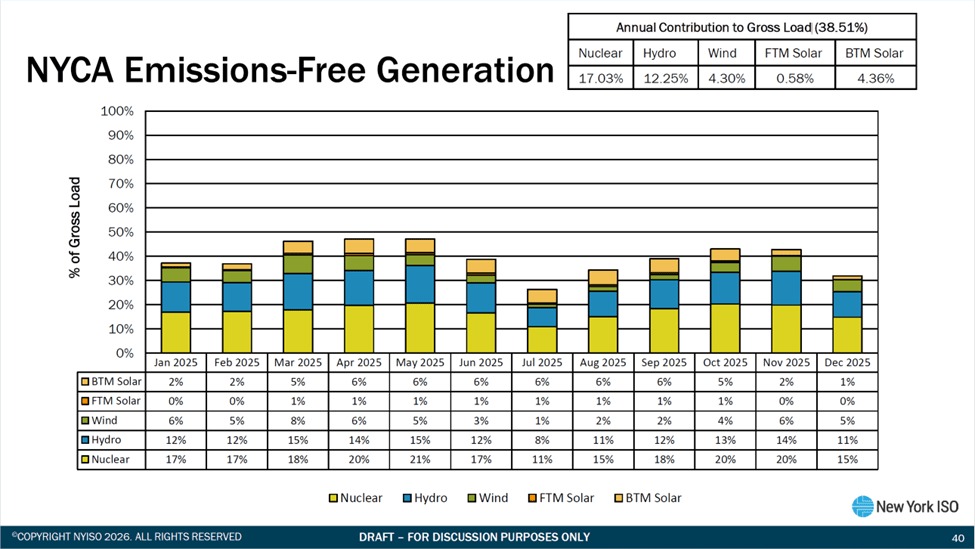
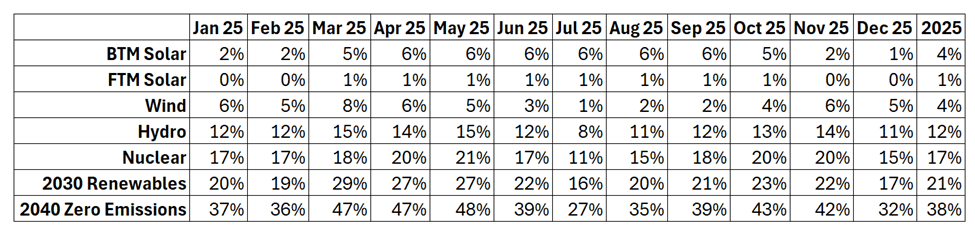
I am particularly concerned that the revisions do not address the reliability issues associated with the Renewable Energy Program. There is nothing included that addresses what happens to the emissions free generation sector by 2040. This might be a portent that this issue will be addressed by the safety valve hearing in New York Public Service Law (PSL) § 66-p. That would certainly be a political maneuver whereby they could get the necessary result but not take the blame for having to do it.
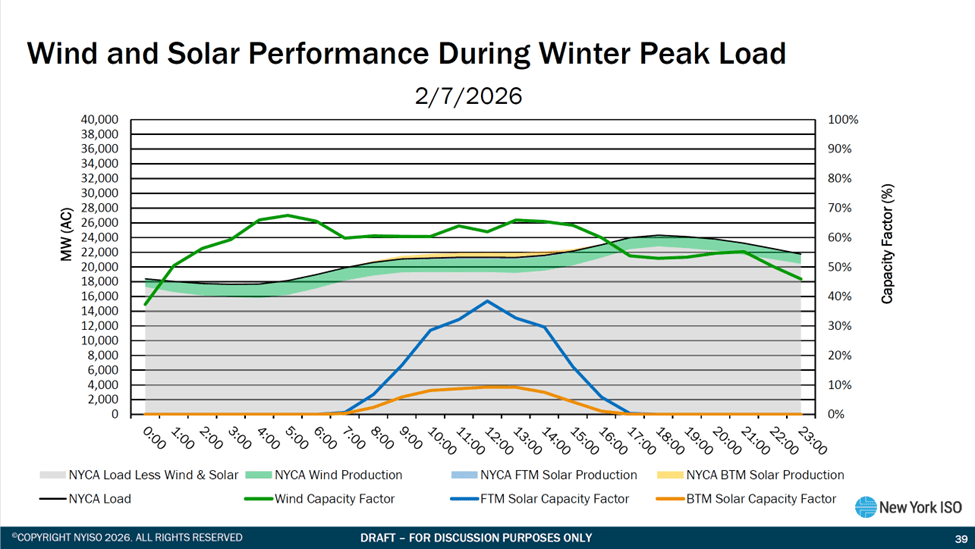
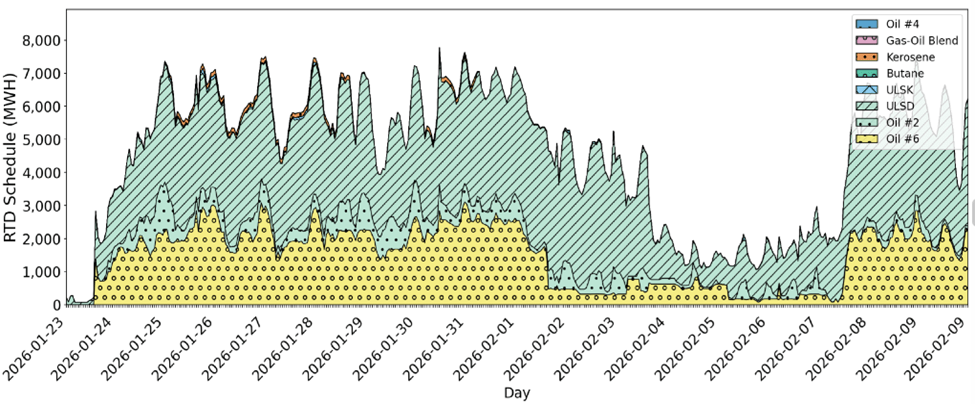
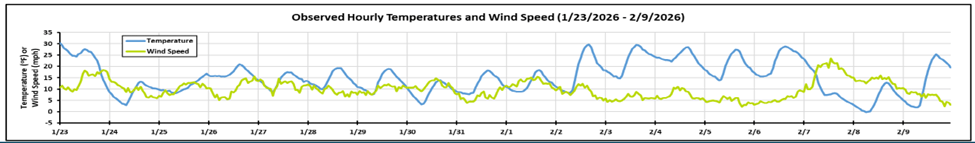
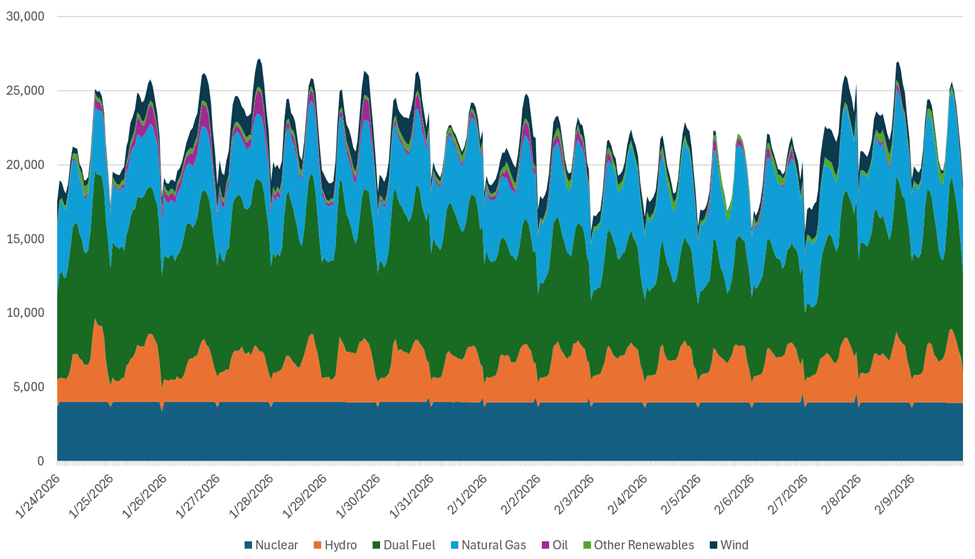
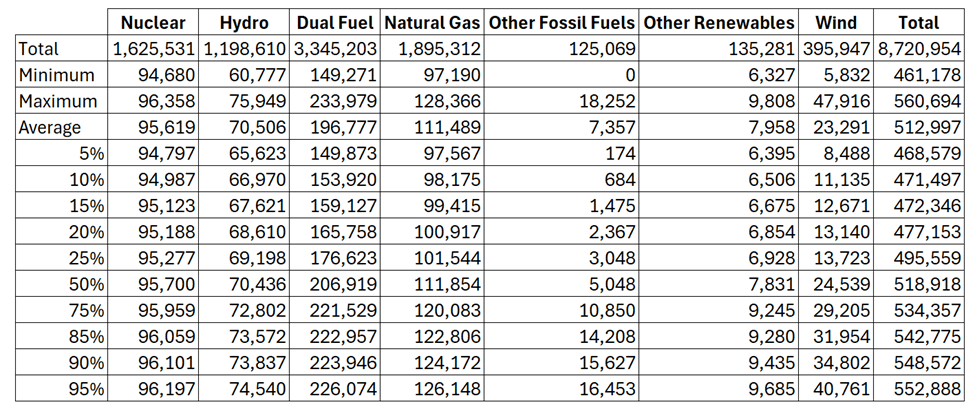
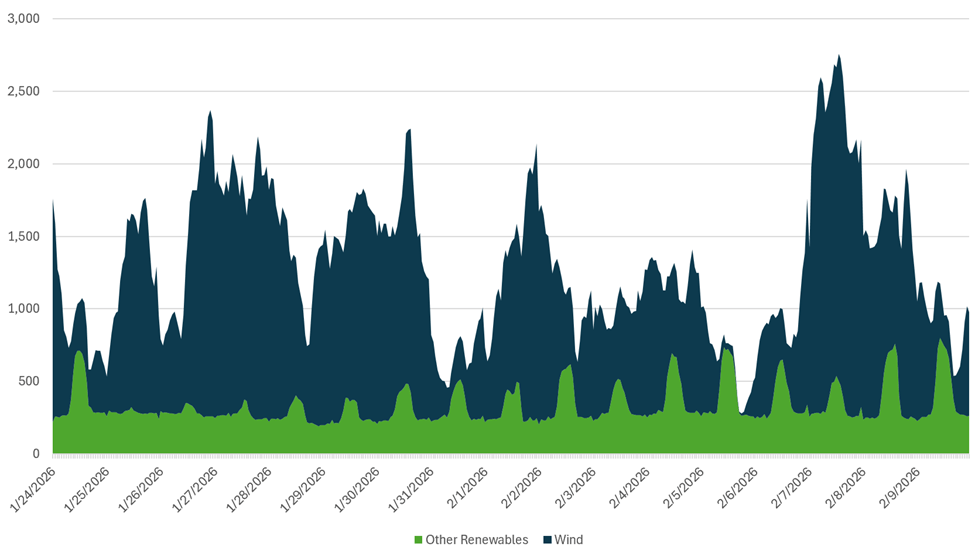
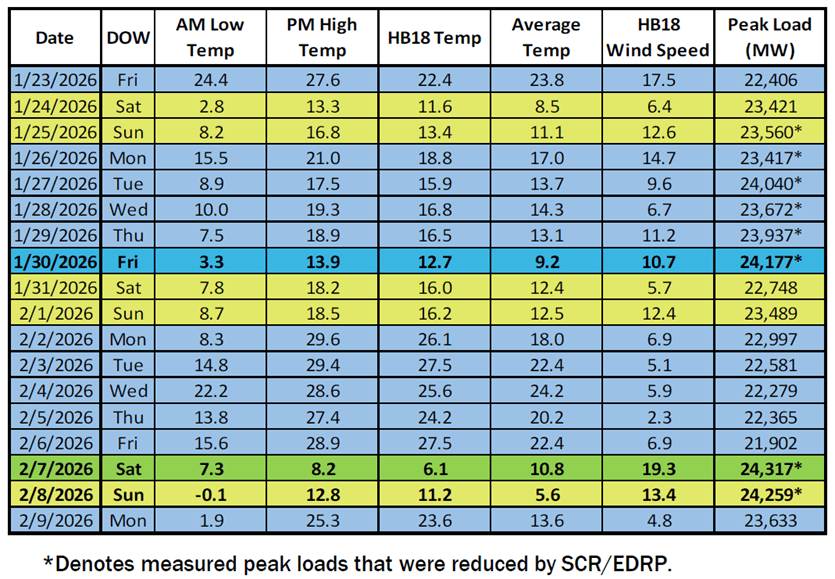
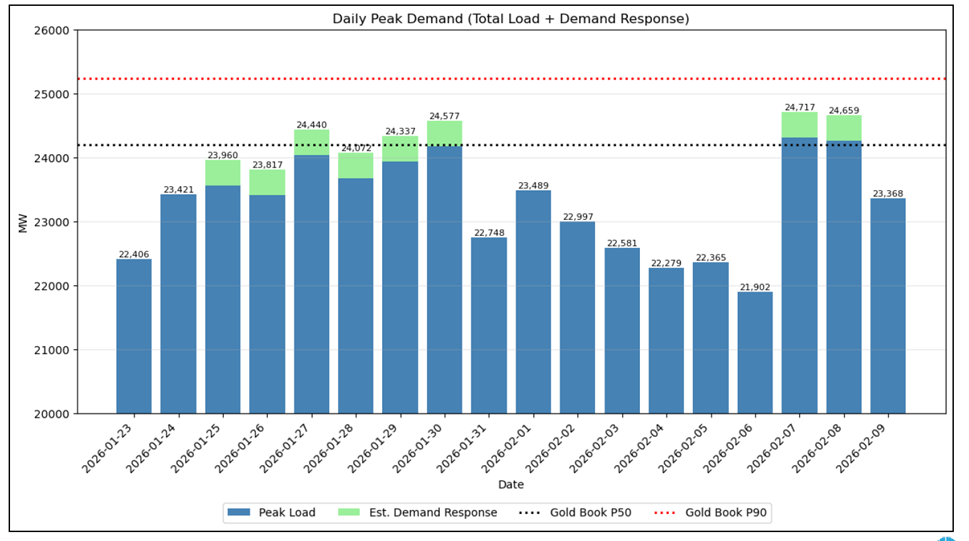
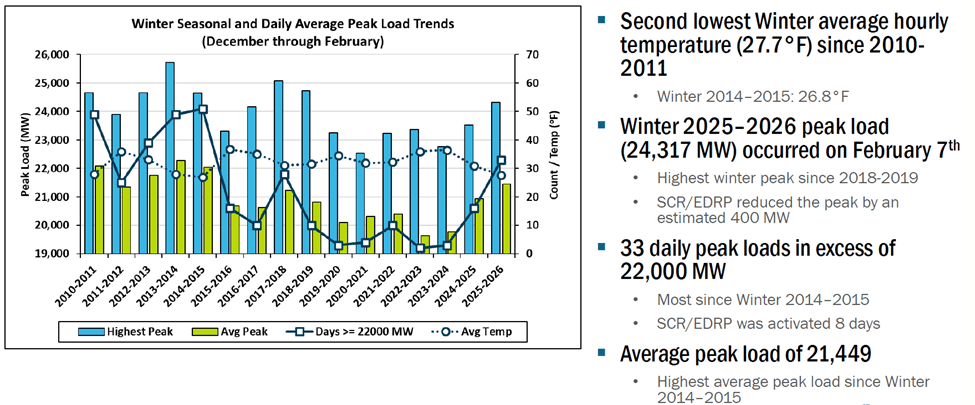
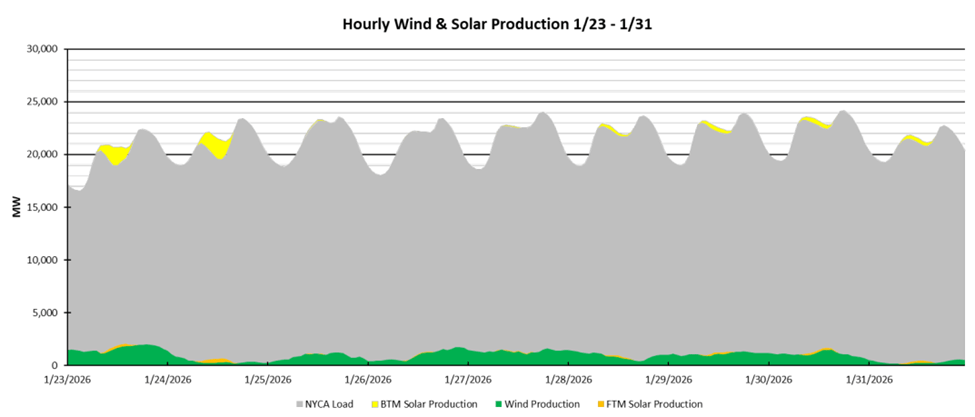
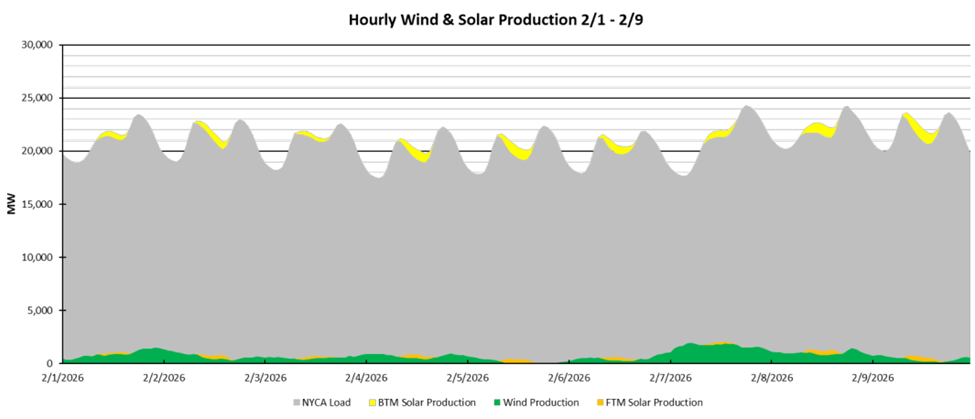
Unfortunately, this approach does not provide real solutions to the unfolding crisis. The necessary technology to transition off fossil fuel generating resources is not available to address the extreme market events experienced during last winter’s cold snap. At the same time, the existing fossil resources that ensured the lights did not go out are aging and need to be replaced. The business case for a developers to build new facilities and recover their costs with the existing timeline for zero emissions electric generation is very weak. The Governor needs to enact an interim solution that builds natural gas plants across the state until the ultimate future energy system is in place.
Conclusion
Overall, the budget bill addresses some of the most egregious technical and accounting problems I have criticized, but it leaves my central concerns about feasibility, affordability, and reliability largely untouched. Not surprisingly, the primary changes extend the deadlines for accountability beyond the election and avoids the hard decisions about the future of New York’s energy system untouched.