I have followed the Climate Leadership & Community Protection Act (Climate Act or CLCPA) since it was first proposed, submitted comments on the Climate Act implementation plan, and have written over 500 articles about New York’s net-zero transition. I believe that Governor Hochul’s Administration has forced New York utilities to incorporate programs to try to meet the goals of the Climate Act despite never proving that it is feasible and mounting evidence that implementation is not working out as planned. My frustration that no one is acting on those concerns led me to join Constantine Kontogiannis in a submittal in the Niagara Mohawk Power Corporation dba National Grid (NMPC) rate case proceeding. This post describes our statement in opposition to the Joint Proposal (JP) settlement plan.
I am convinced that implementation of the Climate Act net-zero mandates will do more harm than good if the future electric system relies only on wind, solar, and energy storage because of reliability and affordability risks. The opinions expressed in this article do not reflect the position of any of my previous employers or any other organization I have been associated with, these comments are mine alone.
Overview
The Climate Act established a New York “Net Zero” target (85% reduction in GHG emissions and 15% offset of emissions) by 2050. It includes a requirement to make the electric grid zero-emissions by 2040. The Climate Action Council (CAC) was responsible for preparing the Scoping Plan that outlined how to “achieve the State’s bold clean energy and climate agenda.” After a year-long review, the Scoping Plan was finalized at the end of 2022. Since then, the State has been trying to implement the Scoping Plan recommendations through regulations, proceedings, and legislation. The NMPC rate case is one example of these efforts.
NMPC Rate Case
This rate case has been moving slowly. On May 28, 2024, NMPC filed revised tariffs, supporting testimony, and exhibits for new rates and charges for electric and gas service to be effective July 3, 2024. The new tariffs were designed to increase electric and gas delivery revenues by approximately $525 million and $148 million, respectively. On July 22, 2024 NMPC filed corrections and updated testimony and exhibits decreasing the electric revenue requirement to approximately $509.6 million and increasing the gas revenue requirement to approximately $156.5 million.
On October 21, 2024, NMPC notified the active parties that settlement negotiations were starting. Settlement negotiations were held from October 30, 2024, to April 15, 2025. On April 25, 2025, a Joint Proposal (“JP”) that would establish a three-year rate plan running from April 1, 2025 through March 31, 2028, was filed by the following parties: NMPC; trial staff of the New York State Department of Public Service; Multiple Intervenors; Walmart; the Alliance for a Green Economy; the New York Solar Energies Industry Association; Independent Power Producers of New York, Inc. (IPPNY); the United States Department of Defense and all other Federal Executive Agencies; the New York Geothermal Energy Organization; Turning Stone Enterprises, LLC; Fedrigoni Special Papers North America; Empire National Gas Corporation; New Yorkers for Clean Power; the New York Power Authority, and the International Brotherhood of Electrical Workers Local Union No. 97.
Initial statements on the JP were due on May 14, 2025. Reply statements are due on May 23, 2025, and on June 3 there will be an Evidentiary Hearing. I cannot explain all this because I have ignored rate cases in the past.
Caiazza and Kontogiannis Initial Statement
Kontogiannis shares my frustration with the Climate Act transition plan. We are convinced that the current plan is dangerous and will lead to extraordinary price increases. We decided that submitting a statement in opposition to the JP would force a response to our concerns that have been ignored to date.
The rate request filing states that NMPC is focused on three priorities: (1) continuing to deliver safe, reliable energy service to its more than two million customers, (2) enabling customers to affordably meet their energy needs while improving NMPC’s customer service, and (3) supporting the goals of the Climate Act. Kontogiannis and I referred to the greenhouse gas (GHG) emission reduction transition plan described in the Climate Act Scoping Plan as the “CLCPA Electrification Mandate”. We defined “CLCPA Generation Plan” as the projected electric grid changes described in the Climate Act Scoping Plan that relies on wind, solar, energy storage, and Dispatchable Emissions-Free Resources (DEFR) resources to achieve the 2040 Climate Act mandate for a zero-emissions electric system.
Our primary concern is ensuring reliable, affordable, and environmentally responsible service to ratepayers while at the same time supporting the goals of the Climate Act is impossible. Simply stated, the goals of Climate Act are in direct contradiction to the statutory and regulatory obligations of NMPC and Public Service Commission.
Five arguments were included. I will highlight some of the key points in our arguments. I also need to apologize for the length of the post but providing all the background was necessary. I encourage interested readers to follow up and read the entire submittal.
Argument 1
The first argument made in our Statement is that the “JP burdens the ratepayers with additional Climate Act-related costs that sacrifice reliability for unproven sustainability benefits.” Kontogiannis described several examples of Climate Act electrification initiatives imposed on NMPC ratepayers that have created significant cost and reliability safety issues without a tangible environmental benefit.
NMPC and NYSERDA have jointly promoted building electrification using heat pumps, but without properly vetting the applicable technologies and host site suitability. Many of the installations have replaced efficient natural gas-fired equipment, with those ratepayers now subject to substantially higher heating costs that are not nearly offset by program incentives and tax credits for air source heat pumps and ground source heat pumps. Less than 15% of those ratepayers decommissioned their old heating equipment and many likely returned to using it after experiencing the higher operating costs of the heat pumps, negating most of the GHG savings claimed by the program administrators. Moreover, nearly all of the heat pumps installed through this program to date utilize a high global warming potential (GWP) refrigerant that is currently being phased out, which will likely necessitate early replacement instead of routine mid-life servicing.
There is one provision that illustrates the futility of the heat pump transition plan. The rate case includes an effort to minimize the need to repair leak prone pipelines by offering non-pipeline alternatives. This program includes heat pump incentives for disadvantaged communities with the intention to eliminate the gas service rather than repair it. After all, this will eventually be required anyway, so the reasoning goes. However, the JP admits that the heat pump conversion will not save money because their proposed solution is to offer a monthly credit after installation. The payoff is only for five years, does not cover all the conversion and operating costs of the conversion, will likely not be available for everyone who needs it, and will increase costs for everyone else.
Argument 2
The second argument says that the JP does not acknowledge New York Public Service Law § 66-p (4). In no small part this triggered my desire to submit a statement in opposition to the JP because I have been arguing for years that New York Public Service Law § 66-p (4). “Establishment of a renewable energy program” includes safety valve conditions for affordability and reliability that must be addressed. The provision states: “The commission may temporarily suspend or modify the obligations under such program provided that the commission, after conducting a hearing as provided in section twenty of this chapter”, makes a finding that the program impedes the provision of:
- safe and adequate electric service;
- the program is likely to impair existing obligations and agreements; and/or
- that there is a significant increase in arrears or service disconnections that the commission determines is related to the program”.
This argument was included to force the PSC to acknowledge that the safety valves must be addressed. The submittal included an attachment that was summed up my analysis that showed that the number of people in arrears has significantly increased since the state of the Climate Act. Our statement argued that it is inappropriate to invest in Climate Act programs until the PSC defines the criteria for the Section 66-p(4) safety valves, institutes a tracking system, and determines if the Climate Act implementation should be suspended or modified.
Argument 3
The third argument is that dispatchable emissions free resources (DEFR) must be resolved to ensure safe and adequate supply. Until this issue is resolved it is imprudent to invest in any support of the Climate Act Generation Plan. An attachment was included based on my many articles on DEFR. The attachment documents the need for DEFR, explains the requirements for this new resource, describes potential options, and notes the challenges associated with specifying how much capacity and energy will be needed to prevent a reliability crisis.
The JP does not adequately address the fact that a new category of Dispatchable Emissions-Free Resources (DEFR) must be identified, tested, and deployed to provide energy during extended periods of low wind and solar resource availability. There is a very real chance that nothing will be feasible. Furthermore, because the DEFR technologies have not been identified it is impossible to determine if they are affordable.
In our opinion, the most promising DEFR backup technology is nuclear generation because it is the only candidate resource that is technologically ready, can be expanded as needed and does not suffer from limitations of the Second Law of Thermodynamics. If the only viable DEFR solution is nuclear, then renewables cannot be implemented without it. But nuclear works best as a baseline resource rather than as backup so nuclear power can replace renewables, eliminating the need for a massive DEFR backup resource. Therefore, all the JP investments included to support renewable energy development are imprudent because nuclear generation may be the only viable path to zero emissions making all those investments worthless.
Argument 4
The fourth argument pointed out that the JP does not properly consider alternatives to the Climate Act Generation Plan that provide similar environmental benefits without the reliability risks of dependency upon intermittent and diffuse renewable energy. To maintain adequate system reliability, the CLCPA Generation Plan must include substantial overbuilding of renewable sources, energy storage, and equipment for ancillary grid support. The JP does not address the fact that the Climate Act fails to consider other options that would largely satisfy its sustainability target without as many ratepayer reliability and affordability risks.
Kontogiannis and I agree with Richard Ellenbogen’s pragmatic approach described at the March 18, 2025 NYS Senate Energy and Telecommunications Committee meeting. We all believe that substantial interim reductions can be achieved simply by deploying natural gas fired combined cycle gas turbines (CCGT). For large sources of new load, a CCGT power plant requires no additional ancillary service support infrastructure, can provide process heat, and when coupled with an agricultural park, can further lower CO2 emissions by using the CO2 to boost plant productivity. CCGTs will last longer than any wind, solar, or energy storage infrastructure, can be used for peaking support when a better long term zero emissions technology is developed and deployed, and converted to burn hydrogen if necessary. Moreover, if it becomes economical to produce and store hydrogen this approach eliminates the need to develop ways to transport it because it can be stored and used in one location.
Unfortunately, this rational approach is not lawful at this time. However, the approach is emerging as a preferred low carbon solution in other areas of the U.S. and abroad. The significant tradeoffs of the CLCPA Generation Plan must be reevaluated by NMPC and the Public Service Commission as part and parcel of the JP to ensure protection of the ratepayers.
Argument 5
The fifth argument addressed the electric system planning risks that are inherent in the transition to weather-dependent generating resources. The DEFR argument mentioned the difficulties associated with figuring out how much DEFR will be required because the assessment must account for weather variability. This argument and the associated attachment explained all the challenges of defining the frequency, duration and intensity of low wind and solar resource availability events. Two reliability metrics were evaluated with respect to weather variability. The argument concluded that the associated uncertainties may not be reconcilable.
The presumption in the JP that the CLCPA Generation Plan will be safe does not stand up to scrutiny. Grid planners recognize that unanticipated adverse events—such as line outages, generator trips, substation failures, and major faults—will continue to impact power grids. Their challenge is to ensure the grid is robust enough to withstand and recover from such disturbances without major consequences. Kontogiannis and I believe that it is unrealistic to expect that the grid planners will be able to anticipate all the additional adverse events that will occur when the electric system depends on weather-reliant resources. It would be prudent to pause the Climate Act projects within the JP until grid planning improves.
Conclusion
Kontogiannis and I submitted the Statement of Opposition because of our concern that, with its disproportionate efforts to support the goals of the Climate Act, the JP does not properly balance NMPC and Public Service Commission responsibilities to ensure reliable, affordable, and environmentally responsible energy generation and delivery to ratepayers.
With so many legacy hydroelectric and nuclear assets, by all accounts New York State should have some of cleanest, most reliable, and affordable energy in the United States – but we are failing on all counts. Special interests have effectively hijacked what should be a relatively straightforward exercise of prudent engineering – shuttering a critical nuclear asset, denying legacy fossil fuel powerplants permission to repower as CCGT generators, and forsaking cost-effective and fuel-neutral building and transportation energy efficiency initiatives – all for the well-intentioned but sorely misguided fantasies of climate scientists in academia and policy advocates who have no idea of the complexities involved in the safe and reliable production and delivery of arguably the most essential commodity for the modern world. As if the failure isn’t complete, the stated sustainability targets are nothing more than smoke and mirrors – an honest accounting of the lifecycle carbon impacts shows no improvement compared to what solid engineering and standard industry practice afford.
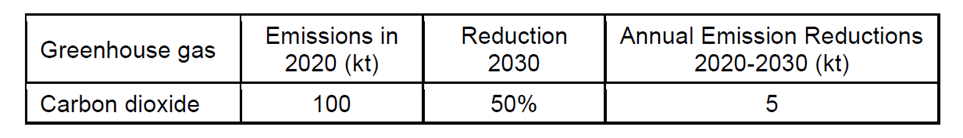
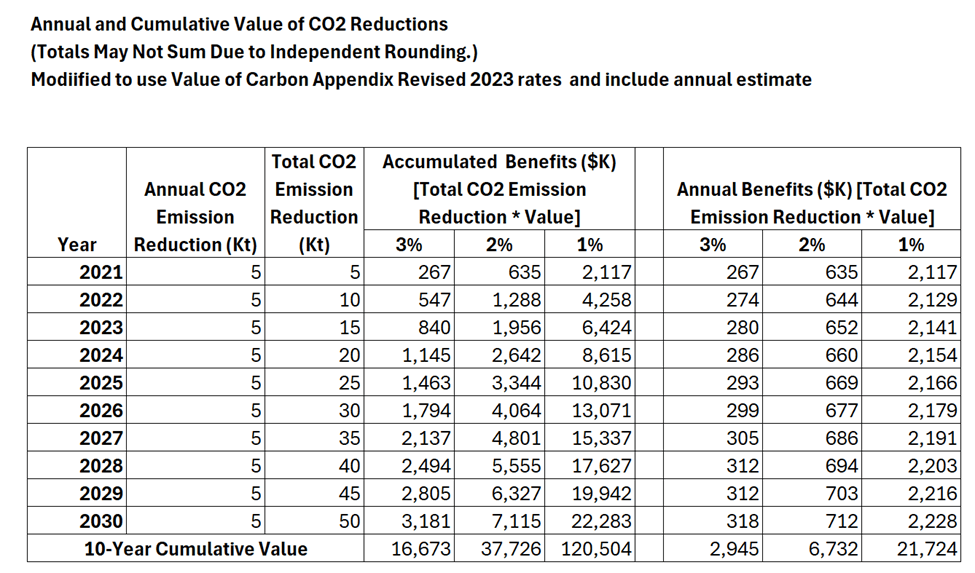
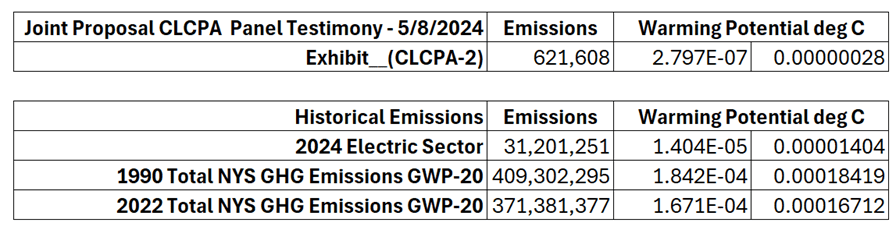
Even if the Climate Act was to fully achieve its sustainability objectives, the effect on global emissions is negligible and the resulting global temperature change is infinitesimally small. If New York were able to eliminate all its GHG emissions, the effect of global emission increases elsewhere would supplant our efforts in one year. New York GHG emissions are less than one half of one percent of global emissions and global emissions have been increasing on average by more than one half of one percent per year since 1990. Furthermore, New York’s impact on global warming is unmeasurable. A Perplexity AI query “What is the expected change in global warming per ton of CO2 reduced” found that “Current estimates suggest that reducing 1 gigaton (1 billion tons) of CO₂ emissions prevents approximately 0.00045°C of warming”. That conversion was applied to the expected NMPC GHG emission reductions expected in Exhibit CLCPA-2 included in NMPC’s Climate Act Panel testimony on May 8, 2024 as well as historical emissions (Table 1). Emissions attributable to the Climate Act and historical emissions predict no measurable changes in global warming.
Table 1: Potential Warming Savings for JP Emission Reductions and Historical Emissions
NMPC’s NY Climate Resiliency Plan website states that: ”National Grid is committed to urgent action to address climate change as we’ve outlined in our vision for a fossil free future, but we all must recognize that climate change is no longer a future threat, but a current threat based on the extreme climate hazards we are witnessing today.” Kontogiannis and I believe that the crisis facing NMPC customers is not from the changing climate, but rather the irrevocably flawed climate policy. Kontogiannis and I concluded that a properly conceived statewide energy plan can achieve essentially the same sustainability target at a much lower cost to ratepayers and with no diminishment of system reliability.