

Richard Ellenbogen frequently copies me on emails that address various issues associated with New York’s Climate Act. I asked his permission to present his analysis of the New York State Energy Storage Roadmap Report as a blog post here.
I believe that he truly cares about the environment and the environmental performance record of his business shows that he is walking the walk. Ellenbogen is the President of Allied Converters that manufactures food packaging. His facility is about 55,000 square feet and does a lot of manufacturing with heat to seal the bags, all electrically driven. The facility has solar panels and uses co-generation. He explains:
In 2008, the average energy cost per square foot for a commercial facility in Westchester was $1.80. We were at 16% of that 12 years later and even with the increases, we are at 62% of that 14 years later. That has been done while having a carbon footprint 30% – 40% lower than the utility system. The $1.80 per foot also included commercial office space and our operation is far more energy intensive than an office. We use energy extremely efficiently and as a result, our bills are much lower than everyone else.
NY State Energy Storage Report
On December 28, 2022 the New York Department of Public Service and New York State Energy Research and Development Authority released New York’s 6 GW Energy Storage Roadmap: Policy Options for Continued Growth in Energy Storage (Roadmap Report). I did a couple of posts (here and here) on the Roadmap Report that concentrated on the costs. Ellenbogen’s analysis fills in another part of the story. His lightly edited description of the feasibility follows.
This is another document of such questionable quality that had I presented it to my superiors when I worked for Bell Labs and asked them to implement a multi-billion dollar project based upon it, they first would have rolled on the floor laughing thinking it was a joke, and then when they realized that I was serious, they would have promptly terminated me. No sane entity would embark on a project based upon such questionable parameters as are shown in this document. This is not science or engineering. This is politics disguised under a veneer of technical terms designed to delude the public that won’t take the time to read its 104 pages. The fact that this policy is being pursued based upon documents such as this is borderline criminal (And maybe not so borderline. Just plain criminal).
Note that the page numbers I list are the pages of the pdf and not the document page numbers to enable easy searching of the document using Acrobat.
We can start with the fantasy on page 31 in Figure 5 (Also duplicated in the analysis in Appendix A) that immediately makes the entire document questionable. It has all of the storage being charged by renewable energy by 2040 which will be impossible based upon NY State’s rate of renewable installation and the rate at which loads are being mandated to be added to the system. (See below. There is no fossil fuel generation even listed and it doesn’t list the composition of the “Imports”. If they are like California’s imports, they will be coal generation. Very environmentally friendly.) Germany has been doing this for 32 years and has reached a 34% carbon free system with very few EV’s on the road. While NY State is starting at 41% carbon free because of Niagara Falls and its upstate nuclear plants, the new renewables are not even going to offset the added load that has been mandated by state policy starting in 2024 and going into overdrive in 2030 and 2035 for EV’s and Heat Pumps, let alone replace all of the fossil fuel generation. 2040 is only 17 years away. By 2050, the upstate nuclear plants will be 75 years old and nearing the end of their useful lifespan. What will replace them?
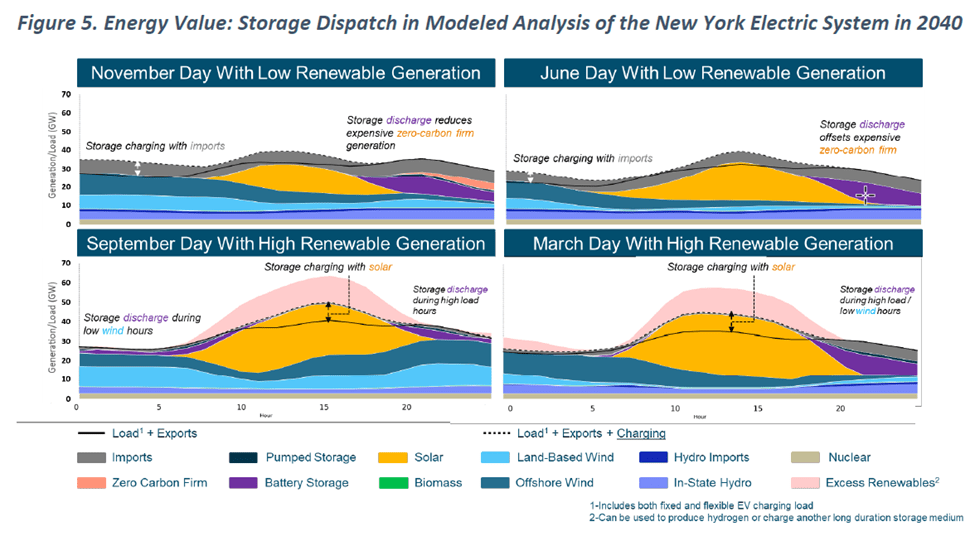
Also, why are they using shoulder months in the analysis? What will happen in July, August, January, and February when the electric load peaks? That is what has to be analyzed as that is the worst-case scenario and is when the system will be most likely to fail. The most likely reason for that is that the numbers and graphs looked so bad for those months, even in fantasy land, that they couldn’t be displayed for what they would show.
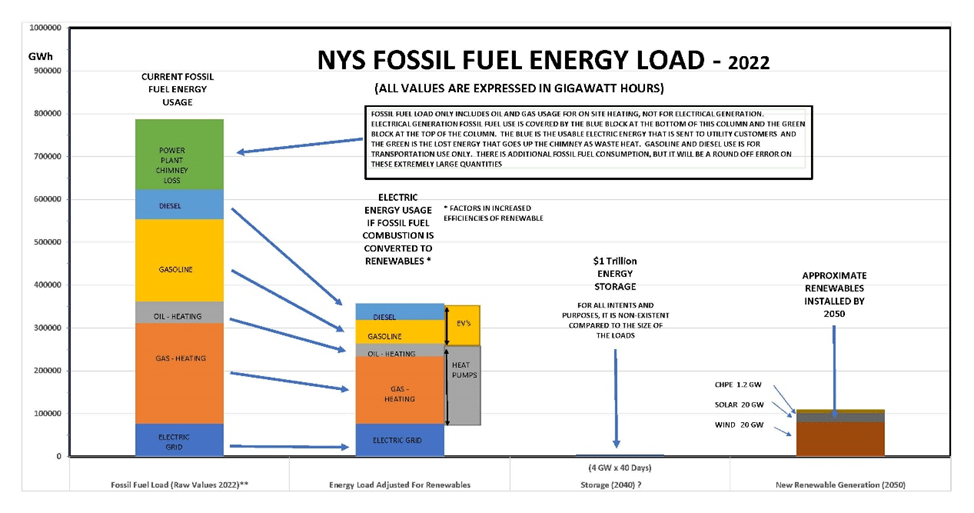
If you look at the following graph (link), the right-hand column documents the new renewables that will be available to offset the loads that they will be adding and it is clearly insufficient even if only 30% of the vehicle fleet is electrified and 10% of the buildings.
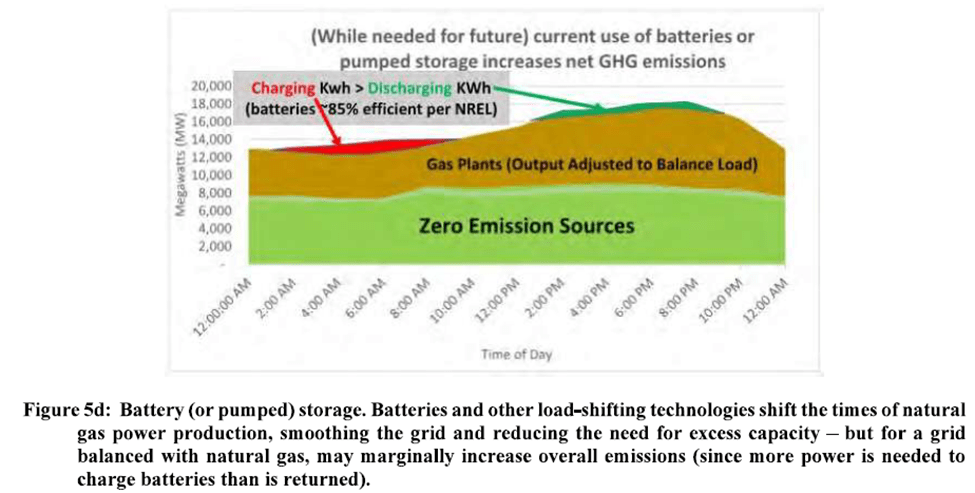
Instead of Figure 5, the reality will be closer to Figure 5d below, produced by Cornell University and the National Renewable Energy Laboratory, which show the batteries being charged from fossil fuels and 15% to 20% of that energy being lost because of charge/discharge losses, which is actually going to increase NY State’s carbon footprint. The storage losses are acknowledged in the Roadmap Reprt document on page 99 where it says that the battery owner will have to buy 1.15 MWh in order to sell 1.0 MWH, implying a 15% energy loss.

If that isn’t bad enough, on page 89 the Energy Roadmpa says,
Customer load shifting can provide many of the same flexibility attributes as battery storage, by enabling reductions in peak demand, and shifting demand to times of high renewable output. As a result, there are direct impacts of lower or higher amounts of end use flexibility on the economics of battery storage. In the base case, 12.5% of the light duty EV charging load is assumed to be flexible by 2030, increasing to 25% by 2050. In addition, 50% of the hydrogen required economy-wide is assumed to be generated via electrolysis within New York, and this electrolysis load is assumed to be highly flexible as well to make the most of excess renewable energy when it exists.
As clearly documented, WHAT EXCESS? What are these people looking at? THIS DOCUMENT IS NOT BASED UPON REALITY!!!
Further, Hydrogen electrolysis loses 20% of the energy when Hydrogen is generated from the water and then about 60% of what is remaining is lost during combustion for a total energy loss approaching 70%. That’s not a great tradeoff when you don’t have enough energy to start with.
For some reason the filed report on the NYS DPS DMM site for Case 18-E-0130 – In the Matter of Energy Storage Deployment Program includes a cover letter. That letter lists the storage capacity as a power value and not as an energy value. The title of the cover letter is “Re: Case 18-E-0130 – In the Matter of Energy Storage Deployment Program” and then at the top of the next page the cover page of the document says New York’s 6 GW Energy Storage Roadmap: Policy Options for Continued Growth in Energy Storage however, Gigawatts (GW) are Power, not Energy. While some may think that this is nitpicking, it isn’t. Engineering students can fail tests over incorrect units. All of the energy storage targets are listed as power, not energy. The system runs on energy and with an intermittent renewable driven system, the storage duration is critical. Nowhere will anyone be able to determine how long the storage will support the system except on page 15 and those figures should be included with the question, “Are you kidding me?” next to it. The explanation is below.
In fact, if anyone searches the entire pdf for “WH” to find all of the references to energy that are contained in it (Gigawatt Hours – GWh, Megawatt Hours – MWh, and Kilowatt Hours – KWh) the vast majority are devoted to information about rebates and costs and not what will be available to run the system. Most of what was found were “What”, “Why”, “Which”, but very little about system capacity except in a couple of places. On page 15 the Energy Roadmap discusses the cancellation of 20% of the battery projects:
While the program initially procured 580 MW and 1,654 MWh of energy storage, cancellations have brought these numbers down to 480 MW and 1,314 MWh.
Keep in mind that the pre-cancellation figure of 1654 MWh of battery storage with a 580 MW Power Capacity is less than THREE hours of storage for the bargain price of $193 million in state incentives. During a heat wave, peaker plants can run for days. On page 25 of the pdf, it states that many of the peakers only run 5% to 10% of the year, which equates to 440 – 880 hours annually, however much of that time is contiguous during periods of high load and is far longer than 3 hours so how can a 3 Hour battery keep the system running if replacing a peaker plant?
On page 27, the Energy Roadmap discusses the possibility of using EV’s to offset a shortage of storage. You can tell that whoever wrote this lives in Albany and not downstate where a large number of people live in apartments. Vehicles parked on streets are not going to be able to discharge to support the system in times of need. Are they planning on putting a bidirectional charger on every parking spot in every downstate garage and on every parking spot on the street? What will that cost and who will install it? In New Rochelle, it took several months to install about ten internet kiosks with multiple street cuts to house data cables. How long will it take to install thousands of chargers supported by far larger megawatt power cables to enable vehicle charging? Also, having driven a Tesla for nearly six years now, I can safely say that trying to run a domicile for any extended period with the car’s battery and still having energy remaining to commute are mutually exclusive. Again, times of peak load can run for days during the summer. Winter peak load durationss will be similar in NY State during future winters when large numbers of heat pumps are installed.
On page 40 of the pdf, under 4.3 “Barriers To Energy Storage”, it says:
As highlighted in other sections of this Roadmap, one of the most critical barriers to energy storage projects relates to the uncertain and insufficient nature of the revenue available through existing markets and tariffs, particularly capacity revenue. Retail or distribution-level projects, participating in certain regions through VDER, provide investors with a more certain revenue stream; however, these projects are still difficult to underwrite given the variable nature of both capacity and energy prices.
On page 9, it says:
Over the past year, supply chain constraints, material price increases, and increased competition for battery cells have driven up the cost of energy storage technologies, particularly lithium-ion batteries. Many of the drivers of cost increases are expected to persist until at least 2025. These cost increases may impact the cost of any new programs designed to procure storage to be installed by 2030.
How they can predict the cost of commodities out past five years is beyond me, but it is safe to say that with everyone trying to install storage and at least nine states mandating electric vehicles, the demand is only going to make the price of storage go up and the materials will be scarce. That doesn’t require a Crystal Ball, only a small degree of common sense.
The document states that the residential incentive is $ 250/KWh as seen on page 17, however if you look on page 37 it says:
Since July 2021, prices for lithium carbonate, a key ingredient of lithium-ion batteries, have increased 500%. Among projects awarded NYSERDA incentives, average total installed costs for non-residential, retail projects averaged $567/kWh for installations occurring in 2022 and 2023, up from $464/kWh for installations in 2020 and 2021, an over 20% increase in total costs. This is consistent with recent industry reports that indicate near-term increases in storage costs.
That cost increase helps to explain the battery project cancellations.
Then on page 104, it says “Stakeholders across all segments that were surveyed or engaged with brought up increases in lithium-ion battery pricing over the course of 2021 and 2022 as a fundamental challenge to deploying storage and the development of the storage market going forward.”
On page 94 it does imply that 1000 hours of storage will be needed. “With seasonal storage (1000+ hours), the availability of a specific resource during critical weeks – or in between multiple critical weeks in a season matters less; instead, the cheapest form of energy”
Coincidentally, that is almost the same time frame (40 days) that I showed on the graph above that was created about 5 weeks ago. However, at the current average national cost of utility grade storage of $283 per KWh, 4 GW of storage that will last for 960 hours will cost over $1 TRILLION. The 6 GW will cost over $1.5 TRILLION. But with the escalating costs of Lithium, that figure could easily reach $ 3 TRILLION. That figure is fourteen times the entire NY State budget for 2023. The Inflation Reduction Act had $387 billion allocated for renewable energy projects for the entire United States. That will just be the cost of the storage, independent of the cost of the renewable generation needed to charge it.
Conclusion
So basically what they are saying is, “We aren’t sure how the economics of this is going to work but we are going to mandate its installation in lieu of fossil fuel plants, with an unknown price structure, increased energy losses when there already isn’t enough energy to support the system, insufficient capacity to replace the peaker plants that we are trying to close, rapidly escalating costs for the battery storage that already is not affordable and are only going to get more expensive in the future, and cross our fingers that this won’t make it impossible to complete the installation of 6 GW of energy storage. However, in the interim, we will have shuttered the energy plants that we have for ones that we can’t afford to install.”
They are pushing forward with it anyway when it is doomed to fail. This goes way beyond money. The inevitable failure is going to cost lives and they don’t even seem to care. I was able to produce this analysis in hours. They’ve had years to ponder these issues. This is insanity and again, it is borderline criminal.
If they gave a damn, they would say, “Wait a minute. This isn’t going to work. We’re going to kill a bunch of people. Maybe we should rethink this.” Unfortunately, they aren’t doing that.
Caiazza Closing Thoughts
New York State’s GHG emissions are less than one half a percent of global emissions. Global GHG emissions have been increasing on average by more than one half a percent per year since 1990. That does not mean that we should not do something but it surely calls into question why these limitations of the proposed plans are being ignored. There is time to make sure the net-zero transition does not do more harm than good. I fully agree with Ellenbogen’s frustration that fundamental feasibility questions are not being addressed and his conclusion that this is insanity.

How do we know that an insane energy policy is not also evil. The meaning of Hannah Arendts banality of evil is so widely debated that I might as well employ it in describing a plan developed by bureaucrats that will inevitably do great harm, regardless of intent.
Last week I had the chance to speak with a CAC member about social and environmental damage to front line communities hosting wind/solar facilities. Behind her sympathetic brown eyes I sensed the cold calculations of a committed revolutionary.
Sent from Mailhttps://go.microsoft.com/fwlink/?LinkId=550986 for Windows
LikeLiked by 1 person
Law on unintended consequences comes to mind.
LikeLiked by 1 person