The Climate Leadership and Community Protection Act (Climate Act) codifies a New York approach to achieving net-zero emissions by 2050. The October 14, 2021 Climate Action Council meeting briefly discussed the Scoping Plan that will “achieve the State’s bold clean energy and climate agenda”. This post describes the organization of the initial draft of the scoping plan as presented at the October 14 Climate Action Council meeting.
I have written extensively on implementation of the Climate Act because I believe the solutions proposed will adversely affect reliability and affordability, will have worse impacts on the environment than the purported effects of climate change, and cannot measurably affect global warming when implemented. The opinions expressed in this post do not reflect the position of any of my previous employers or any other company I have been associated with, these comments are mine alone.
Climate Act Implementation
The Climate Action Council is responsible for preparing the Scoping Plan that will “achieve the State’s bold clean energy and climate agenda”. Starting in the fall of 2020 seven advisory panels developed recommended strategies to meet the targets that were presented to the Climate Action Council in the spring of 2021. Both the Council and the advisory panels are composed of political appointees chosen more for their direct involvement in the energy and climate agenda than their expertise in the energy sector so the strategies proposed were more aspirational than practical.
Developing a plan to transform the energy sector of the State of New York is an enormous challenge so the New York State Energy Research and Development Authority (NYSERDA) and its consultants are providing technical support to translate the recommended strategies into specific policy options in an integration analysis. An overview of the results of this integration analysis were presented to the Climate Action Council at the two October meetings and has since been updated. In mid-November documentation consisting of slide decks and spreadsheets was made available for the analysis but the lack of supporting descriptions makes interpretation of the slides difficult.
The integration analysis models the complete New York energy sector. The modeling includes a reference case that projects how the economy and energy sector will evolve out to 2050 in the absence of any Climate Act policies or mandates. Also included are four mitigation scenarios (shown below) that are compared to the reference case. This analysis forms the basis for the contents of the scoping plan that will be released in early 2022.
Scoping Plan
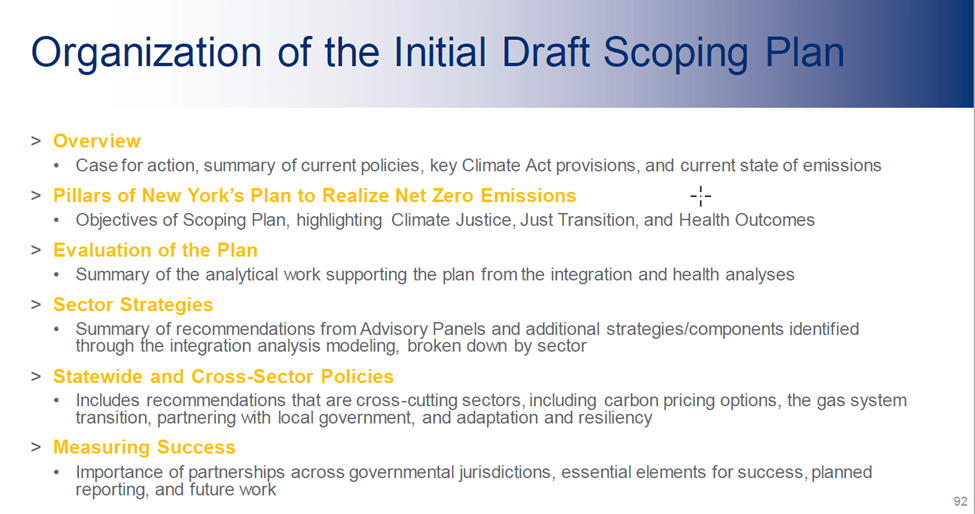
The video recording of the October 14, 2021 Climate Action Council provided the first look at the scoping plan. It included an initial draft Scoping Plan walkthrough starting at 3:48:04 of the recording. Note, however, that it was near the end of the session so it was only a cursory discussion. There is a one slide outline of the organization of the Scoping Plan that is discussed at 3:48:47. Not shown in the outline, but mentioned, was that there would be technical appendices included in the scoping plan document.
The presentation skipped the following three pillars discussions. I have not spent much time on the climate justice working group (CJWG) effort discussed in the next two slides. When they get around to making their recommendations to the Climate Action Council, I will post a summary. Note that DAC is a dis-advantaged community.
The health pillar is a key factor in their benefit-cost claims. The largest health benefit is from a reduction in inhalable particulates. I have explained previously that I cannot accept their health benefit modeling methodology and results until they demonstrate that the observed state-wide reduction of inhalable particulate concentrations from 2000 to 2020 has produced health benefits on the order of 15 times greater than the integration analysis predicted health benefits due to Climate Act inhalable particulate concentration reductions.
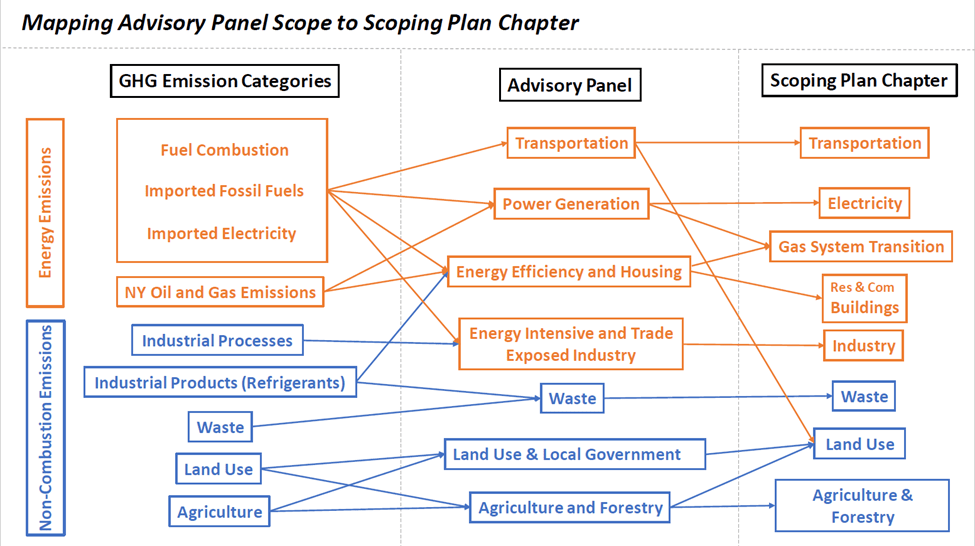
The presentation skipped (at 3:51:50 in the recording) to the map of greenhouse gas emission categories, the advisory panels and the chapters in the scoping plan. The slide just shows how the panel recommendations were incorporated into the scoping plan.
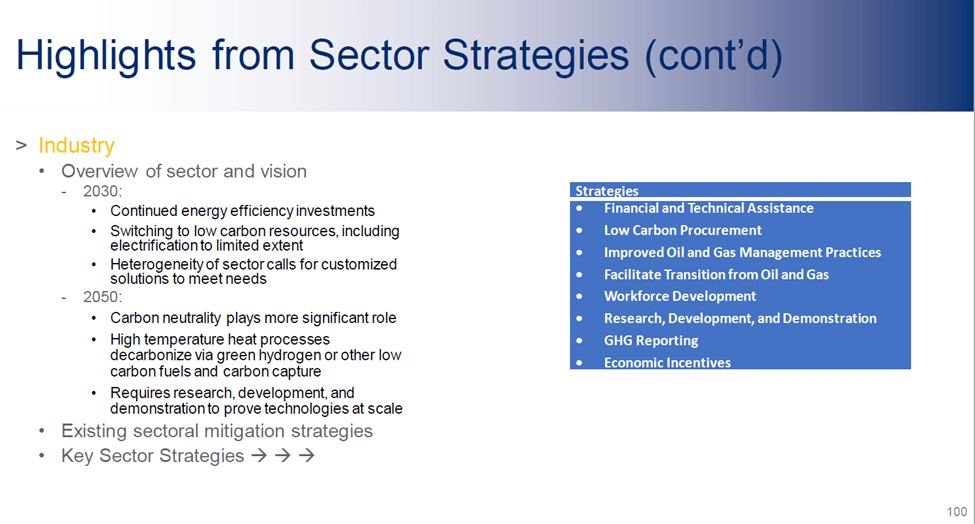
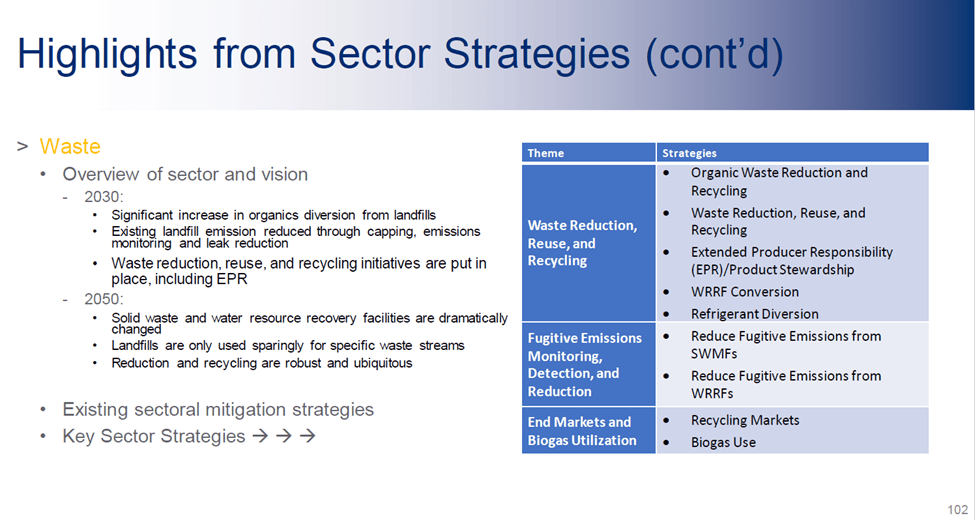
The next seven slides in the presentation highlight various sector strategies. Starting at 3:52:52 in the recording there was an explanation of the format of the strategy slides. Each contains an overview sector and vision including current status and vision for 2030 and 2050 and summary of the mitigating sector strategies on the left. On the right there is more detailed strategy information by theme. For your information, I list links for the presentations by each panel to the Climate Action Council and provide my impression of the initial summaries here.
In the following I highlight some of the strategies that will be included in the scoping plan when it is released next year. For the transportation sector note that the they have pushed the date for 100% light-duty zero-emission vehicles up to 2030 as opposed to the current legally mandated date of 2035. In addition, they somehow believe that it is possible to get 40% or more zero-emission sales for medium- and heavy-duty vehicles by 2030. They also presume that a “substantial portion” of personal transportation in urbanized areas will be shifted to public transportation or other low-carbon modes. By 2050 all vehicles have to be zero emissions. Note that “Some segments of hard-to-electrify sectors (aviation, freight rail) will rely on hydrogen and renewable biofuels, as needed”.
The buildings highlights presume that by 2030 heat pumps will become the majority of new purchases for space and water heating and that 1-2 million households will be electrified with heat pumps. In 2050 they expect that 85% of homes and commercial building space statewide will have electrified with heat pumps.
The electricity sector highlights slide is deeply concerning to me. The only difference between the overview and the mandated Climate Act targets is that they expect more behind-the-meter solar to be installed by 2030 than the 2025 Climate Act target. The following slide for the Industrial sector includes a statement that says “Requires research, development, and demonstration to prove technologies at scale”. The power sector strategies have the same constraint but there is no recognition of that fact. In this slide reliability is mentioned in the eighth of ten strategies. All this despite a reliability planning speaker session that warned that “it will not be enough to depend on today’s technology to develop a reliable electric system with net-zero emissions”. At the time I wrote that the ultimate question is whether the Climate Action Council will address the issues raised by the professionals or cater to the naïve dreams of the politically chosen members of the Power Generation Advisory Panel. Based on this presentation I fear they are catering to magical solutions touted by the uninformed.
The industry slide is unchanged from the advisory panel recommendations. Kudos to the fact that their strategies recognize the technological challenges faced by a transition to low-carbon processes.
The agriculture and forestry sectors also seem to be very similar to the advisory panel recommendations. I worry that their plan to “increase carbon storage and sequestration in agricultural and forestry products through the avoided conversion of farm and forest lands, afforestation and reforestation, improved forest management practices, cropland management practices and harvested wood products” will fail. Currently solar developers are rushing to develop as much as they can, as fast as they can, and as easily as they can, and that means plopping down hundreds of acres of solar panels on prime farmland. There is no plan or avenue to address this issue at this time.
I think one can argue that the waste sector has a lot of wishful thinking in their strategies. It basically boils down to planning on waste reduction, reuse, and recycling initiatives that are so effective that landfills are “only used sparingly for specific waste streams”. That has been a goal of the state for decades but has never panned out. It is not clear why the climate action plan will fare differently.
The final slide lists state-wide and cross sector strategies. For the economy-wide policies it says that the scoping plan will seek “input on options for economywide policies that price carbon emissions”. Climate action activists want to put a price on carbon but no one dares to let the public know what that will entail and what it will cost. The gas system transition recommendations to reduce emissions from the natural gas system through “an orderly transition that is equitable, cost-effective, and maintains system safety and reliability” is another strategy that avoids the inevitable public pushback when the time comes to say you cannot use natural gas in your home. The other recommendations sound appealing but won’t have major impacts on emissions.
Conclusion
It is terrifying to me that the Climate Act Scoping Plan that is intended to drive the next energy plan for New York State appears to overlook the importance of electric system reliability. The organization slide for the plan does not mention reliability and the power generation sector strategies mention reliability only in passing. It is important to note that the ideologues who have been allowed to shape the scoping plan strategies apparently do not recognize that the zero-emissions dispatchable resource necessary to keep the lights on does not exist. When the strategies are reviewed by the organizations charged with electric system reliability next year it will be time to decide if the transition is really only a matter of political will or if the risks are too great with today’s technology.
Emissions are best reduced gradually. The prevailing narrative that we must immediately undertake massive actions to eliminate global emissions by mid-century is not supported by the science. A crash elimination of emissions from our energy systems would be extraordinarily disruptive, raising energy costs and degrading reliability, stranding assets, and displacing workers. Those systems are slow to change, in part because they must be highly reliable and require large capital investments. While a zero-emissions electrical grid is central to decarbonization strategies, we don’t yet have the technology to create a grid that is also reliable and affordable. The recent EU electricity crisis, caused in large part by relying upon intermittent wind energy without adequate back up, illustrates the critical importance of reliability.
I have written extensively on implementation of the Climate Act because I believe the solutions proposed will adversely affect reliability and affordability, will have worse impacts on the environment than the purported effects of climate change, and cannot measurably affect global warming when implemented. The opinions expressed in this post do not reflect the position of any of my previous employers or any other company I have been associated with, these comments are mine alone.
Garnet Energy Center
The Garnet Energy Center is a proposed 200-megawatt solar project with 20 megawatts of energy storage located in the town of Conquest in Cayuga County, N.Y. The developer, NextEra Energy Resources, has 22 projects in New York. “It operates primarily as a wholesale power generator, providing power and environmental attributes to utilities, retail electricity providers, power cooperatives, municipal electric providers and large industrial companies. It owns and operates more than 21,000 megawatts of generating assets located primarily in 36 states and Canada as of year-end 2018.”
According to the July 2021 Proposed Array Layout the project area is 2,288 acres and the facility area (area within in project fence line) is 1,054 acres. The fenced area encloses the solar arrays, inverters, energy storage modules and the project substation. A revelation to me was that the developer only has six land owners lined up for the project and three of them provide the bulk of the property.
Project Benefits
According to the project benefits website: “The Garnet Energy Center will create new jobs, generate long-term revenue and deliver economic development to Cayuga County and the town of Conquest.” During the meeting issues were raised relative to these claims that I had not previously considered.
There is a “Benefits for the Local Community” section on the website. Consider their claims relative to other interpretations.
“Garnet is expected to provide millions in revenue to the town of Conquest, Cayuga County and the school district to invest in infrastructure, additional services and resources for residents.” Money is the driver for all renewable developments. The new state siting law is called the Accelerated Renewable Energy and Community Benefit Act and implies that the affected communities will get a windfall of additional money, just like this proposed benefit. Unsaid is the likelihood that the money to the school districts will likely be offset by decreases in state aid. In other words, some of this money could be a wash.
“The project will create three to four full-time positions and 250+ jobs during construction.” On the other hand, six farms will no longer be active. That means at least six full-time farming positions will be lost.
“There will be opportunities for local businesses to supply materials to support the construction of the project, and service-industry businesses such as hotels, restaurants and entertainment venues will benefit from an increase in worker activity throughout construction.” These are all temporary opportunities. There are no hotels or restaurants in the closest hamlets to the project site and other than road materials it is unlikely that local businesses will be able to supply other materials to support construction. On the other hand, over the life of the project the loss of six farms means that local businesses that supply the materials to support farmers will lose business.
In addition, Dan points out that when this project takes cropland out of production it will force other less productive, more environmentally sensitive land to be farmed. Moreover, farm communities rely on a network of support businesses- equipment dealers, feed mills, crop input retailers, hardware stores, veterinarians, nutritionists, crop advisors, accountants and other professionals. When communities lose farms, they eventually lose all of these services. Garnet claims that land used for industrial solar can be brought back into production. This may be true, albeit at large expense. However, when a community loses its agricultural support community, it is never coming back.
“The project will invest a substantial amount of money in construction labor, creating employment opportunities for those in the construction trades, including equipment operators, truck drivers, laborers and electricians.” While that will be the case the fact is that Conquest, NY is a vey rural area. When this project is completed those construction trade opportunities will move on to another area, likely too far for anyone in the affected community to commute.
Finally, the developers claim that Garnet will provide support for local farmers. “Through land agreements, Garnet Energy Center will support the agricultural economy by infusing revenue into family farms and diversifying their income. This income saves farm jobs and will increase the economic activity from these essential local businesses. The Garnet Energy Center will support family farms in the town of Conquest.” However a quick look at the July 2021 Proposed Array Layout shows that the solar arrays completely cover the properties of the farmers who are renting their land for the project. That is not diversification of income it is replacement of farming income with rental payments.
Dan points out there are there are unintended, far-reaching consequences of this land conversion. Although the increase in rental payments personally benefits the landowner, other positive community impacts of farming are lost. The farm will no longer spend money in the local community for the seed that would have been planted, the fertilizer that would have been applied, or the crop protection services provided by a local retailer. The opportunity for skilled farmworkers to ply their trade is also lost. Farms that have invested in facilities and machinery have fewer acres to spread that investment over. Mechanics that repair that equipment see their client base shrink. When all of these inputs are added up, non-rental cash costs for an acre of corn are well over $500 per acre.
Land Use
The Land Use & Local Government Advisory Panel submitted enabling strategies to the Climate Action Council last spring. The strategy for guiding future growth states:
Develop criteria and incentives for regional entities and counties to identify priority development areas (including areas appropriate for clean energy siting) and priority conservation areas in consultation with local jurisdictions and communities. Priority Development Areas may include Brownfield Opportunity Areas, downtowns, central businesses districts, municipal centers, hamlets, former industrial districts, infill projects in developed areas, obsolete fossil fuel-based power plants, re-development/adaptive re-use of existing buildings, TOD/Equitable TOD, disadvantaged communities (as defined by the Climate Justice Working Group), dead/dying malls and vacant property clusters designated by land banks, among others. Priority Conservation Areas may include wetlands, riparian areas, forests, agricultural lands and other natural areas and working lands that preserve and restore vital habitats, landscape connectivity, biodiversity, natural water movement, local food security and passive recreation, among others.
This strategy is a day late and a dollar short relative to the land rush of renewable development grifters rushing into the state to glom onto the current policy of building as much as possible as quick possible without any plan. The fact is that wind and solar energy siting requires much more land than available at any of the priority development areas simply because wind and solar energy are diffuse and require large areas to collect it. As a result, much development will take place in priority conservation areas. In addition, one of the strategies to sequester carbon to meet the net-zero target is to enhance soil productivity in agricultural areas and it is clear that there is a dis-connect between that strategy and the current land grab of prime agricultural land for solar development.
Conclusion
Many of my relatives were farmers and I can certainly understand why a farmer would prefer to rent their land for a guaranteed income free of the many risks and intensely hard labor needed to survive. It is incumbent upon the state to understand that while the farmers who rent their land make out well that there are downsides to solar development on the community and neighbors. The characterization by Garnet Solar that the project will support the agricultural economy overall is simply wrong. It will reduce farm jobs and the economic activity may be improved during construction but once the facility is operational there are very few economic benefits to essential local businesses.
There is no master plan for the Climate Act. The scoping plan that is supposed to be completed by the end of the year will present policies but there is no overall strategy to balance all the requirements of the Climate Act. All the currently proposed industrial solar projects are being developed without direction. It is unlikely that this will work out in the best interests of the state, affected communities, or neighbors to the projects.
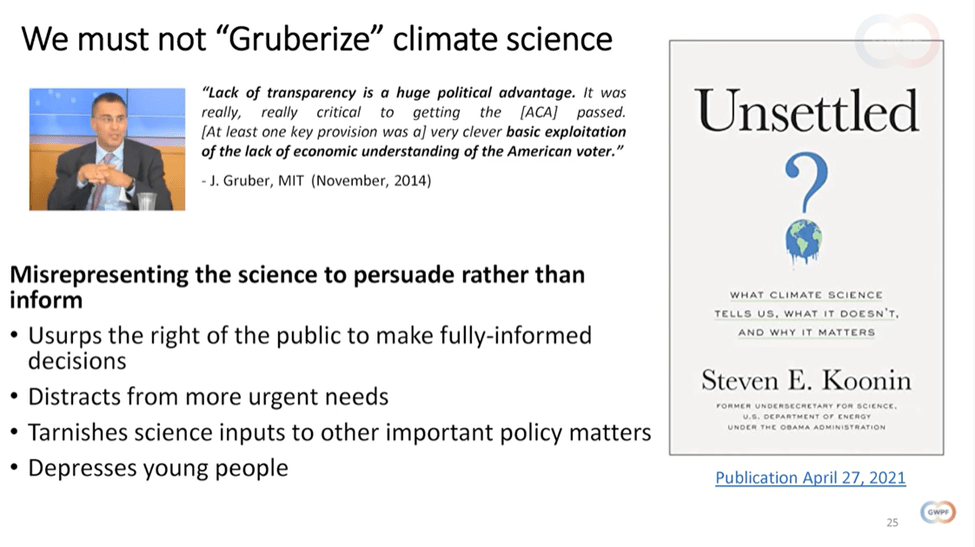
The Climate Leadership and Community Protection Act (Climate Act) codifies a New York approach to achieving net-zero emissions by 2050. Unfortunately, the rationale for this massive transformation of the entire energy sector is suspect because the science contained in the Intergovernmental Panel on Climate Change (IPCC) assessment of global warming was not understood. Dr. Steven Koonin’s “Unsettled: What Climate Science Tells Us, What It Doesn’t, and Why It Matters” translates the IPCC scientific reports into plain English and explains why a more reasoned approach to climate change is more appropriate.
I have written extensively on implementation of the CLCPA because I believe the ambitions for a zero-emissions economy outstrip available technology such that it will adversely affect reliability and affordability, will have worse impacts on the environment than the purported effects of climate change, and cannot measurably affect global warming when implemented. The opinions expressed in this post do not reflect the position of any of my previous employers or any other company I have been associated with, these comments are mine alone.
The rationale for the Climate Act is that climate change is “the greatest threat facing life as we know it” based on the “science”. However, the authors of the Climate Act, the politicians who voted for the it, and the individuals charged with developing a plan to meet its targets did not choose to follow the science contained in the IPCC assessment of global warming for what I think are a variety of reasons. Caught up by massive publicity to push the climate catastrophe narrative these folks were either naïve, did not bother to try to understand or know full well that the science buried in the scientific reports contain major uncertainties and results that show this is an issue that can be addressed better.
Dr. Steven Koonin is a theoretical physicist, director of the Center for Urban Science and Progress at New York University, and a professor in the Department of Civil and Urban Engineering at NYU’s Tandon School of Engineering. From 2009 to 2011, he was Under Secretary for Science, Department of Energy, in the Obama administration. His book “Unsettled: What Climate Science Tells Us, What It Doesn’t, and Why It Matters” translates the IPCC scientific reports into plain English and does a great job explaining issues with the climate model results. His background as a scientific advisor in the Obama Administration gives him the background to ask the right questions to develop a policy that will not do more harm than good. He makes a great case that the Climate Act is on the wrong path.
I highly recommend this book for anyone who wants an in-depth description of the problems with the current climate change narrative that the science is settled and supports the massive transformation to a net-zero economy. The Global Warming Policy Foundation (GWPF) had Koonin give the 2021 Annual GWPF lecture based on his book in London on November 16, 2021 that serves as a good advertisement for the book. The video of the lecture takes about 40 minutes of your time to get an excellent summary of the issues described in detail in the book.
GWPF Lecture Slides
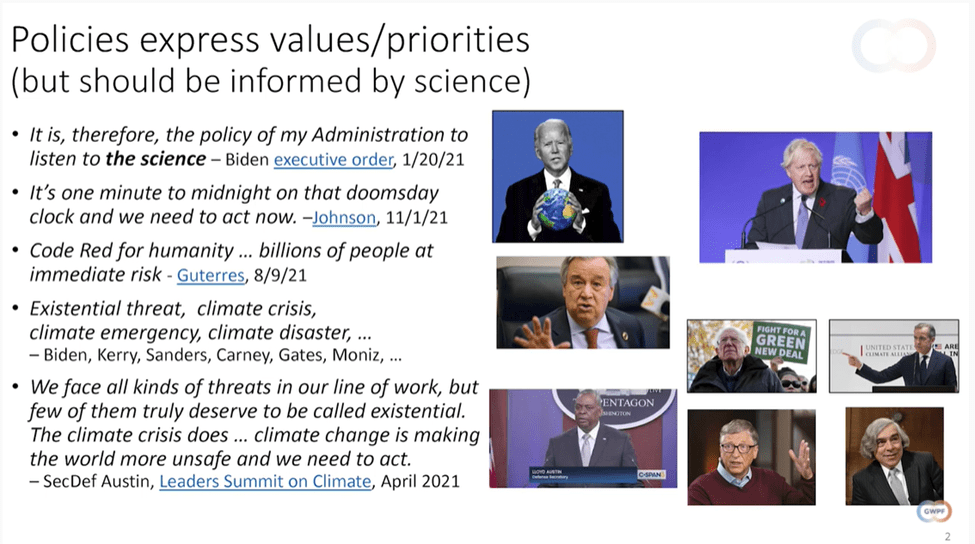
In this section I will give an overview of the lecture. I took screen shots of the slides in the lecture. His first slide (discussed at 5:10 in the recording) gave examples of the alarming stories we have heard in the leadup and during the 2021 Conference of Parties meeting in Glasgow Scotland in November 2021.
[1] The ultimate problem with the climate modeling is that it cannot simulate clouds. In order to solve the physical equations in a global climate the world has to be divided up into a three-dimensional grid. The equations are calculated for each grid cell and repeated to generate a forecast. My particular problem is that the grid cell size needed in order to do these calculations are on the order of 100 km horizontally, the vertical height is often 1 km and they do the calculations every 30 minutes or so. As a result, the models cannot simulate clouds. Instead the climate modelers develop parameters to project the effect of global warming on clouds. That single parametrization is a big enough driver of climate that this model component alone could dominate the GCM projections. This uncertainty is well understood in climate science by those who have worked with these models. However, the problems with parameterization is not well understood and its ramifications on the policy decisions is poorly understood by most of those who advocate eliminating fossil fuel use.
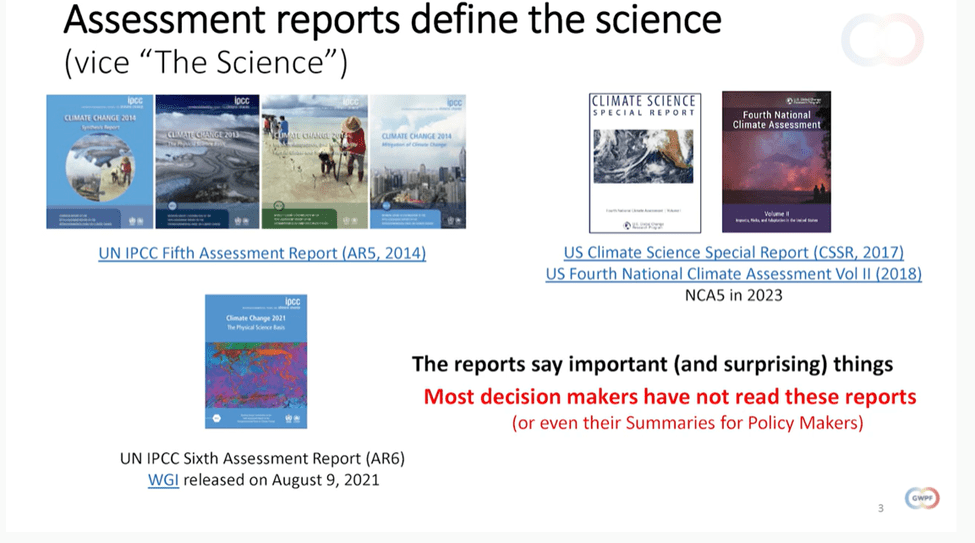
Dr. Koonin went on to explain (6:35 in the recording) where these stories come from. The IPCC and a similar organization, the US National Climate Assessment have developed what has become to be known as the “consensus” for climate change science. Very few people have waded through all those reports and I am comfortable saying that no policy decision makers have read them. The book explains why the material in the scientific assessments say important and surprising things that have not been considered in the Climate Act and bely the narrative that there is a climate crisis.
The book gives examples (8:10 in the recording) of surprises where commonly held beliefs about climate change science are not supported. Please keep in mind that there are multiple lines of evidence and sources of data to support any climate science claim. The point is that while we are incessantly told that the science is certain and settled, the reality is that the scientific assessment reports and other analyses actually show information that runs contrary to the narrative.
Dr. Koonin explains (10:30 in the recording) how the unsettled science with alternative viewpoints has morphed into the climate crisis story in the next slide. Scientific analyses of observations and modeling simulations are numerous and not understood by many people. The IPCC and the equivalent US organizations summarize the literature in assessment reports. However, even those are overly technical for most policy makers so summaries are developed. Press releases describing the assessment results invariably highlight the scariest results and that is what usually drives public and decision maker perceptions. He concludes this discussion with a description of the bad behavior that turned the unsettled science into the current narrative of climate crisis certainty:
Confusing weather with climate
Confusing “climate change” with “a changing climate”
Highlighting recent trends without historical context
Implausibly extreme emissions scenarios termed “business as usual”
Minimization of uncertainties
Alarming predictions that never materialize and are soon forgotten
Non-expert and activist reporters aiming to persuade rather than to inform
Suppression of legitimate divergence from the consensus (“denier”,…)
All of this behavior has been evident during the Climate Act implementation process.
Dr. Koonin goes on to give specific examples of data contradicting the commonly understanding of increasing hurricane intensity and numbers and sea-level rise. The book includes more examples and provides greater detail. Importantly, remember that all his information is directly from the scientific assessment reports not filtered through the telephone game. The common perception of the existential threat of climate change are the result of the bad behavior he describes. Hurricane trends are described at 13:02 in the recording.
Sea-level trends are described at 14:08 in the recording.
Koonin uses the discussion of sea-level variability in the IPCC latest report as an example of how the real story is obscured in the report at 15:02 in the recording. It is well worth listening to this bit to understand the games that are played to tell the story.
In addition to the perverted historical observation stories, the projections for climate change impacts in general and sea-level rise in particular are biased as shown at 17:38 in the recording. The Climate Act rationale relies on these projections and does not recognize the issues raised for the Manhattan sea-level trends shown in the following slide.
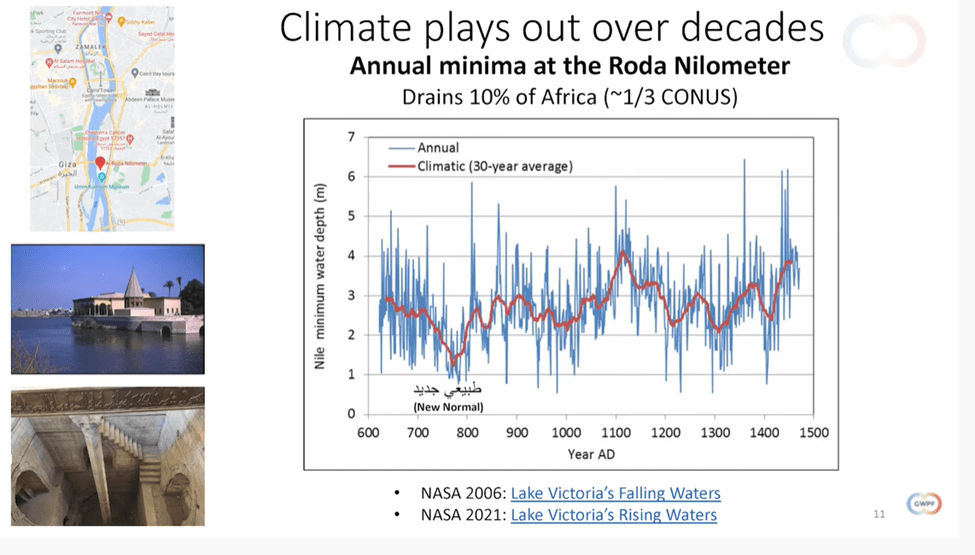
The next slide (19:35 in the recording) looks at Nile River water level over 900 years to illustrate the point that there is always variation in a climate data observation set.
Last summer there was an extraordinary period of high temperatures in the Pacific Northwest that was wrongly attributed to climate change. However, the historical record of high temperatures (22:25 in the recording) does not indicate any trend that could be ascribed to climate change due to greenhouse gas concentrations increasing over time.
Another Climate Act claim is that there are climatic trends in precipitation. Again, the actual historical data don’t support those claims (23:02 in the recording).
The next slide (24:50 in the recording) addresses SW United States and California droughts. He explained that there is no apparent trend in the Southwest but there seems to be a trend for droughts in California.
The climate crisis narrative ascribes the recent forest fire problems in California to a climate change in droughts but the following slide (24:45 in the recording) explains that forest management and development are also factors for forest fire damages.
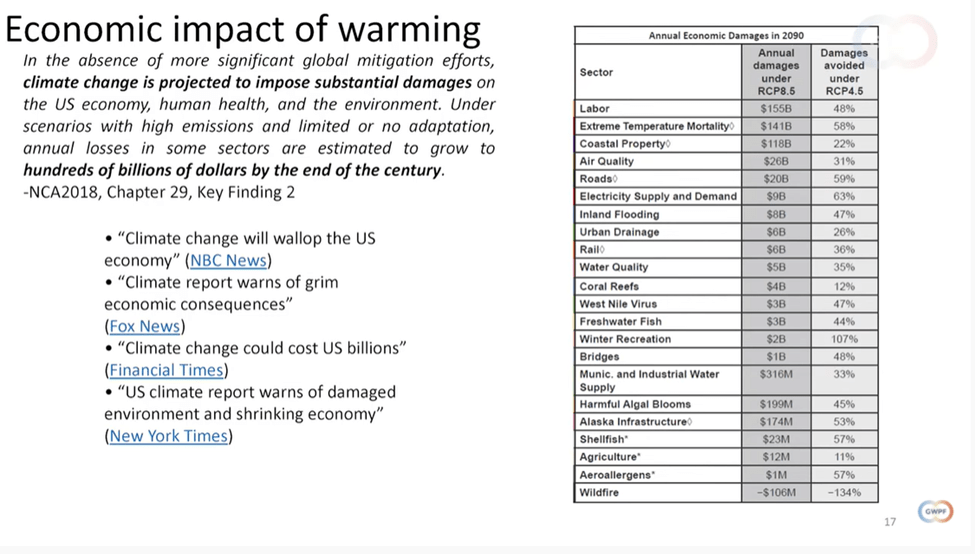
One of the fundamental arguments for the Climate Act was that there will be major economic impacts if we don’t do something. The economic impact of warming slide (27:41 in the recording) gives examples of media coverage of those impacts and shows that the alarming numbers are given out of context. If you consider these values relative to the total costs they are “in the noise” of expected variability.
One of the major points in the book that was too complicated to include in the lecture was the over-reliance on an unrealistic projection (RCP8.5 on the chart) for future emissions. All of the most alarming projections use this very questionable assessment and, as a result, are very unlikely (29:32 in the recording).
Even when the unrealistic estimates of future emissions are used the impacts of climate change will “be small relative to the impacts of other drivers” (30:15 in the recording). He concludes that this should not be considered a climate crisis.
In the final section of the lecture and the book he discusses the likelihood that there will be global action to reduce greenhouse gas emissions. He concludes that global “net zero” by 2050 is a fantasy in the developed world because of the importance of reliable energy systems, the difficulty of transforming the energy sector away from fossil fuels, and the potential that ill-conceived changes will have negative consequences (31:03in the recording). With respect to the Climate Act note that he believes that backlash is likely when the public becomes aware of the reliability risks and enormous costs of the net-zero transformation.
In the next slide (34:18 in the recording) he addresses whether net-zero is possible in the developing world. Given the facts that energy demand is correlated with well-being and that “fossil fuels are the most convenient and reliable way to meet growing demand” he believes that there are self-interests and moral obligations to meet that energy demand using fossil fuels. As a result, greenhouse gas emissions will continue to rise.
Koonin explains that if you want to decarbonize in the best way(35:42 in the recording) that it is necessary to optimize the rate of decarbonization. If you go too fast you incur costs due to disrupting the system (e.g., blackouts due to reliability issues) and extra costs because the technology is immature. If you go too slow there are greater risks of climate damages.
Koonin ran out of time to discuss the slide at 36:53 in the recording. He makes the point in this slide that the “largest cost of a green grid is not generation but reliability”.
At 37:04 in the recording he stated that adaptation will be dominant response and explained why. Also note that he makes the point that it is a lot easier to adapt if you’re richer than if you’re poorer. As a result the best global solution may be to help developing countries move along to more prosperity.
In the slide described at 36:18 in the recording he makes a point that is prominent in the book. It is inappropriate to “misrepresent the science to persuade rather than to inform”. He notes that Jonathan Gruber was one of the primary architects of Obamacare and in the quotation admits to exploiting the lack of understanding of economics of the American voter. The architects of the Climate Act certainly did the same thing to con the New York legislature and Governor to pass the plan to “do something” about climate change with the provisions included. I believe that all of the problems noted that result from this misrepresentation are part of the fallout of the Climate Act.
Finally, he recommended (40:05 in the recording) a course forward. He says first we need to not panic and put more emphasis on adaptation rather than mitigation. He concludes that decarbonization pathways were put together by people who have no sense of the real world.
Conclusion
Koonin’s concludes that “precipitous climate action can be much more dangerous than any climate change you can imagine. I concur. If you want a readable description of the basis for our belief than I recommend reading his book.
I have written extensively on implementation of the CLCPA because I believe the ambitions for a zero-emissions economy outstrip available technology such that it will adversely affect reliability and affordability, will have worse impacts on the environment than the purported effects of climate change, and cannot measurably affect global warming when implemented. The opinions expressed in this post do not reflect the position of any of my previous employers or any other company I have been associated with, these comments are mine alone.
Developing a plan to transform the energy sector of the State of New York is an enormous challenge so the New York State Energy Research and Development Authority (NYSERDA) and its consultants are providing technical support to translate the recommended strategies into specific policy options in an integration analysis. An overview of the results of this integration analysis were presented to the Climate Action Council at the two October meetings. There is a notable lack of documentation available for the analysis so meaningfully reviewing the plan is difficult.
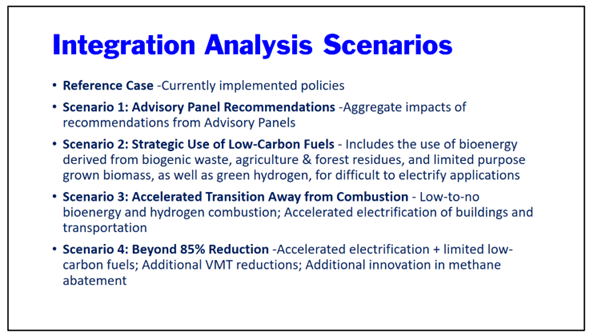
The integration analysis models the complete New York energy sector. The modeling includes a reference case that projects how the economy and energy sector will evolve out to 2050 in the absence of any Climate Act policies or mandates. The following slide from the first integration analysis presentation lists the four mitigation scenarios that were developed to compare with the reference case. The first simply developed energy strategies that implemented the advisory panel recommendations but the results showed that even more stringent policies were needed because the 2030 targets were not met. The second mitigation scenario meets the 2030 targets by using low-carbon fuels to meet the critical need for dispatchable resources to keep the lights on. The third scenario placates the members of the Climate Action Council that naively demanded that no combustion is necessary despite the lack of a proven technology that can keep the lights on in the worst-case scenarios. Because some members of the Climate Action Council are dupes who don’t appreciate the technological hurdles and risks to reliability of the transition to zero-emissions using renewable energy and have no personal accountability for recommending policies that put New York at risk of catastrophic blackouts, there is a fourth mitigation scenario that looks at options for eliminating combustion as much as possible as soon as possible.
Related Environmental Impact Statements
Consistent with 6 New York Codes, Rules and Regulations (NYCRR) §617.9(a)(7), a Generic Environmental Impact Statement is the appropriate mechanism for assessing environmental impacts related to the Climate Act. On September 17, 2020 the Final Supplemental Generic Environmental Impact Statement (SGEIS) for the Climate Leadership and Community Protection Act was released. It evaluated the environmental impacts associated with the incremental resources needed to comply with the Climate Act and built upon and incorporated by reference relevant material from four prior State Environmental Quality Review Act (SEQRA) analyses. Each of the analyses evaluated the environmental impact of the expected renewable energy resources needed at the time of the analysis was done. The most recent version considered the impact not only of previous New York proceedings but also the mandates in the Climate Act.
According to the 2020 SGEIS report:
Exhibit 2-5 summarizes the current renewable energy generation in New York, in addition to the offshore wind and distributed solar procurement goals, and the estimate of utility-scale solar capacity required to meet the meet the 70 by 30 goal. This SGEIS is evaluating a range of utility-scale solar that can maximize the competitive outcome, including up to an incremental 6,300 MW of utility-scale solar. Procurement of 5,800 MW of offshore wind by 2030 represents a portion of the 9,000 MW by 2035 procurement goal. Distributed solar capacity by 2030 is expected to exceed the 6,000 MW by 2025 procurement goal by an additional 3,000 MW and would reduce the amount of installed capacity procured through Tier 1.
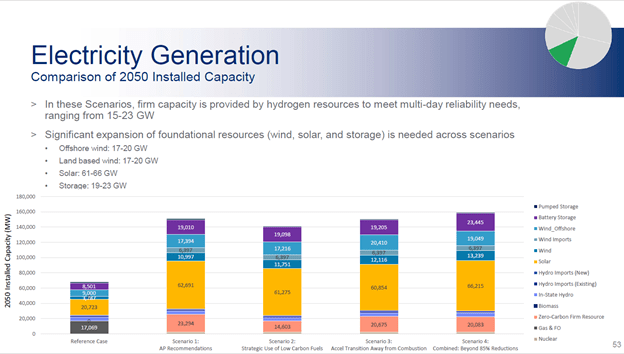
Integration Analysis Expected Renewable Capacity The problem is that the original expectations of renewable capacity for the Climate Act falls far short of the renewable capacity requirements in the integration analysis for 2050. The integration analysis initial results presentation includes the following graphic that lists the capacity needed for each renewable energy source.
The following table compares the integration analysis installed capacity with the SGEIS Exhibit 2-5 expected renewable capacity. The integrated analysis does not differentiate between distributed solar and utility-scale solar. In order to compare the expected values, I pro-rated the total solar by the distributed and utility-scale solar values from the SGEIS. The table shows that the environmental impact statements done to date considered renewable resource capacities far less than what the integration analysis expects will be needed: one and half times more onshore wind, nearly twice as much offshore wind, and over three times as much distributed and utility-scale solar. In addition, no previous analysis considered the environmental impacts of massive energy storage facilities or the “zero-carbon firm resource” that the integrated analysis presumes will be provided by hydrogen resources. Moreover, these are just the generating resources. There will also be significant environmental impacts associated with the transmission system additions and upgrades necessary to get the renewable resources into the grid.
There is no question that the integrated analysis renewable resources should be addressed in another environmental impact statement. Assuming 3.3 MW turbines (average turbine size in the Article Ten queue in 2020), integrated analysis Scenario 2 calls for over 1,100 more turbines. The solar projects in the Article Ten queue in 2020 averaged 9.3 acres of equipment area per MW and that means that the SGEIS solar equipment area covered was 110 square miles and the Scenario 2 solar equipment area covered would be 353 square miles.
Conclusion
On January 8, 2021 I published an article on CLCPA Cumulative Environmental Impacts that concluded the biggest deficiency in the CLCPA was the lack of a feasibility study that incorporates environmental impact criteria. I also noted that when there is an “official” estimate of those resources clearly a cumulative environmental impact analysis for those resources should be completed as soon as possible. Now that we have those resource estimates another environmental impact assessment that covers the increased wind and solar resources as well as the energy storage, the zero-emission firm resource, and transmission system impacts needed is necessary.
At the time I noted that there should be a threshold for unacceptable environmental impacts. For example, I am worried about eagles. If you had told me 30 years ago that I would ever see a Bald Eagle from my home I would have been doubtful. Now that has occurred and I am not willing to chance that environmental victory. Because there are a limited number of eagles and their reproduction rates are low, I imagine that wildlife biologists could develop a criterion on the acceptable annual rate of state-wide eagle deaths from wind turbines. There were 426 occupied bald eagle nest sites in New York in 2017. It is obvious that a more detailed projection of wind turbine impacts on this rare resource is needed. Environmental thresholds should be included in the scoping analysis.
The New York Climate Leadership and Community Protection Act (Climate Act) integration analysis initial results were discussed at the October 1, 2021 Climate Action Council meeting (meeting recording available here). There are many warning signs that the proposed plan is incredibly risky but the Climate Action Council has not shown any sign of concern. Perhaps the moral of a children’s story will remind them that the first principle of electric energy planning should be to not endanger reliability and if there are warning signs, they should re-examine the direction of their policies.
Developing a plan to transform the energy sector of the State of New York is an enormous challenge so the New York State Energy Research and Development Authority (NYSERDA) and its consultants are providing technical support to translate the recommended strategies into specific policy options. The results of this integration analysis were presented to the Climate Action Council in two October meetings.
The integration analysis models the complete New York energy sector. It includes a reference case that projects how the economy and energy sector will evolve out to 2050 in the absence of any Climate Act policies or mandates. The following slide from the first integration analysis presentation lists the four mitigation scenarios that were developed to compare with the reference case. The first simply developed energy strategies that implemented the advisory panel recommendations but the results showed that even more stringent policies were needed because the 2030 targets were not met. The second mitigation scenario meets the 2030 targets by using low-carbon fuels to meet the critical need for dispatchable resources to keep the lights on. The third scenario placates the members of the Climate Action Council that naively demanded that no combustion is necessary despite the lack of a proven technology that can keep the lights on in the worst-case scenarios. Because some members of the Climate Action Council are dupes who don’t appreciate the technological hurdles and risks to reliability of the transition to zero-emissions using renewable energy and have no personal accountability for recommending policies that put New York at risk of catastrophic blackouts, there is a fourth mitigation scenario that looks at options for eliminating combustion as much as possible as soon as possible.
Tootle
I have an interest in trains no doubt enhanced by early childhood stories like the classic Little Golden Book story of Tootle. The moral of this story is apropos for the Climate Action Council. According to the Little Gold Books fandom site the story synopsis is:
The protagonist is Tootle, a baby locomotive who is attending train school, hoping to grow up to be the Flyer on the New York-Chicago route. His schoolwork involves such tasks as stopping at red flags and pulling a dining car without spilling the soup. Most important, however, is that he must stay on the rails no matter what…Bill his good friend and teacher tells Tootle that trains are not professional unless they get 100 A+ on staying on the rails no mater what. One day when Tootle is practicing the rule a horse challenges him to a race to the river. Tootle goes faster but loses his race lead to the horse when he turns a curve so he gets off the tracks and ties with the horse. In the days that follow Tootle becomes fond of playing in the meadow and not staying on the tracks and Bill quickly discovers what Tootle has been doing. Not wanting to take away the offer of being a flyer Bill decides a plan with the mayor to put Tootle back on the tracks. One day when Tootle is driving the railroad he hops off the tracks to play in the meadow but sees red flags everywhere in the grasses and he is upset due to having to stop at red flags; trains hate nothing more than stopping. Tootle then sees Bill with a green flag over the railings and having learned his lesson gets back on the track and says that playing in the meadow only brings red flags to trains. In response to the lesson learned the town cheers for him and rewards Tootle the flyer of the route to Chicago. In the days that follow when Tootle becomes elderly he teaches some new locomotives some advice including “Stay on the rails no matter what.”
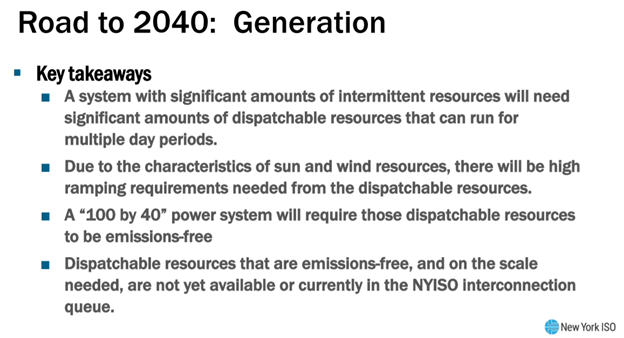
On August 2, 2021, the New York State Energy Research and Development Authority (NYSERDA) held a Reliability Planning Speaker Session to describe New York’s reliability issues to the advisory panels and Climate Action Council and in my summary of the presentations I noted that there were warnings.. The New York State Reliability Council notes that “substantial clean energy and dispatchable resources, some with yet to be developed technology, over and above the capacity of all existing fossil resources that will be replaced” needs to be developed. The New York Independent System Operator (NYISO) explicitly points out that a “large quantity of installed dispatchable energy resources is needed in a small number of hours” that “must be able to come on line quickly, and be flexible enough to meet rapid, steep ramping needs” but only implicitly points out that these are magical resources that do not exist yet for utility-scale needs. The utility consultation group explained that “technology development and diversity of clean resources are essential for long term success” but provide no details of the enormity of that task. Even the Department of Public Service made the point that “evaluating and implementing advanced technologies to enhance the capability of the existing and future transmission and distribution system” is necessary for future reliability.
The latest red flag warning comes from the NYISO. In a presentation describing the 2021 -2030 Comprehensive Reliability Plan, one of the key takeaways in their analysis of the requirements needed to make the New York electric system zero-emissions by 2040 is that “Dispatchable resources that are emissions-free, and on the scale needed, are not yet available or currently in the NYISO interconnection Queue”.
Integration Analysis Reliability Solution
The integration analysis could not ignore the need for a zero-emissions dispatchable or “firm” resource. All of the mitigation scenarios include a zero-carbon firm resource installed capacity ranging from 15 to 23 GW. According to the following slide, “firm capacity is provided by hydrogen resources to meet multi-day reliability needs”. I documented the technological readiness of hydrogen for transport, storage, production and generation from the International Energy Agency (IEA) “Special Report on Clean Energy Innovation” report. At this time there are only technologies available for transport and storage that are mature enough that New York can count on as part of the “firm capacity hydrogen resource”. The necessary production and generation technologies are not as mature. The IEA assessed technology on a 11-point scale. There are two generation technologies that are two levels away from being proven and mature technologies with all other options rated lower. There is one production technology that is rated as one level away from being mature. The technologies needed for hydrogen to be usable as a firm zero emissions capacity need evolutionary improvements to stay competitive and even then, would need further integration efforts. Furthermore, I only evaluated technological feasibility and not costs or environmental impacts. There are plenty of concerns related to the hydrogen economy overlooked in the integration analysis that must be addressed before they can be used. Bottom line is that all these issues represent many red flags for this technological “solution”.
Conclusion
Tootle leaned that it is necessary to stay on track “no matter what” when he was confronted by many red flags waving. The Climate Action Council needs to remember that in order for an energy plan to stay on track it must make reliability the first priority. At this time, they are off track and ignoring many red flags waving. There is no viable zero-emissions firm capacity in existence that fulfills that resource requirement. If they don’t get on track then the energy plan will fail to maintain current reliability standards and New Yorkers will pay the price with blackouts.
I have written extensively on implementation of the CLCPA because I believe the ambitions for a zero-emissions economy outstrip available technology such that it will adversely affect reliability and affordability, will have worse impacts on the environment than the purported effects of climate change, and cannot measurably affect global warming when implemented. The opinions expressed in this post do not reflect the position of any of my previous employers or any other company I have been associated with, these comments are mine alone.
Developing a plan to transform the energy sector of the State of New York is an enormous challenge so the New York State Energy Research and Development Authority (NYSERDA) and its consultants are providing technical support to translate the recommended strategies into specific policy options. The results of this integration analysis were presented to the Climate Action Council in two October meetings.
The integration analysis models the complete New York energy sector. It includes a reference case that projects how the economy and energy sector will evolve out to 2050 in the absence of any Climate Act policies or mandates. The following slide from the first integration analysis presentation lists the four mitigation scenarios that were developed to compare with the reference case. The first simply developed energy strategies that implemented the advisory panel recommendations but the results showed that even more stringent policies were needed because the 2030 targets were not met. The second mitigation scenario meets the 2030 targets by using low-carbon fuels to meet the critical need for dispatchable resources to keep the lights on. The third scenario placates the members of the Climate Action Council that naively demanded that no combustion is necessary despite the lack of a proven technology that can keep the lights on in the worst-case scenarios. Because some members of the Climate Action Council are dupes who don’t appreciate the technological hurdles and risks to reliability of the transition to zero-emissions using renewable energy and have no personal accountability for recommending policies that put New York at risk of catastrophic blackouts, there is a fourth mitigation scenario that looks at options for eliminating combustion as much as possible as soon as possible.
Benefits Overview
It is difficult to describe the benefit calculations in any detail because the documentation consists of a power point presentation that offers little supporting information. The discussion of the benefits and costs analysis starts at 1:11:30 in the recording of the presentation by Carl Mas. The first slide discussed the resource cost analysis approach.
The next slide explained (1:14:33 of the recording) that the value of avoided greenhouse gas (GHG) emissions will be calculated based on guidance provided by the Department of Environmental Conservation (DEC). This externality benefit is called for in the law and was not discussed in the presentation after the introduction. In a previous post I evaluated this benefit. Note that the slide says they calculate the value of avoided greenhouse gas emissions. I explained that approach incorrectly uses the social cost of carbon metric values by applying them to avoided emissions rather than the emission reductions themselves. The integration analysis claims reducing GHG emissions will provide societal benefits of avoided economic damages of $260 billion. The correct value is much less. According to §496.4 Statewide Greenhouse Gas Emission Limits (a) “For the purposes of this Part, the estimated level of statewide greenhouse gas emissions in 1990 is 409.78 million metric tons of carbon dioxide equivalent, using a GWP20 as provided in Section 496.5 of this Part”. The DEC Value of Avoided Carbon Guidance recommends a social cost of $121 in 2020 and $172 in 2050. If New York had magically eliminated all of the 409.78 million tons of GHG in 2020 the societal benefit of those reductions would have been $49.6 billion making the integration analysis 5.24 times too high. If all the reductions occurred in 2050 the societal benefit would be $70.5 billion making the integration analysis 3.7 times too high.
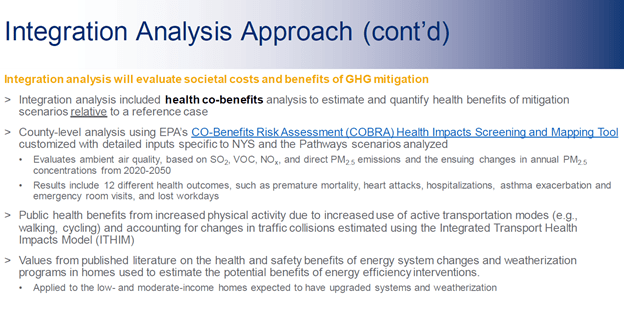
The next slide (1:15:34 of the recording) summarized the approach used in the analysis. He noted that inhalable particulates (PM2.5) was “really the core driver of our asthma, heart attacks, and early mortality” health impacts. They came up with a couple of other potential health benefits. This section is a good overview of the “angles” they are taking to monetize health benefits.
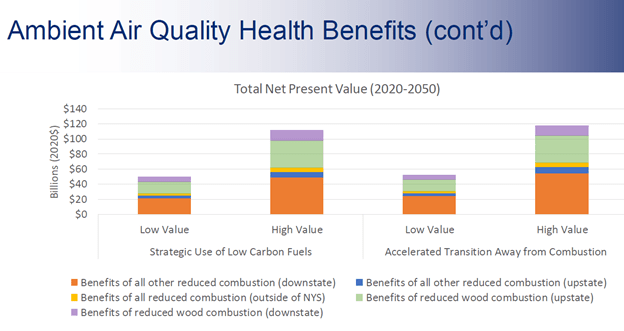
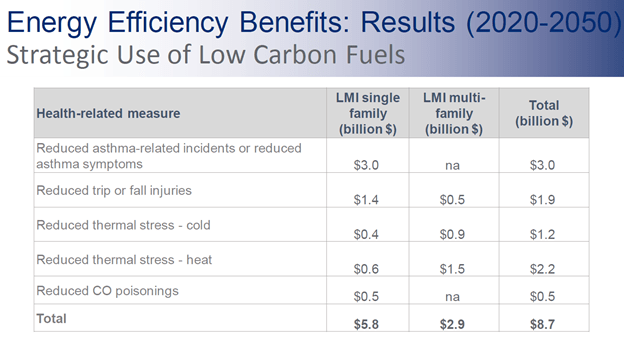
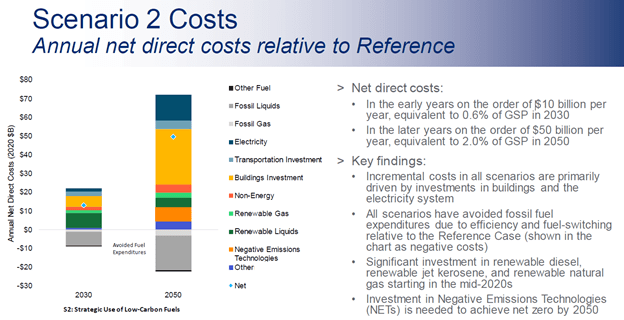
The summary of the benefits (1:28:55 of the recording) introduces the idea that the cost of inaction exceeds the cost of action by more than $80 billion. The benefits breakdown in the “Strategic Use of Low Carbon Fuels” scenario into two categories. In the first there are $160 billion in benefits due to improvements in air quality, increased active transportation, and energy efficiency interventions in low- and moderate- income homes. Reducing GHG emissions avoid social costs due to climate change to the tune of $260 billion. The claim is that there is a $420 billion benefit to society when the Climate Act emission reduction programs are implemented.
After a discussion of the cost estimates, the presentation went into the details of the health effects benefits (2:59:40 of the recording). Note that in the introduction to the health effects “deep dive” there is a “spoiler alert” that wood smoke is an important driver of health impacts and that as we electrify and do energy efficiency, we will be reducing wood smoke as well. Mas then re-iterated that three components were analyzed (3:01:16 of the recording).
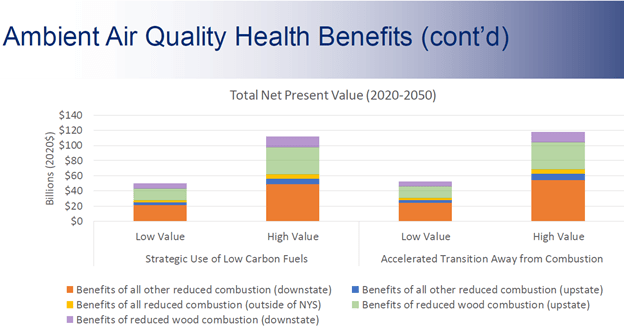
According to the key findings slide (3:02:25 of the recording) the health impacts have a high and low range of benefits. While they have “honored” that the higher values are model outputs they use a number from the higher end of the range because it is “conservative” and they don’t include the impacts of ozone and toxics. Note that most of the impacts are experienced in state but there are benefits to downwind states.
Air Quality Benefits
According to the presentation (3:05:34 of the recording):
Air quality improvements can avoid:
Tens of thousands premature deaths
Thousands of non-fatal heart attacks
Thousands of other hospitalizations
Thousands of asthma-related emergency room visits
Hundreds of thousands lost workdays
Note that these air quality improvements are monetized to come up with the benefit dollars.
The next slide (3:06: 04 of the recording) breaks down the projected health benefits across scenarios 2 and 3 by the areas affected and primary driver.
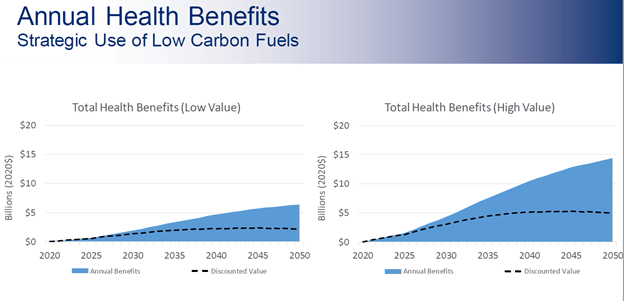
The “Annual health benefits” slide (3:07: 47 of the recording) shows “what the discounting and time value of money do” to the results. Note that benefits grow over time.
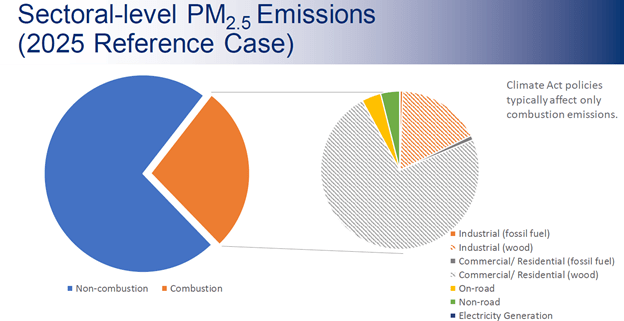
The next slide I will discuss (3:08:27 of the recording) shows where the inhalable particulate emissions are coming from. I am not comfortable with this slide based on my experience. In particular his claim that “It may be surprising to some that most of the PM2.5 comes from non-combustion sources” runs contrary to my long-held understanding but that will have to be a topic for another article. The point of this slide is that wood burning is a bad actor: “It is not that we are burning a lot of wood but it is very dirty when it is burned.”
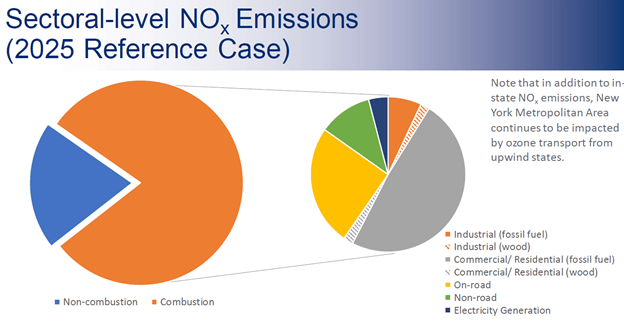
The next slide (3:11:17 of the recording) shows the emissions for nitrogen oxides (NOx). The slide shows that most of the NOx comes from combustion and that very little of it comes from wood burning. Mas concludes that in order to reduce these emissions we need to “go after” the on-road vehicle fleet and in-building fuel combustion.
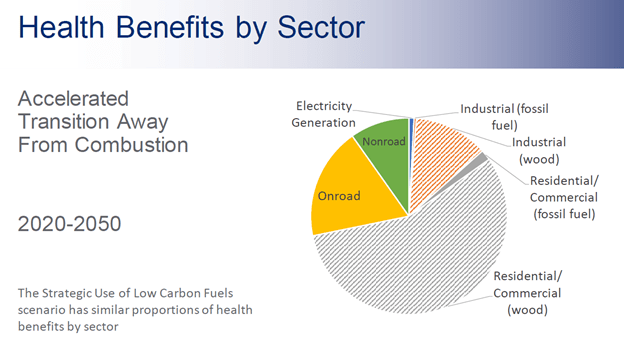
The next slide (3:12: 53 of the recording) shows the health benefits by sector. The key finding in this slide is that there are significant health benefits if residential and commercial wood burning is reduced. He re-iterates the claim that as we electrify buildings and improve energy efficiency that wood burning will go down. Outside of the Albany bubble there is an inconvenient fact. Most people who burn wood do it because it is the most economical solution for home heating in their situation. In rural areas many people have wood lots and the fuel is free. Until such time that electrifying homes and providing improved energy efficiency is free, I don’t see why the integration analysis can assume that there will be significant reductions in wood burning.
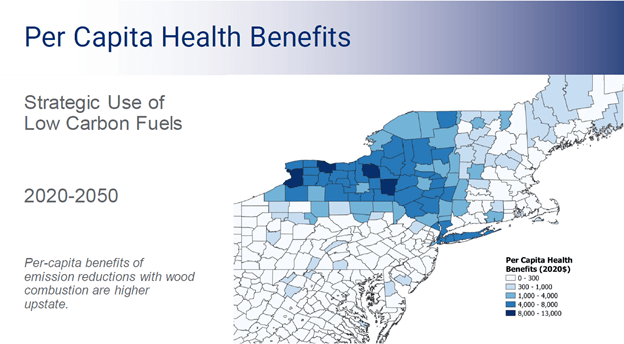
The “Per Capita Health Benefits” slide (3:14: 08 of the recording) is the first of a series of slides that presents data on a county basis. They present the data on a per capita basis to normalize the results. The broad swath of upstate counties gets most of their benefits from emission reductions with wood combustion in scenario 2 “strategic use of low carbon fuels”. There is a similar slide for the “accelerated transition away from combustion” scenario that is in the presentation but not included here.
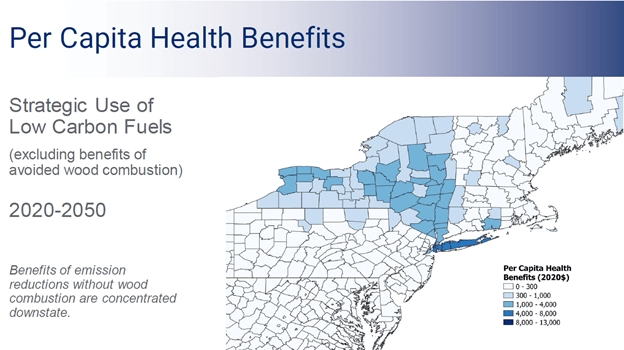
The next slide (3:16:16 of the recording) excludes the benefits of wood combustion for scenario 2. This shows the health benefits from reducing fossil fuel emissions. New York City and Long Island would benefit the most if those emissions were reduced. There is another similar slide for scenario 3. It shows that three counties are kicked up from the 300 – 1,000 health benefit cost level to the 1,000 – 4,000 cost level.
In his description of the slide that shows the projected reduction in PM2.5 annual average concentrations (3:17:39 of the recording) Mas mis-spoke when he says we are going to look at CO2 concentrations that drive the health benefits. Actually, as mentioned earlier, he said that the health benefits are driven by inhalable particulates, PM2.5. This slide shows the results of decreasing emissions from both the wood smoke and fossil fuel sources due to the integration analysis projected changes due to their electrification and energy efficiency policies. Mas claims that there are “deep” reductions across the state but the highest possible reduction is only 0.35 µg/m3.
The next slide (3:18:58 of the recording) shows the annual reductions when the benefits of avoided wood combustion are not included. The results mirror the per capita health benefits. Avoided wood combustion reductions are mostly upstate and New York City and Long Island impacts from reduced fossil fuel combustion are still high.
Discussion of Air Quality Health Benefits
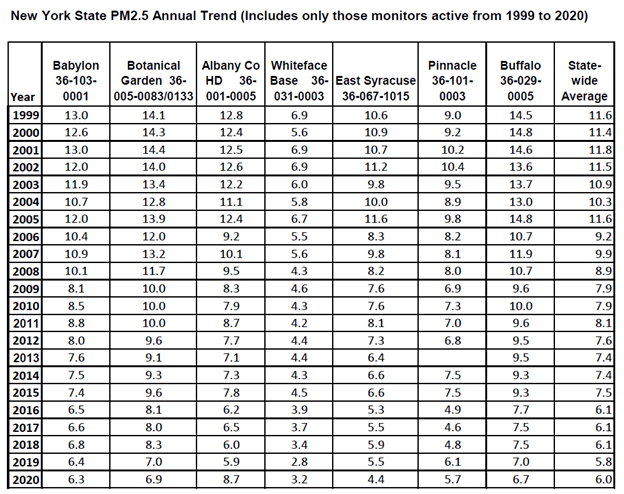
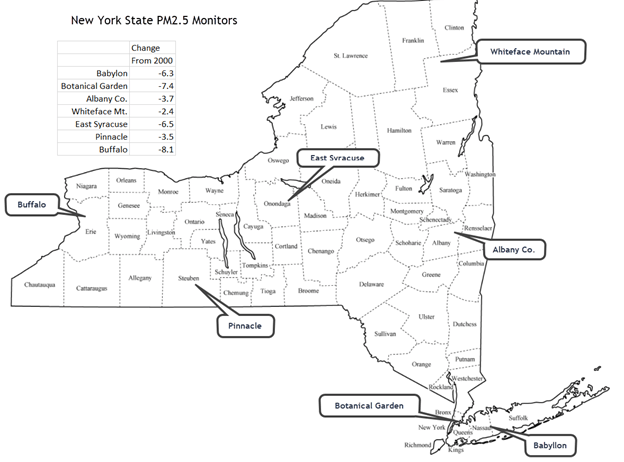
I looked into the air quality health benefits in detail in a previous post so I will not go into details here. The point of my previous analysis is that although Mas claims that there are “deep” reductions of PM2.5 concentrations by 2050 across the state, the highest possible reduction is 0.35 µg/m3. The following table shows that in 2020, the state-wide annual average using seven monitors that had data going back to 1999 was 6.0 µg/m3. In 2000, the average was 11.4 µg/m3 which is a reduction of 5.4 µg/m3. The COBRA health benefits model used here assumes that there is a linear relationship between health impacts and pollutant concentrations. The claimed $160 billion health benefits occur by preventing “tens of thousands premature deaths, thousands of non-fatal heart attacks, thousands of other hospitalizations, thousands of asthma-related emergency room visits, and hundreds of thousands lost workdays”. Using a linear relationship and an order of magnitude larger observed reduction of inhalable particulates between 2000 and 2020 then their model predicts that the observed reductions should have prevented, for example, millions of lost workdays. Until such time as NYSERDA can validate their modeling by showing that there were observed reductions of the purported health impacts between 2000 and 2020, I do not accept these results.
These health effects were discussed starting at 3:20:45 of the recording. There are two health benefits: people are healthier because they are walking or cycling and there are fewer traffic accidents. Mas went through these very quickly because of the schedule of the call so there wasn’t much explanation. He did note that they adapted a national model for New York State.
The next slide (3:21:26 of the recording) listed the results. The benefits accrue later in the implementation period as the active transportation policies get implemented.
Active Transportation Discussion
In a nutshell this benefit is based on programs that “encourage” personal transportation choices away from personal vehicles and then claims that it works out because it is good for you. These results are based on adapting a national model to New York. There is insufficient information to determine how they addressed winter. In the first place, walking and cycling in the winter is markedly more dangerous than other times of the year. In fact, both modes are so uncomfortable that it is likely that many people will fall back on personal vehicles in the winter. Both factors could reduce the benefits.
Energy Efficiency Health Benefits
The next slide (3:22:01 of the recording) introduced energy efficiency health effects. In order to conjure up these benefits NYSERDA used several studies instead of a model. The studies are not referenced in enough detail to access them and it appears that all are “grey” literature, that is to say have not been peer-reviewed. One of the references is from the American Council for an Energy-Efficient Economy who is a nonprofit research organization that “develops transformative policies to reduce energy waste and combat climate change.” They state that their “independent analysis” aims “to build a vibrant and equitable economy – one that uses energy more productively, reduces costs, protects the environment, and promotes the health, safety, and well-being of everyone.” They may be independent but they certainly are biased. As a result, there is every reason to expect that their estimates are likely high.
This research aligns with some of NYSERDA’s thinking about low- and moderate- consumers energy efficiency and fulfills the Climate Act requirements to target benefits to disadvantaged communities.
The next slide (3:23:35 of the recording) gives a breakdown of the benefits claimed. The predominate benefit is reduced asthma-related incidents. This is not from changes in the ambient air but due to improvements in the indoor air quality. This must mean that the proposed energy efficiency programs include ventilation air exchange components because airtight well-insulated building envelopes could increase indoor air concentrations.
The next slide (3:24:28 of the recording) shows that the benefits increase over time.
Energy Efficiency Benefits Discussion
I am leery of these claims. In the first place they are dependent upon research from organizations that are looking for particular answers. The energy efficiency component has to include an air exchange component to reduce asthma-related incidents that would increase as weatherization reduces infiltration. I have no idea how this strategy can reduce trip or fall injuries. Health benefits from reduced hot and cold thermal stress are claimed which makes sense. The final benefit is reduced CO poisonings presumably because combustion within homes is reduced. However, the integration analysis does not address how residents will keep warm when everything is electrified and there is an ice storm. A substantial number of the 151 deaths in the February 2021 Texas energy crisis died from CO poisoning trying to keep warm when they lost power.
Conclusion
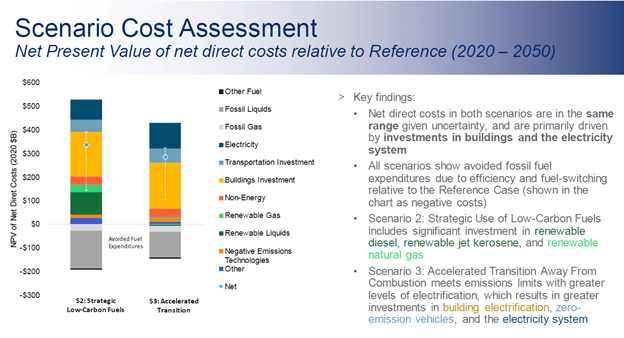
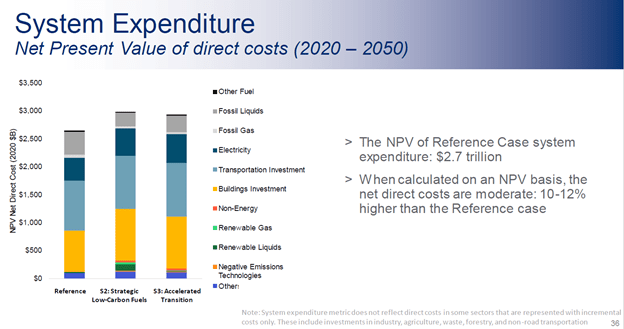
The intent of this post was to document the health benefits claimed in the integration analysis. Readers should keep in mind that the costs are real. Completely re-building the entire New York energy sector will cost $340 billion for the strategic use of low carbon fuels scenario. On the other hand, all the benefits claimed are societal benefits that cannot directly offset the personal costs to New Yorkers. In that regard the benefits claims are tone deaf. Mas noted that most of the impacts are experienced in state but “there are benefits to downwind states”. While those benefits may feel good the fact is that they do nothing to reduce the real costs to New Yorkers.
Furthermore, the benefit estimates of benefits are heavily dependent upon value judgements and analysis assumptions. The air quality health benefits analysis assumes there is a linear relationship between health outcomes and changes in inhalable particulate concentrations that should be verified using New York before anyone can accept the proposed benefits. There is insufficient information to evaluate the active transportation and energy efficiency benefit claims. In a previous post, I explained that the state policy for the value of carbon incorrectly accounts for benefits. As a result, I disagree with the ultimate claim that the societal benefits of the Climate Act emission reductions out-weigh the real costs.
I have written extensively on implementation of the CLCPA because I believe the ambitions for a zero-emissions economy outstrip available technology such that it will adversely affect reliability and affordability, will have worse impacts on the environment than the purported effects of climate change, and cannot measurably affect global warming when implemented. The opinions expressed in this post do not reflect the position of any of my previous employers or any other company I have been associated with, these comments are mine alone.
Developing a plan to transform the energy sector of the State of New York is an enormous challenge so the New York State Energy Research and Development Authority (NYSERDA) and its consultants are providing technical support to translate the recommended strategies into specific policy options in an integration analysis. An overview of the results of this integration analysis were presented to the Climate Action Council at the two October meetings. There is a notable lack of documentation available for the analysis so meaningfully reviewing the plan is difficult.
The integration analysis models the complete New York energy sector. The modeling includes a reference case that projects how the economy and energy sector will evolve out to 2050 in the absence of any Climate Act policies or mandates. The following slide from the first integration analysis presentation lists the four mitigation scenarios that were developed to compare with the reference case. The first simply developed energy strategies that implemented the advisory panel recommendations but the results showed that even more stringent policies were needed because the 2030 targets were not met. The second mitigation scenario meets the 2030 targets by using low-carbon fuels to meet the critical need for dispatchable resources to keep the lights on. The third scenario placates the members of the Climate Action Council that naively demanded that no combustion is necessary despite the lack of a proven technology that can keep the lights on in the worst-case scenarios. Because some members of the Climate Action Council are dupes who don’t appreciate the technological hurdles and risks to reliability of the transition to zero-emissions using renewable energy and have no personal accountability for recommending policies that put New York at risk of catastrophic blackouts, there is a fourth mitigation scenario that looks at options for eliminating combustion as much as possible as soon as possible.
Reliability
This article documents how the integration analysis addresses reliability. There is a long history of blackouts in New York State in general and New York City in particular that is a primary driver of reliability concerns in the state. In 1959 and 1961 surges in electrical use caused blackouts and changes were made to the New York City system to better protect the city’s power grid. The 1965 blackout was the first regional blackout and spurred New York’s investor-owned utilities to setup the New York Power Pool to coordinate the state’s electric grid. There was another blackout in 1977 that was limited to New York City directly related to the fact that most of New York City is on islands and is a load pocket. As a result of this blackout, reliability constraints were strengthened to ensure that when storms threaten transmission into the City that sufficient in-City generation is available to prevent a re-occurrence. In 2003 there was another regional blackout and grid operators developed procedures to prevent it from happening again. In 2012 tropical storm Sandy caused massive blackouts exacerbated by flood protection weaknesses. Since then, there have been investments to strengthen the infrastructure to prevent a reoccurrence. Reliability planning is a constant concern for the electrical system professionals who operate the system and are responsible for keeping the lights on. Because the system is so complex it is very difficult to anticipate all the things that might go wrong. Despite best efforts, however, the reality is that the primary mode of reliability improvement was in response to observed problems.
New York Reliability Planning
In response to stakeholder recommendations the New York State Energy Research and Development Authority held a Reliability Planning Speaker Session on August 2, 2021 for the edification of the Climate Action Council (presentation and recording). This section summarizes points made during that speaker session.
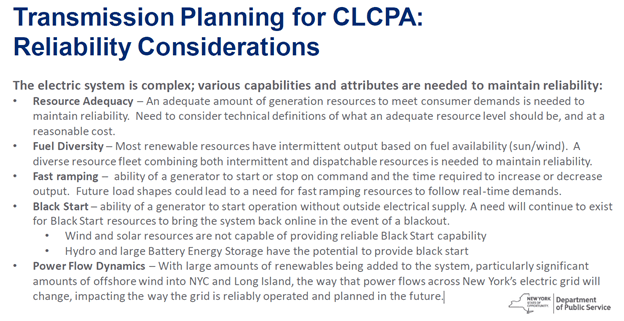
There are two independent organizations responsible for New York reliability: New York State Reliability Council (NYSRC) and New York State Independent Operator (NYISO). The NYSRC is a Federal Energy Regulatory Council (FERC) approved entity responsible for “the promulgation of reliability standards for New York, which are mandatory requirements for the New York Independent System Operator”. The Climate Action Council presentation included a slide describing what is needed to operate the electric system reliably. The takeaway message of the NYSRC to the Climate Action Council was:
With the intermittency of renewables and the electrification of the economy, substantial clean energy and dispatchable resources, some with yet to be developed technology, over and above the capacity of all existing fossil resources that will be replaced, will be required to maintain reliability in the transition to meeting CLCPA requirements.
For clarification, a dispatchable resource is a generator that can increase or decrease its output energy depending on the needs of the electric grid. The operators who manage the system balance the load and generation on a minute-by-minute basis. The critical future reliability challenge is how to manage this balancing act when there are large amounts of wind and solar energy resources that cannot be dispatched.
The NYISO Frequently Asked Questions webpage explains how the organization originated. After the Northeast Blackout of 1965, New York’s seven investor-owned utility companies established a predecessor organization, the New York Power Pool (NYPP), to address the reliability problems exposed by the blackout. In the 1990s New York’s electric system was de-regulated and the Federal Energy Regulatory Commission (FERC) recommended the formation of independent entities to manage energy transmission and the NYISO was established to replace the NYPP.
The NYISO manages the electric system. They operate the control center mentioned in the previous slide that balances the instantaneous supply of electricity between the generators and customers across the state in the de-regulated electricity market. In addition, the NYISO has to plan for future changes to the system and the biggest factor for change is the Climate Act. Their recent Power Trends 2021: New York’s Clean Energy Grid of the Future report describes how hourly demand patterns fluctuate diurnally and seasonally today and how they expect it will change in the future. One NYISO analysis projected future winter energy production by resource type and found that the worst-case future resource concern will be a winter-time wind lull. During those periods solar resources are low because days are short and the sun is at a low angle, and wind resources can be less than 25% of the wind capacity for seven days at a time. Consequently, there is a need for a large quantity of installed dispatchable energy resources needed for a small number of hours. They must be able to come on line quickly and be flexible enough to meet rapid and steep ramping needs. The problem is that no such zero-emissions resource has been deployed at the scale necessary to keep the lights on in New York.
In addition to these organizations, the New York State Department of Public Service (DPS) has oversight of utility reliability planning. This covers traditional transmission & distribution investment planning and the utilities’ obligation to “reliably serve forecasted customer loads”. There is a nuance to this that is not universally understood. This process is used to ensure adequate transmission and distribution capability to serve customers but the production of the electricity itself is not included. Instead, the wholesale market overseen by the NYISO provides the power. This nuance is usually neglected in the projections of future resources. If the market signals are not correct then New York could find itself without sufficient generating resources. Their summary of reliability considerations makes many of the same points addressed in the NYSRC and NYISO as shown in the following slide.
Integration Analysis
All three organizations conclude that dispatchable resources are a critical future necessity. The integration analysis prepared to support the development of the scoping plan that will modify New York’s energy system to meet the targets of the Climate Act includes a “zero-carbon firm resource” to fulfill the requirement for a zero-emissions dispatchable resource. In the integration analysis scenarios, the zero-carbon firm capacity resource is provided by 15 to 23 GW of hydrogen resources to meet multi-day reliability needs.
However, there is no mention in the presentation just how risky a proposition it is to rely on hydrogen resources. I documented the technological readiness of hydrogen for transport, storage, production and generation from the International Energy Agency (IEA) “Special Report on Clean Energy Innovation” report. Hydrogen is used as a raw material in the petrochemical industry so storage in tanks and transport in dedicated pipelines are mature technologies that New York can count on as part of the “firm capacity hydrogen resource”. However, the production and generation technologies are not as mature. The two higher rated generation technologies are rated as “First of a Kind Commercial – Commercial demonstration, full scale deployment in final form” in technological readiness. The next category of technical readiness is described as “Commercial Operation in Relevant Environment – Solution is commercially available, needs evolutionary improvement to stay competitive” so the likely generation technologies would need have to be successfully employed in a relevant commercial operation to get to the same level. There is one production technology that is rated at that readiness level. In order for the production and generation technologies to be considered a stable technology with predictable growth there have to be evolutionary improvements to stay competitive and even then, would need further integration efforts. Furthermore, I only evaluated technological feasibility and not costs or environmental impacts. There are plenty of concerns related to the hydrogen economy overlooked in the integration analysis that must be addressed in the scoping plan.
Reliability Risks
The integration analysis short-changes reliability. The Initial Results presentation includes the word reliability six times but never addresses the fact that the proposed critical firm dispatchable resource has not been employed on the scale needed to keep New York lights on. Overlooking the importance of reliability ignores experiences elsewhere where renewable resource integration issues led to blackouts. There was a short blackout in Great Britain associated with a very short-term spike in resources. California is having trouble dealing with the diurnal variation of renewable resources that have resulted in rolling blackouts. Finally, Texas had a catastrophic blackout because they didn’t provide a strong enough market signal for resources needed for an extreme cold event accompanied with calm winds.
Great Britain
In August 2019, there was an unusual set of circumstances in Great Britain that led to a short blackout for 1.1 million customers. According to the interim report summary describing the incident:
Prior to 4:52pm on Friday 9th August 2019, Great Britain’s electricity system was operating as normal. There was some heavy rain and lightning, it was windy and warm – it was not unusual weather for this time of year. Overall, demand for the day was forecast to be similar to what was experienced on the previous Friday. Around 30% of the generation was from wind, 30% from gas and 20% from Nuclear and 10% from interconnectors.
At 4:52pm there was a lightning strike on a transmission circuit (the Eaton Socon – Wymondley Main). The protection systems operated and cleared the lightning in under 0.1 seconds. The line then returned to normal operation after c. 20 seconds. There was some loss of small embedded generation which was connected to the distribution system (c. 500MW) due to the lightning strike. All of this is normal and expected for a lightning strike on a transmission line.
However, immediately following the lightning strike and within seconds of each other:
Hornsea off-shore windfarm reduced its energy supply to the grid
Little Barford gas power station reduced its energy supply to the grid
The total generation lost from these two transmission connected generators was 1,378MW. This unexpected loss of generation meant that the frequency fell very quickly and went outside the normal range of 50.5Hz – 49.5Hz.
The ESO was keeping 1,000MW of automatic “backup” power at that time – this level is what is required under the regulatory approved Security and Quality of Supply Standards (SQSS) and is designed to cover the loss of the single biggest generator to the grid.
All the “backup power” and tools the ESO normally uses and had available to manage the frequency were used (this included 472MW of battery storage). However, the scale of generation loss meant that the frequency fell to a level (48.8Hz) where secondary backup systems were required to disconnect some demand (the Low Frequency Demand Disconnection scheme) and these automatically kicked in to recover the frequency and ensure the safety and integrity of the network
This system automatically disconnected customers on the distribution network in a controlled way and in line with parameters pre-set by the Distribution Network Operators. In this instance c. 5% of GB’s electricity demand was turned off (c. 1GW) to protect the other 95%. This has not happened in over a decade and is an extremely rare event. This resulted in approximately 1.1m customers being without power for a period.
The disconnection of demand along with the actions of the ESO Control Room to dispatch additional generation returned the system to a normal stable state by 5:06pm. The DNOs then commenced reconnecting customers and supply was returned to all customers by 5:37pm.
On October 25, 2021 the New York Independent System Operator (NYISO) released the draft 2021-2030 Comprehensive Reliability Plan that is part of the New York reliability planning process. This report notes that “Substantial zero-emission dispatchable resources will be required to fully replace fossil generation”. It goes on to explain that the grid in transition will have to address the following problem:
Most renewable generators will be connected to the grid asynchronously through power electronic devices (i.e., inverter-based resources). The ability of inverter-based resources to function properly often depends on the strength of the grid at or near the interconnection of the resources. Grid strength is a commonly used term to describe how the system responds to system changes (e.g., changes in load, and equipment switching). In a “strong” system, the voltage and angle are relatively insensitive to changes in current injection from the inverter-based resource. Inverter-based resources connecting to a portion of the system rich in synchronous generation that is electrically close or relatively large are likely connecting to a strong portion of the system. Inverter-based resources connected to a “weak” portion of the grid may be subject to instability, adverse control interactions, and other issues.
I believe this concern is related to the blackout in Great Britain described above. There is no indication in the integration analysis documentation that they have addressed this requirement.
The climate change-induced extreme heat storm across the western United States resulted in the demand for electricity exceeding the existing electricity resource planning targets. The existing resource planning processes are not designed to fully address an extreme heat storm like the one experienced in mid-August.
In transitioning to a reliable, clean and affordable resource mix, resource planning targets have not kept pace to lead to sufficient resources that can be relied upon to meet demand in the early evening hours. This makes balancing demand and supply more challenging. These challenges were amplified by the extreme heat storm.
Some practices in the day-ahead energy market exacerbated the supply challenges under highly stressed conditions.
In a nutshell the CAISO did not plan well enough. Although CAISO is supposed to be independent, they very likely operate under intense political scrutiny and pressure like the New York Independent System Operator. The first reason uses the excuse that climate change contributed is, in my opinion, weak because heat storms are not a new type of weather and every analysis of supposed climate change induced events that I have evaluated turned out to be weather and not climate. If their analysis had correctly accounted for past observed events and had included a tweak of increased temperature for climate change, then their resource planning should have been able to address the heat storm. In addition, electrical load is a factor not only of weather extremes but also changes in electrical use. I suspect that the effect of additional load is greater than the effect of climate change.
The second reason probably is the fundamental cause. I suspect that political pressure forced it to be listed second. In the context of New York’s Climate Act push to use renewables the key point is that “resource planning targets have not kept pace to lead to sufficient resources that can be relied upon to meet demand in the early evening hours”. The Climate Act integration analysis is not refined enough to provide any assurance that their proposed resource mix will prevent this kind of problem. If New York resource planning does not account for all the variables associated with the transition to zero-emissions generation, then the same problems observed in California will happen in New York.
Texas
Severe winter weather in Texas in February 2021 caused at least 151 deaths, property damage of $18 billion, and higher costs of $50 billion for electricity over normal prices during the storm. I do not believe that the 2021 Texas energy debacle was caused by the lack of wind and solar resources but the fact is that they were not available when needed most. The situation does foreshadow the difficulty providing reliable electricity in a system that depends on renewables when the wind isn’t blowing at night. The primary cause for the blackouts was a lack of planning manifested by an electric market that only pays for the energy produced. As a result, there was no incentive to develop the capacity needed for rare extreme conditions so when it was needed it simply was not there. Both Federal and Texas policy prioritized and subsidized unreliable energy sources (wind and solar) at the expense of reliable ones (natural gas, coal and nuclear) for decades and this was a contributing factor. The problem that New York has to address to avoid a similar problem is that the coldest air of the winter and the highest demand occurs when Arctic air moves in behind a cold front. This frigid air is associated with a cold core high pressure system pushing the front. Those high-pressure systems have very little wind and, in the winter, there is little solar energy available in the best case and none when panels are covered with snow.
The importance of this issue has been highlighted by the Analysis Group Climate Change Impact and Resilience Study and similar work by E3 for the Climate Action Council implementation process. Both have found that a winter-time wind lull is the critical planning criterion and both note that a resource category that provides firm, dispatchable and zero-emissions generation is needed when wind and solar resources are low or non-existent. In my opinion no one has done an adequate job evaluating historical weather data to determine the likely worst-case scenario for low renewable resource availability and I have recommended a technique that would provide an assessment of the frequency, duration, and intensity of those renewable resource droughts. Until that or something similar is done then the assessments are not adequate and a blackout similar to the Texas event is inevitable.
Conclusion
Despite numerous appeals for an increased emphasis the Climate Act process is short-changing reliability concerns. The Climate Act mandated advisory panels provided aspirational recommendations and the integration analysis has converted them into policy options. So far, the Climate Action Council has not stepped up and asked if the proposed policy options are technologically feasible for maintaining current reliability levels, much less whether the costs and environmental impacts are acceptable.
The integration analysis states that hydrogen resources will provide the reliability resource support necessary to keep the lights on, but offer no documentation why this technology should be trusted. Based on the IEA technology assessment I do not believe that hydrogen resources or any other technology available at this time is zero-emissions, able to come on line quickly, and flexible enough to meet rapid and steep ramping requirements. Until clean energy innovation has produced technologies that are proven to work as needed with those characteristics it is premature to chase the aspirational goal of net-zero emissions without risking our current reliability standards.
I have written extensively on implementation of the CLCPA because I believe the ambitions for a zero-emissions economy outstrip available technology such that it will adversely affect reliability and affordability, will have worse impacts on the environment than the purported effects of climate change, and cannot measurably affect global warming when implemented. The opinions expressed in this post do not reflect the position of any of my previous employers or any other company I have been associated with, these comments are mine alone.
Clean Energy Innovation Background
The IEA “Special Report on Clean Energy Innovation” report concludes that innovation is necessary for jurisdictions and companies to fulfill their de-carbonization targets and lists the current status of many potential technologies. The IEA website describing this report explains why innovation is necessary and the magnitude of the effort needed to decarbonize and the innovation necessary to make it work. The Energy Transition Plan Clean Energy Technology Guide is a useful summary of around 400 component technologies and identifies their stage of readiness for the market. It includes an interactive section where you can choose a sector, various filters and get a summary of the readiness of different technologies. There also is a poster that you can download to see similar information. IEA uses the technology readiness level (TRL) scale to assess where a technology is on its journey from initial idea to market use that I used to assess the status of some the necessary technology needed for Climate Act implementation.
Climate Act Background
Implementation for the Climate Act implementation began soon after the law became effective in January 2020. The law established the Climate Action Council whose charge was to develop a scoping plan to meet the targets. The Council was supported by seven advisory panels who between late summer 2020 and spring 2021 developed strategies for the required emission reductions. Last summer they were turned into specific policies by the New York State Energy Research & Development Authority (NYSERDA) and its consultant by using an economy-wide energy model that quantifies emissions and costs. The results from the integration analysis are being incorporated into the draft scoping plan so that the scoping plan can be finalized by the Climate Action Council by the end of the year. Next year the public and other stakeholders will get to comment on the scoping plan.
In recent Climate Action Council meetings (October 1, 2021 and October 14, 2021), the initial results of the integration analysis were presented. The integration analysis compares the model output for a reference case that estimates emissions and costs assuming no Climate Act policies with four scenarios that incorporate different emission reduction strategies. The results presentation described specific recommended strategies and provided the first inkling of the costs and alleged benefits. I am convinced that most New Yorkers have no idea what is included in the state’s plan to do “something” about climate change.
Renewable Resource Reliability Concern
One of the problems with the politicized structure of the Climate Action Council is that very few of the people appointed to develop recommendations for the scoping plan have the background and experience to understand the enormity of the technological challenges to the energy system transition away from fossil fuels. They have been lulled into a false sense of security by the renewable energy grifters on the panels and fear of retribution if concerns are raised from the entities charged with maintaining a reliable electric system, I believe there are real risks of catastrophic system-wide blackouts. If you look there are hints that the transition path is not without peril.
On October 25, 2021 the New York Independent System Operator (NYISO) released the draft 2021-2030 Comprehensive Reliability Plan that is part of the New York reliability planning process. While this report only runs out to 2030 the report also includes a section on the reliability and resiliency challenges further out:
Looking ahead to 2040, the policy for an emissions-free electricity supply will require the development of new technology. Substantial zero-emission dispatchable resources will be required to fully replace fossil generation.
The new technology is some form of zero-emission dispatchable generating. Electric system grid operators have to balance load and generating resources on a minute-by-minute basis. It is always a challenge but as long as the operators have generating resources that they can dispatch (that is to say increase or decrease generation on demand) to match the load then the fact that large blackouts are very rare proves that they are doing a good job.
The existing system has enough dispatchable resource availability to balance the system at this time but the Comprehensive Reliability Plan describes one of the problems, albeit in technical terms, that the grid in transition will have to address:
Most renewable generators will be connected to the grid asynchronously through power electronic devices (i.e., inverter-based resources). The ability of inverter-based resources to function properly often depends on the strength of the grid at or near the interconnection of the resources. Grid strength is a commonly used term to describe how the system responds to system changes (e.g., changes in load, and equipment switching). In a “strong” system, the voltage and angle are relatively insensitive to changes in current injection from the inverter-based resource. Inverter-based resources connecting to a portion of the system rich in synchronous generation that is electrically close or relatively large are likely connecting to a strong portion of the system. Inverter-based resources connected to a “weak” portion of the grid may be subject to instability, adverse control interactions, and other issues.
A full explanation of the electric grid is beyond the scope of this article but if you want more information here is a summary. In brief, this paragraph’s concern about synchronicity is related to the fact that all generators connected are synchronized. “Synchronous” generators create electricity by spinning a magnet in a coil of wire. The strength of the system in the description basically refers to the spinning inertia of all the generators producing power. As long as there are a lot of them then the system is “strong”. Wind and solar generators produce electricity for the grid through an inverter so are asynchronous and do not provide any ancillary support services for the grid. As more and more wind and solar are added this disadvantage increases and at some point, there will not be enough inertia among other things to keep the grid stable. Importantly, no one knows at what point the grid will become so unstable that safety mechanisms trip out a “weak” region to prevent problems elsewhere.
In addition to the ancillary support concerns renewable energy is intermittent. One New York Independent System Operator (NYISO) analysis projected future winter energy production by resource type and found that the worst-case future resource concern will be a winter-time wind lull. During those periods solar resources are low because days are short and the sun is at a low angle, and wind resources can be less than 25% of the wind capacity for seven days at a time. Consequently, there is a need for a large quantity of installed dispatchable energy resources needed for a small number of hours. They must be able to come on line quickly and be flexible enough to meet rapid and steep ramping needs.
The integration analysis prepared to support the development of the scoping plan that will modify New York’s energy system to meet the targets of the Climate Act includes a “zero-carbon firm resource” to fulfill that requirement. The integration analysis projects that between 14.6 GW and 20.7 GW of this resource will be needed in the future. The integration analysis states that “firm capacity is provided by hydrogen resources to meet multi-day reliability needs, ranging from 15 to 23 GW”
IEA Hydrogen Resources Readiness
This section describes the readiness of hydrogen resources for this firm capacity resource. The integration analysis lacks detailed documentation. The only reference to the plan to use hydrogen resources is that it will be the source of the firm capacity to meet reliability needs. As a result, it is necessary to make some guesses about the technologies that could be used.
The first issue is the readiness of the hydrogen resources as described in the Energy Transition Plan Clean Energy Technology Guide. I extracted the hydrogen resources from that guide into a table, Hydrogen Technology Readiness Level. The IEA Guide groups technology into four categories: production, storage, transport, and generation and estimates readiness level on an 11-category scale.
There are fourteen production technologies listed. I assume that the only CLCPA acceptable technology is electrolysis using excess electricity produced by wind and solar generating resources. There are four electrolysis technologies: seawater electrolysis, solid oxide electrolyser cell, polymer electrolyte membrane, and alkaline. Given that off-shore wind is supposed to account for 17-20 GW of capacity in the future integration analysis scenarios seawater electrolysis might be an option but it is only at the “Concept Needs Validation – Solution needs to be prototyped and applied” readiness level. The solid oxide electrolyser cell is at the “Pre-Commercial Demonstration – Solution working in expected conditions” readiness level. Hydrogen production using the polymer electrolyte membrane technology is rated at the “First of a Kind Commercial – Commercial demonstration, full scale deployment in final form” readiness level. The alkaline electrolysis production technology is the highest rated technology described as “Commercial Operation in Relevant Environment – Solution is commercially available, needs evolutionary improvement to stay competitive”. Note, however, that before this technology can be considered a stable technology with predictable growth that it needs evolutionary improvement to stay competitive and even then, would need to further integration efforts.
There are three storage technologies listed: depleted oil & gas field, aquifer, salt cavern storage, and storage tanks. The depleted oil & gas field, aquifer and salt cavern storage technologies are only available where there is an appropriate geological formation so there are limitations on availability. The remaining technology option, tank storage is rated “Proof of Stability Reached – Predictable growth” which means that the technology can be relied on for hydrogen storage.
There are four transport technologies listed: hydrogen blending in natural gas network, liquid hydrogen tanker, liquid organic-hydrogen carrier tanker, and pipeline. I assume that the liquid hydrogen tanker and liquid organic-hydrogen carrier tanker technologies will not be used. I have heard suggestions that hydrogen blending in natural gas network could be used because it would reduce the infrastructure development requirements. However, its technical readiness level is “Pre-Commercial Demonstration – Solution working in expected conditions” which is a long way from a dependable technology. Fortunately, pipelines are rated “Proof of Stability Reached – Predictable growth” so they can be used albeit they would require a new pipeline network.
There are eight generation technologies listed. I assume that only the high-temperature fuel cell, hybrid fuel cell-gas turbine system, and hydrogen gas-fired turbine technologies would be considered. Both the high-temperature fuel cell technology and hydrogen gas-fired turbine are rated as “First of a Kind Commercial – Commercial demonstration, full scale deployment in final form”. The hybrid fuel cell-gas turbine system is rated “Full Prototype at Scale – Prototype prove at scale in conditions to be deployed”.
Hydrogen is used as a raw material in the petrochemical industry so storage in tanks and transport in dedicated pipelines are mature technologies that New York can count on as part of the “firm capacity hydrogen resource”. However, the production and generation technologies are not as mature. The two higher rated generation technologies are not as ready as the highest rated production technology and would have to be successfully employed in a relevant commercial operation to get to the same level. All the technologies cannot be considered a stable technology with predictable growth until there are evolutionary improvements to stay competitive and even then, would need further integration efforts.
“Without a major acceleration in clean energy innovation, net-zero emissions targets will not be achievable. The world has seen a proliferating number of pledges by numerous governments and companies to reach net-zero carbon dioxide (CO2) emissions in the coming decades as part of global efforts to meet long-term sustainability goals, such as the Paris Agreement on climate change. But there is a stark disconnect between these high-profile pledges and the current state of clean energy technology. While the technologies in use today can deliver a large amount of the emissions reductions called for by these goals, they are insufficient on their own to bring the world to net zero while ensuring energy systems remain secure – even with much stronger policies supporting them”.
The integration analysis states that hydrogen resources will provide the reliability resource support necessary to keep the lights on, but offer no documentation why this technology should be trusted. Based on the IEA technology assessment I do not believe that hydrogen resources or any other technology is available at this time that is zero-emissions, able to come on line quickly and flexible enough to meet rapid and steep ramping requirements. Until clean energy innovation has produced technologies that are proven to work as needed with those characteristics it is premature to chase the aspirational goal of net-zero emissions without risking our current reliability standards. Furthermore, I have only discussed technological feasibility and not costs or environmental impacts. There are plenty of concerns related to the hydrogen economy overlooked in the integration analysis that must be addressed in the scoping plan.
I have written extensively on implementation of the CLCPA because I believe the ambitions for a zero-emissions economy outstrip available technology such that it will adversely affect reliability and affordability, will have worse impacts on the environment than the purported effects of climate change, and cannot measurably affect global warming when implemented. The opinions expressed in this post do not reflect the position of any of my previous employers or any other company I have been associated with, these comments are mine alone.
Developing a plan to transform the energy sector of the State of New York is an enormous challenge so the New York State Energy Research and Development Authority (NYSERDA) and its consultants are providing technical support to translate the recommended strategies into specific policy options. The results of this integration analysis were presented to the Climate Action Council in two October meetings.
The integration analysis models the complete New York energy sector. It includes a reference case that projects how the economy and energy sector will evolve out to 2050 in the absence of any Climate Act policies or mandates. The following slide from the first integration analysis presentation lists the four mitigation scenarios that were developed to compare with the reference case. The first simply developed energy strategies that implemented the advisory panel recommendations but the results showed that even more stringent policies were needed because the 2030 targets were not met. The second mitigation scenario meets the 2030 targets by using low-carbon fuels to meet the critical need for dispatchable resources to keep the lights on. The third scenario placates the members of the Climate Action Council that naively demanded that no combustion is necessary despite the lack of a proven technology that can keep the lights on in the worst-case scenarios. Because some members of the Climate Action Council are dupes who don’t appreciate the technological hurdles and risks to reliability of the transition to zero-emissions using renewable energy and have no personal accountability for recommending policies that put New York at risk of catastrophic blackouts, there is a fourth mitigation scenario that looks at options for eliminating combustion as much as possible as soon as possible.
Costs
It is difficult to describe the cost calculations in any detail because the documentation consists of a power point presentation and an appendix with a few other slides. The description of the cost categories (discussed at 1:29:40 in the recording) in the following slide are all I had available to try to understand their estimates. For example, the description of electricity system states that it “Includes incremental capital and operating costs for electricity generation, transmission (including embedded system costs), distribution systems, and in-state hydrogen production costs”. It is impossible to evaluate what they mean by this generalization and the only breakdown of these costs is in a graph so resolving specific costs per category is only an approximation.
The scenario cost assessment (discussed at 1:31:26 in the recording) presents the net present value of net direct costs relative to the reference case over the years 2020 to 2050. Keep in mind that the strategies propose to electrify everything possible and that means that the electric needs of homes will be much higher than today. Also consider that much of the electric system is in need of upgrade and replacement even without the Climate Act and that will require substantially more revenue. In the example, electricity system costs include “incremental capital and operating costs” for distribution systems. There is no documentation available to see what they assumed in the reference case relative to the incremental additional costs.
The following slide compares the costs of Scenarios 2 and 3. Each bar on the left consists of the total net costs (values above zero) and the fuel savings (values below zero). The costs for each category are the incremental costs, for example the higher cost of a heat pump relative to the cost of a gas furnace. There is a blue diamond on the bar that represents the difference between the net costs and fuel savings and that is the value they list elsewhere for the costs. The brackets around the diamond are their uncertainty ranges. The key findings on the right are self-explanatory. Note that the major difference between the scenario 2 and scenario 3 costs is the expenditures necessary to produce the renewable fuels.
The next slide (discussed at 1:35:00 in the recording) lists the Scenario 2, strategic use of low-carbon fuels, annual net direct costs. In the early years the net direct costs are on the order of $10 billion per year, equivalent to 0.6% of GSP in 2030. In the later years the costs are on the order of $50 billion per year, equivalent to 2.0% of GSP in 2050. There is a similar slide for Scenario 3.
The next slide shown here (discussed at 1:37:25 in the recording) compares the annual direct system expenditure costs for scenarios 2 and 3 relative to current direct costs. The slide claims that the change in direct costs over time is “moderate” relative to total system expenditure in 2030 and 2050 because the system expenditure costs in 2030: are only 7.1 – 8.6% higher and in 2050 are only 24 – 27% higher. The presentation argues that the changes are primarily a re-orientation away from fossil fuel infrastructure to the zero-emissions infrastructure and that is the “larger part of the story”.
The final slide in the cost presentation (discussed at 1:38:58 in the recording) looks at the cumulative costs over the period 2020 to 2050. According to this analysis over the 30 years New York has to invest $2.7 trillion dollars to make sure that our houses are “keeping us warm” and that our vehicles can “move us from point A to point B” so we have to invest that money no matter what we do. The integration analysis claims that the net direct costs to invest in the zero-emissions transition is merely a 10-12% adder to the energy system costs.
Summary and Conclusion
There is insufficient information to evaluate whether the cost projections withstand scrutiny. In order to estimate the costs of technology that does not exist at scale there has to be a wide range of possibilities. Slide 87 in the October 14, 2021 presentation to the Climate Action Council discusses technical cost sensitivity. It notes that the “Integration Analysis includes sensitivity on cost for key demand side technologies, meant to represent an ‘innovation’ world view in which these technologies achieve significant price declines relative to reference case forecast”. As an example, they note that this “includes a 20% decrease in price for heat pumps, electric vehicles”. Given that electric car prices are getting more expensive because battery costs are increasing as lithium supplies are strained and many other jurisdictions are also implementing net-zero programs which will strain supplies further, I think that the 20% decrease in electric vehicle prices forecast is unlikely to verify. My impression is that these cost estimates are biased low as a result.
The total system expenditures over the period 2020 to 2050 predicted for the reference case are $2.7 trillion and the cost with the re-oriented Climate Act expenditures is roughly $3 trillion so the integration analysis claims that the implementation costs are only $340 billion. However other analysts predict higher costs for electrification. For example, the Energy & Environment Legal Institute (E&E Legal) state-by-state report on the capital cost associated with “electrification” for states and the nation. The report, and its accompanying data spreadsheet, gives a different picture for New York. It estimates that in order to convert the entire economy to use electricity as a fuel the estimated costs are $119 billion to go to 100% renewable electricity; $208 billion for the transportation sector; $320 billion for direct use infrastructure; $63 billion for households; $541 billion for commercial buildings; $181 billion for on-road vehicles; and $34 billion for off road vehicles, for a grand total of $1.465 trillion. The integration analysis projections are net relative to the difference between a zero-emissions alternative relative to existing technology but without their assumptions we cannot make a direct comparison with this analysis.
The integration analysis cost estimates for Scenarios 2 and 3 are roughly the same. Scenario 2 net present value costs over the period 2020 to 2050 are $340 billion. In the early years the net direct costs are on the order of $10 billion per year, equivalent to “only” 0.6% of GSP in 2030. What is not mentioned is that works out to $170 per month for a family of four. In the later years the costs are on the order of $50 billion per year, equivalent to 2.0% of GSP in 2050 and that works out to $850 per month for a family of four.
On October 26,2021, the AP-NORC Center and the Energy Policy Institute at the University of Chicago (EPIC) released the results of a survey that claimed that a majority of Americans regard climate change as a problem of “high importance”. It also included survey questions asking whether respondents would support, oppose, or neither support or oppose a law that imposed “a fee on carbon to combat climate change”. The survey question asked “If the law passed, it would increase the average amount your household pays each month for energy, including electricity, heating gas, and gasoline or diesel for your car by a total of X dollars per month” where respondents were randomly assigned a $1, $10, $20, $40, $75, or $100 cost increase. For a $1 per month increase, 45% would support, 30% would oppose, and 25% would neither support or oppose. For a $100 per month increase, 20% would support, 62% would oppose, and 18% would neither support or oppose. I can only conclude that $170 per month for a household in the early years of the Climate Act would be opposed by an even greater margin and that the $850 per month cost increase would be universally opposed.
The presentation discussion downplays the cost increases for the transition as simply a modest investment above our business-as-usual expenditures. However, when put in terms of personal reference the extraordinary costs are startling. Furthermore, the fact is that the business-as-usual expenditures have a proven track record providing safe and reliable energy. On the other hand, the zero-emissions technologies proposed are unproven. As far as I can tell, they may work most of the time but there are serious concerns whether they will work when needed the most. Until the technology catches up with the reality of a zero-emissions transition it is foolhardy to proceed as planned given these eye-watering costs.
Recent presentations on the integration analysis strategies to meet the Climate Leadership and Community Protection Act (Climate Act) targets are providing insight into the impacts on personal choice and costs necessary to meet the so-called “net-zero” goals. There is a lot of information in the presentations and it takes effort to unpack what they are saying, why they are saying it and how they came to their recommendations. This post looks at one aspect of the alleged benefits of the Climate Act and its implications for the public.
I have written extensively on implementation of the CLCPA because I believe the ambitions for a zero-emissions economy outstrip available technology such that it will adversely affect reliability and affordability, will have worse impacts on the environment than the purported effects of climate change, and cannot measurably affect global warming when implemented. The opinions expressed in this post do not reflect the position of any of my previous employers or any other company I have been associated with, these comments are mine alone.
Background
Implementation for the Climate Act implementation began soon after the law became effective in January 2020. The law established the Climate Action Council whose charge was to develop a scoping plan to meet the targets. The Council was supported by seven advisory panels who between late summer 2020 and spring 2021 developed strategies for the required emission reductions. Over the summer they were turned into specific policies by the New York State Energy Research & Development Authority (NYSERDA) and its consultant by using an economy-wide energy model that quantifies emissions and costs. The results from the integration analysis are being incorporated into the draft scoping plan in October so that the scoping plan can be finalized by the Climate Action Council by the end of the year. Next year the public and other stakeholders will get to comment on the scoping plan
In recent Climate Action Council meetings (October 1, 2021 and October 14, 2021), the initial results of the integration analysis were presented. The analysis compares the model output for a reference case that estimates emissions and costs assuming no Climate Act policies with four scenarios that incorporate different emission reduction strategies. The results presentation described specific recommended strategies and provided the first inkling of the costs and alleged benefits. I am convinced that most New Yorkers have no idea what is included in the state’s plan to do “something” about climate change. This article addresses the primary driver of the health benefits – inhalable particulates or PM2.5.
Claimed Inhalable ParticulateHealth Benefits
The integration analysis included health co-benefits analysis to estimate and quantify health benefits of mitigation scenarios relative to a reference case. They did a county level analysis using EPA’s CO Benefits Risk Assessment (COBRA) Health Impacts Screening and Mapping Tool customized with detailed inputs specific to NYS and the pathways scenarios analyzed. The model projects ambient air quality based on SO2, VOC, NOX , and direct PM2.5 emissions and the ensuing changes in annual PM2.5 concentrations from 2020 to 2050. The results include 12 different health outcomes, such as premature mortality, heart attacks, hospitalizations, asthma exacerbation and emergency room visits, and lost workdays.
I cannot over-emphasize the point that modeling inhalable particulates air quality is a challenge. In addition to direct PM2.5 emissions from a wide range of sources these particles also form as a byproduct of reactions in the atmosphere. As a result, a large area that includes upwind sources has to be analyzed and that means transport becomes complicated. As a result of these complexities and a lack of verification studies I am suspicious of the results.
The presentation on October 14, 2021 (meeting recording at 3:00:00) claimed that:
Decarbonization of New York can result in a substantial health benefit from improved air quality, on the order of $50 –$120 billion from 2020 to 2050 (based on reduced mortality and other health outcomes).
Benefits would be experienced throughout the state and downwind of the state in
neighboring states.
Benefits of reduced fossil fuel combustion are higher in urban areas due to both higher emissions and larger impacted population.
Benefits of reduced wood combustion are higher in upstate areas
Annual benefits grow over time as pollution rates decrease.
The presentation also claimed that air quality improvements can avoid:
Tens of thousands premature deaths
Thousands of non-fatal heart attacks
Thousands of other hospitalizations
Thousands of asthma-related emergency room visits
Hundreds of thousands lost workdays
The integration analysis modeling monetizes the air quality improvements over the period 2020 to 2050 to come up with the $50 –$120 billion claimed health benefits. The components of the benefits are described in the following slide (meeting recording at 3:06:43). It shows that the two largest sources of benefits are coming from “benefits of all other reduced combustion (downstate)” and “benefits of reduced wood combustion (upstate)”. The integration analysis develops strategies to meet the targets but it does not specify how regulations will be written to implement them. In order to realize those benefits upstate home heating with wood has to be replaced by electrification and energy efficiency effectively banning wood heating. Policy options could include a wood burning prohibition mandate or they could assume that their electrification and energy efficiency solutions are so wonderful that everyone will willingly convert. Authors could also believe that the efficiency of wood-burning furnaces could be improved so much that the impacts will be reduced. In practice, however, getting any combustion source “tuned” to minimize emissions is an operator challenge and I think it is unlikely that owners will take the time and effort to master that skill.
New York Inhalable Particulate Trends
Over the past 30 years there has been a remarkable decline in SO2, VOC, NOX, and direct PM2.5 emissions and the observed annual average inhalable particulate concentrations at seven locations across the state have declined in response as shown below. Inhalable particulate monitoring started in the late 1990’s but since 2000 the annual averages have dropped between 30% and 60%. These reductions are mostly due to decreased SO2 and NOX emissions caused by the Acid Rain Program and ozone reduction programs.
New York State PM2.5 Trends
Inhalable Particulate Emissions and Benefits Projections
The integration analysis presentation (meeting recording at 3:08:26) includes the following slide that describes where the emissions are coming from that provide the alleged benefits. The key point here is that the modeling projects that roughly three quarters of the expected inhalable particulate emissions in 2025 come from commercial and residential wood burning and industrial wood burning is another big chunk. According to Carl Mas “It is not that we are burning a lot of wood, it is that it is very dirty when it is burned”.
Not surprisingly, the projected health benefits by sector analysis comes to the conclusion that if there was no wood combustion there would be benefits. This provides the benefit justification to offset the costs for the electrification, home energy efficiency, and wood stove energy efficiency strategies.
Inhalable Particulate Air Quality Projections
The integration analysis presentation (meeting recording at 3:17:42) presents the PM2.5 air quality projections that drive the benefits analysis. Carl Mas claims that we are getting “deep” reductions of inhalable particulates across the whole state but the highest annual average value is no greater than 0.35 µg/m3. That is a pretty small concentration that I suspect, but could not document, is near the precision of the monitoring system.
It is also informative to compare the predicted decrease in inhalable particulate concentration resulting from the Climate Act strategies to the observed decrease from 2000 to 2020. As shown in the following figure where I inserted the observed decreases from the seven PM2.5 ambient monitoring stations used before, all but one of the monitoring sites observed a PM2.5 decrease a factor of ten greater than the largest predicted reduction. On average, the observed reduction between 2000 and 2020 was fifteen times greater than the predicted future decrease.
Discussion
The EPA’s relationship between inhalable particulates and health benefits, as exemplified by the COBRA model, has been used as the primary benefit-cost rationale for many air quality regulations. At this time New York state is in compliance with the inhalable particulate national ambient air quality standard which is the legally enforceable mechanism to protect human health. These projections claim that there is no threshold for health impacts and that there is a linear relationship between health impacts and ambient concentrations. For example, in September, 2011 US EPA Administrator Lisa Jackson testified to Congress that fine particles kill hundreds of thousands of people in America every year, a claim based on EPA epidemiology and extrapolated projections. However, Enstrom tested the validity of this relationship and found no effect of fine particulates. Nonetheless, these results have been used for years to justify regulations and legislation and from the basis of these Climate Act benefits.
In order to convince me that the relationship used to predict these benefits is correct I need to see verification of the health benefits with a reduction in inhalable particulate concentrations. In order to do the verification correctly, the EPA Environmental Benefits Mapping and Analysis Program should be used. That model uses similar health outcome predictions to COBRA but uses observed air quality changes as its input. The linear model used to project the health benefits should show proportional impacts to the integration analysis projections. If that relationship is correct then there should be observable reductions (on the order of 15 times great than the integration analysis predictions) in all the health outcomes used.
Conclusion
I do not accept the linear no-threshold model for air pollution health analysis mostly because the National Ambient Air Quality Standards are based on a threshold approach. Consider this example as an illustration of my cynicism. No one questions the fact that prolonged exposure to wood smoke can cause health problems. I have no doubt that there are health studies that have conclusively shown that at high pollution levels people have contracted cancer. For the sake of argument, assume that the health studies have found that wood smoke at a continuous dose of 100 ppm for one year causes cancer. The linear no-threshold model can extrapolate that dose response down to 0.00019 ppm per minute. Using that extrapolation relationship, if 5,256 people sitting around campfires were exposed to the 100-ppm dose for one minute then linear no-threshold models claim one of them will get cancer from that dose. Anyone who has sat around a campfire probably has been downwind of the smoke and received a dose of wood smoke. It does not matter what the actual health impact dose response rate is, if you extrapolate that down to the dose of people sitting around a campfire and multiply that by all the people sitting around campfires the linear no-threshold model predicts an impact.
Comparison of the observed reductions of inhalable particulate ambient concentrations since 2000 and the projected decreases expected due to the climate act suggests that NYSERDA could validate their health impact benefit claims. They claim benefits by preventing tens of thousands premature deaths, thousands of non-fatal heart attacks, thousands of other hospitalizations, thousands of asthma-related emergency room visits, and hundreds of thousands lost workdays. Using their linear relationship and an order of magnitude larger observed reduction of inhalable particulates then the relationship should show up. I find it hard to believe that the reduction in inhalable particulates has actually prevented millions of lost workdays.
Finally, note that the integration analysis only presents strategy recommendation. At the end of 2022 the scoping plan will be finalized and the next year NY agencies will have to develop implementing regulations. In this example, will they actually prohibit wood burning to ensure that the greenhouse gas emission targets and the projected health benefits are realized? Maybe they will just assume that their electrification and home heating energy efficiency programs will be so popular that everyone will convert willingly. I don’t think that will work given that many of the people that I know who use wood for heating, get the fuel from their own woodlots. Electric options have to be significantly more expensive for them. Finally note that they might believe that wood stove energy efficiency programs will improve performance and reduce inhalable particulate emissions. I don’t think that is a realistic hope because maintaining efficiency is too difficult for typical home owners.