

The New York Climate Leadership and Community Protection Act (Climate Act) integration analysis benefits and costs presentation was discussed at the October 14, 2021 Climate Action Council meeting (meeting recording available here). This post documents the proposed health benefits presented.
I have written extensively on implementation of the CLCPA because I believe the ambitions for a zero-emissions economy outstrip available technology such that it will adversely affect reliability and affordability, will have worse impacts on the environment than the purported effects of climate change, and cannot measurably affect global warming when implemented. The opinions expressed in this post do not reflect the position of any of my previous employers or any other company I have been associated with, these comments are mine alone.
Background
The Climate Action Council is responsible for submitting the Scoping Plan that will outline a plan to implement strategies to meet the ambitious targets of the CLCPA. Of particular interest are the 2030 targets: reduce greenhouse gas emissions by 40% relative to the 1990 baseline and 70% of the electrical energy is supposed to come from renewable resources. Starting in the fall of 2020 seven advisory panels developed recommended strategies to meet the targets that were presented to the Climate Action Council in the spring of 2021. Both the Council and the advisory panels are composed of political appointees chosen more for their direct involvement in the CLCPA transition than their expertise in the energy sector so the strategies proposed were more aspirational than practical.
Developing a plan to transform the energy sector of the State of New York is an enormous challenge so the New York State Energy Research and Development Authority (NYSERDA) and its consultants are providing technical support to translate the recommended strategies into specific policy options. The results of this integration analysis were presented to the Climate Action Council in two October meetings.
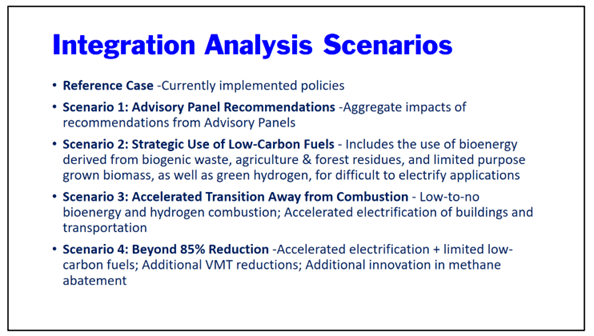
The integration analysis models the complete New York energy sector. It includes a reference case that projects how the economy and energy sector will evolve out to 2050 in the absence of any Climate Act policies or mandates. The following slide from the first integration analysis presentation lists the four mitigation scenarios that were developed to compare with the reference case. The first simply developed energy strategies that implemented the advisory panel recommendations but the results showed that even more stringent policies were needed because the 2030 targets were not met. The second mitigation scenario meets the 2030 targets by using low-carbon fuels to meet the critical need for dispatchable resources to keep the lights on. The third scenario placates the members of the Climate Action Council that naively demanded that no combustion is necessary despite the lack of a proven technology that can keep the lights on in the worst-case scenarios. Because some members of the Climate Action Council are dupes who don’t appreciate the technological hurdles and risks to reliability of the transition to zero-emissions using renewable energy and have no personal accountability for recommending policies that put New York at risk of catastrophic blackouts, there is a fourth mitigation scenario that looks at options for eliminating combustion as much as possible as soon as possible.
Benefits Overview
It is difficult to describe the benefit calculations in any detail because the documentation consists of a power point presentation that offers little supporting information. The discussion of the benefits and costs analysis starts at 1:11:30 in the recording of the presentation by Carl Mas. The first slide discussed the resource cost analysis approach.

The next slide explained (1:14:33 of the recording) that the value of avoided greenhouse gas (GHG) emissions will be calculated based on guidance provided by the Department of Environmental Conservation (DEC). This externality benefit is called for in the law and was not discussed in the presentation after the introduction. In a previous post I evaluated this benefit. Note that the slide says they calculate the value of avoided greenhouse gas emissions. I explained that approach incorrectly uses the social cost of carbon metric values by applying them to avoided emissions rather than the emission reductions themselves. The integration analysis claims reducing GHG emissions will provide societal benefits of avoided economic damages of $260 billion. The correct value is much less. According to §496.4 Statewide Greenhouse Gas Emission Limits (a) “For the purposes of this Part, the estimated level of statewide greenhouse gas emissions in 1990 is 409.78 million metric tons of carbon dioxide equivalent, using a GWP20 as provided in Section 496.5 of this Part”. The DEC Value of Avoided Carbon Guidance recommends a social cost of $121 in 2020 and $172 in 2050. If New York had magically eliminated all of the 409.78 million tons of GHG in 2020 the societal benefit of those reductions would have been $49.6 billion making the integration analysis 5.24 times too high. If all the reductions occurred in 2050 the societal benefit would be $70.5 billion making the integration analysis 3.7 times too high.

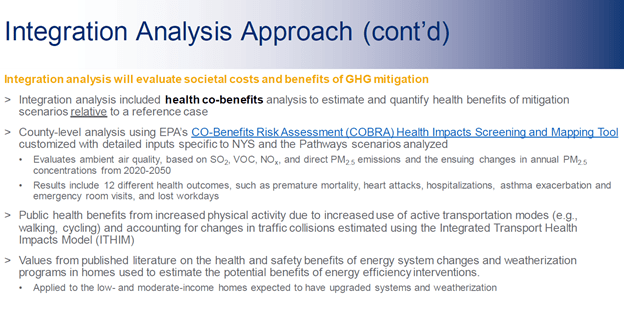
The next slide (1:15:34 of the recording) summarized the approach used in the analysis. He noted that inhalable particulates (PM2.5) was “really the core driver of our asthma, heart attacks, and early mortality” health impacts. They came up with a couple of other potential health benefits. This section is a good overview of the “angles” they are taking to monetize health benefits.
The summary of the benefits (1:28:55 of the recording) introduces the idea that the cost of inaction exceeds the cost of action by more than $80 billion. The benefits breakdown in the “Strategic Use of Low Carbon Fuels” scenario into two categories. In the first there are $160 billion in benefits due to improvements in air quality, increased active transportation, and energy efficiency interventions in low- and moderate- income homes. Reducing GHG emissions avoid social costs due to climate change to the tune of $260 billion. The claim is that there is a $420 billion benefit to society when the Climate Act emission reduction programs are implemented.

After a discussion of the cost estimates, the presentation went into the details of the health effects benefits (2:59:40 of the recording). Note that in the introduction to the health effects “deep dive” there is a “spoiler alert” that wood smoke is an important driver of health impacts and that as we electrify and do energy efficiency, we will be reducing wood smoke as well. Mas then re-iterated that three components were analyzed (3:01:16 of the recording).

According to the key findings slide (3:02:25 of the recording) the health impacts have a high and low range of benefits. While they have “honored” that the higher values are model outputs they use a number from the higher end of the range because it is “conservative” and they don’t include the impacts of ozone and toxics. Note that most of the impacts are experienced in state but there are benefits to downwind states.

Air Quality Benefits
According to the presentation (3:05:34 of the recording):
Air quality improvements can avoid:
-
-
-
-
- Tens of thousands premature deaths
- Thousands of non-fatal heart attacks
- Thousands of other hospitalizations
- Thousands of asthma-related emergency room visits
- Hundreds of thousands lost workdays
-
-
-
Note that these air quality improvements are monetized to come up with the benefit dollars.
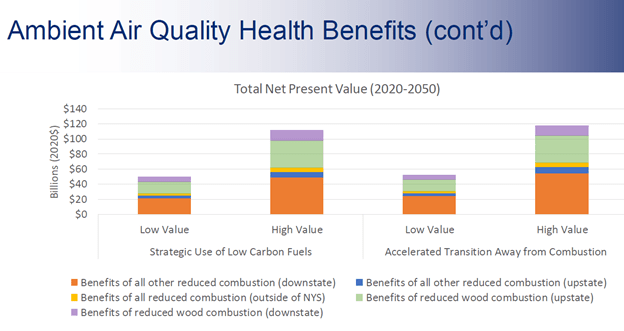
The next slide (3:06: 04 of the recording) breaks down the projected health benefits across scenarios 2 and 3 by the areas affected and primary driver.
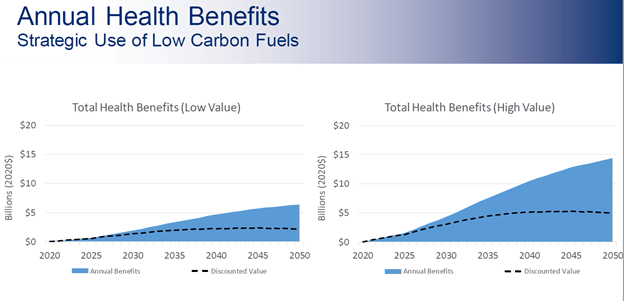
The “Annual health benefits” slide (3:07: 47 of the recording) shows “what the discounting and time value of money do” to the results. Note that benefits grow over time.
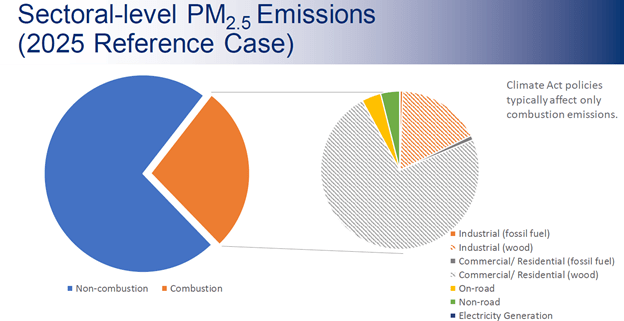
The next slide I will discuss (3:08:27 of the recording) shows where the inhalable particulate emissions are coming from. I am not comfortable with this slide based on my experience. In particular his claim that “It may be surprising to some that most of the PM2.5 comes from non-combustion sources” runs contrary to my long-held understanding but that will have to be a topic for another article. The point of this slide is that wood burning is a bad actor: “It is not that we are burning a lot of wood but it is very dirty when it is burned.”
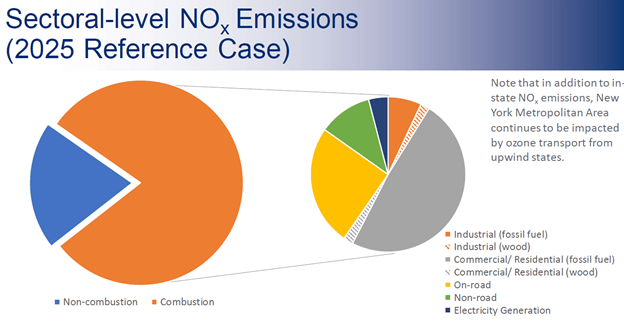
The next slide (3:11:17 of the recording) shows the emissions for nitrogen oxides (NOx). The slide shows that most of the NOx comes from combustion and that very little of it comes from wood burning. Mas concludes that in order to reduce these emissions we need to “go after” the on-road vehicle fleet and in-building fuel combustion.
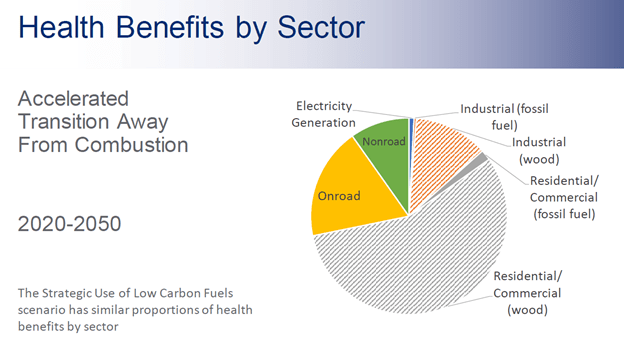
The next slide (3:12: 53 of the recording) shows the health benefits by sector. The key finding in this slide is that there are significant health benefits if residential and commercial wood burning is reduced. He re-iterates the claim that as we electrify buildings and improve energy efficiency that wood burning will go down. Outside of the Albany bubble there is an inconvenient fact. Most people who burn wood do it because it is the most economical solution for home heating in their situation. In rural areas many people have wood lots and the fuel is free. Until such time that electrifying homes and providing improved energy efficiency is free, I don’t see why the integration analysis can assume that there will be significant reductions in wood burning.
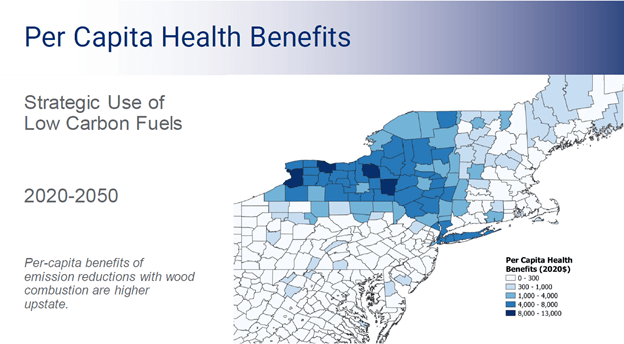
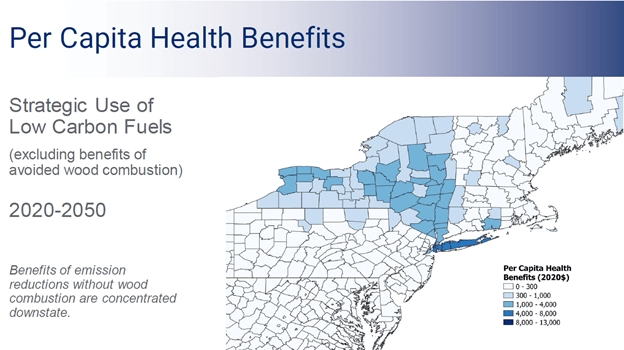
The “Per Capita Health Benefits” slide (3:14: 08 of the recording) is the first of a series of slides that presents data on a county basis. They present the data on a per capita basis to normalize the results. The broad swath of upstate counties gets most of their benefits from emission reductions with wood combustion in scenario 2 “strategic use of low carbon fuels”. There is a similar slide for the “accelerated transition away from combustion” scenario that is in the presentation but not included here.
The next slide (3:16:16 of the recording) excludes the benefits of wood combustion for scenario 2. This shows the health benefits from reducing fossil fuel emissions. New York City and Long Island would benefit the most if those emissions were reduced. There is another similar slide for scenario 3. It shows that three counties are kicked up from the 300 – 1,000 health benefit cost level to the 1,000 – 4,000 cost level.
In his description of the slide that shows the projected reduction in PM2.5 annual average concentrations (3:17:39 of the recording) Mas mis-spoke when he says we are going to look at CO2 concentrations that drive the health benefits. Actually, as mentioned earlier, he said that the health benefits are driven by inhalable particulates, PM2.5. This slide shows the results of decreasing emissions from both the wood smoke and fossil fuel sources due to the integration analysis projected changes due to their electrification and energy efficiency policies. Mas claims that there are “deep” reductions across the state but the highest possible reduction is only 0.35 µg/m3.

The next slide (3:18:58 of the recording) shows the annual reductions when the benefits of avoided wood combustion are not included. The results mirror the per capita health benefits. Avoided wood combustion reductions are mostly upstate and New York City and Long Island impacts from reduced fossil fuel combustion are still high.

Discussion of Air Quality Health Benefits
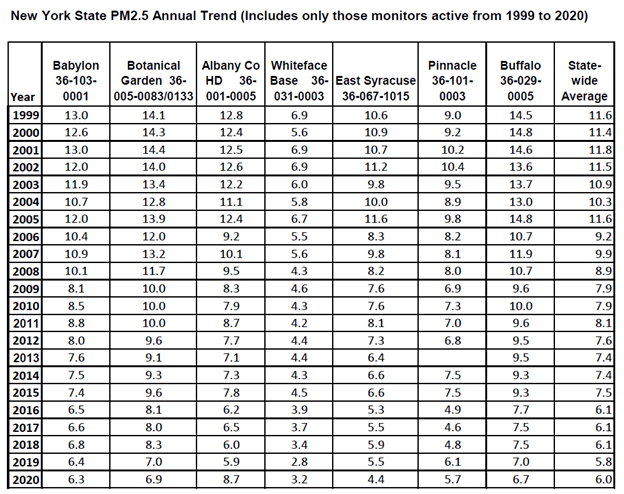
I looked into the air quality health benefits in detail in a previous post so I will not go into details here. The point of my previous analysis is that although Mas claims that there are “deep” reductions of PM2.5 concentrations by 2050 across the state, the highest possible reduction is 0.35 µg/m3. The following table shows that in 2020, the state-wide annual average using seven monitors that had data going back to 1999 was 6.0 µg/m3. In 2000, the average was 11.4 µg/m3 which is a reduction of 5.4 µg/m3. The COBRA health benefits model used here assumes that there is a linear relationship between health impacts and pollutant concentrations. The claimed $160 billion health benefits occur by preventing “tens of thousands premature deaths, thousands of non-fatal heart attacks, thousands of other hospitalizations, thousands of asthma-related emergency room visits, and hundreds of thousands lost workdays”. Using a linear relationship and an order of magnitude larger observed reduction of inhalable particulates between 2000 and 2020 then their model predicts that the observed reductions should have prevented, for example, millions of lost workdays. Until such time as NYSERDA can validate their modeling by showing that there were observed reductions of the purported health impacts between 2000 and 2020, I do not accept these results.
Active Transportation Health Effects
These health effects were discussed starting at 3:20:45 of the recording. There are two health benefits: people are healthier because they are walking or cycling and there are fewer traffic accidents. Mas went through these very quickly because of the schedule of the call so there wasn’t much explanation. He did note that they adapted a national model for New York State.

The next slide (3:21:26 of the recording) listed the results. The benefits accrue later in the implementation period as the active transportation policies get implemented.

Active Transportation Discussion
In a nutshell this benefit is based on programs that “encourage” personal transportation choices away from personal vehicles and then claims that it works out because it is good for you. These results are based on adapting a national model to New York. There is insufficient information to determine how they addressed winter. In the first place, walking and cycling in the winter is markedly more dangerous than other times of the year. In fact, both modes are so uncomfortable that it is likely that many people will fall back on personal vehicles in the winter. Both factors could reduce the benefits.
Energy Efficiency Health Benefits
The next slide (3:22:01 of the recording) introduced energy efficiency health effects. In order to conjure up these benefits NYSERDA used several studies instead of a model. The studies are not referenced in enough detail to access them and it appears that all are “grey” literature, that is to say have not been peer-reviewed. One of the references is from the American Council for an Energy-Efficient Economy who is a nonprofit research organization that “develops transformative policies to reduce energy waste and combat climate change.” They state that their “independent analysis” aims “to build a vibrant and equitable economy – one that uses energy more productively, reduces costs, protects the environment, and promotes the health, safety, and well-being of everyone.” They may be independent but they certainly are biased. As a result, there is every reason to expect that their estimates are likely high.
This research aligns with some of NYSERDA’s thinking about low- and moderate- consumers energy efficiency and fulfills the Climate Act requirements to target benefits to disadvantaged communities.

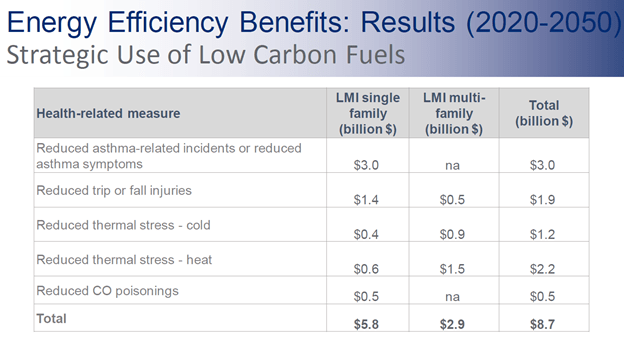
The next slide (3:23:35 of the recording) gives a breakdown of the benefits claimed. The predominate benefit is reduced asthma-related incidents. This is not from changes in the ambient air but due to improvements in the indoor air quality. This must mean that the proposed energy efficiency programs include ventilation air exchange components because airtight well-insulated building envelopes could increase indoor air concentrations.
The next slide (3:24:28 of the recording) shows that the benefits increase over time.

Energy Efficiency Benefits Discussion
I am leery of these claims. In the first place they are dependent upon research from organizations that are looking for particular answers. The energy efficiency component has to include an air exchange component to reduce asthma-related incidents that would increase as weatherization reduces infiltration. I have no idea how this strategy can reduce trip or fall injuries. Health benefits from reduced hot and cold thermal stress are claimed which makes sense. The final benefit is reduced CO poisonings presumably because combustion within homes is reduced. However, the integration analysis does not address how residents will keep warm when everything is electrified and there is an ice storm. A substantial number of the 151 deaths in the February 2021 Texas energy crisis died from CO poisoning trying to keep warm when they lost power.
Conclusion
The intent of this post was to document the health benefits claimed in the integration analysis. Readers should keep in mind that the costs are real. Completely re-building the entire New York energy sector will cost $340 billion for the strategic use of low carbon fuels scenario. On the other hand, all the benefits claimed are societal benefits that cannot directly offset the personal costs to New Yorkers. In that regard the benefits claims are tone deaf. Mas noted that most of the impacts are experienced in state but “there are benefits to downwind states”. While those benefits may feel good the fact is that they do nothing to reduce the real costs to New Yorkers.
Furthermore, the benefit estimates of benefits are heavily dependent upon value judgements and analysis assumptions. The air quality health benefits analysis assumes there is a linear relationship between health outcomes and changes in inhalable particulate concentrations that should be verified using New York before anyone can accept the proposed benefits. There is insufficient information to evaluate the active transportation and energy efficiency benefit claims. In a previous post, I explained that the state policy for the value of carbon incorrectly accounts for benefits. As a result, I disagree with the ultimate claim that the societal benefits of the Climate Act emission reductions out-weigh the real costs.

This is all fear porn to grift money from the globalists calls for carbon reduction, elimination of eating meat, social credit system tied to a carbon footprint…
You should be ashamed of yourself…go get a real job
LikeLike