

This is a summary of the presentation I gave to the Central New York Chapter Air & Waste Management Association on November 29, 2022 explaining why I believe that the risks, costs, and impacts of the Climate Leadership and Community Protection Act (Climate Act) exceed the protections, savings, and benefits.
Everyone wants to do right by the environment to the extent that they can afford to and not be unduly burdened by the effects of environmental policies. I submitted 23 comments on the Climate Act implementation plan and have published over 250 blog posts on New York’s net-zero transition because I believe the ambitions for a zero-emissions economy embodied in the Climate Act outstrip available renewable technology such that this supposed cure will be worse than the disease. The opinions expressed in this post do not reflect the position of any of my previous employers or any other company I have been associated with, these comments are mine alone.
Introduction
I explained that given the time constraints it was only possible to give sound bites to describe why I am skeptical of the ultimate impacts of the Climate Act. This blog post gives an overview of the presentation and, more importantly, a link to detailed information supporting my arguments. Everything presented draws on my blog posts and Draft Scoping Plan comments.
I discussed three primary concerns: reliability, affordability and environmental impacts. In every instance, my evaluation of the components of the transition plan has found that issues are more complicated, uncertain, and costly than portrayed by the State. Moreover, they have not provided a feasibility analysis to document whether their list of control strategies could work. In addition there is no implementation plan. The Climate Act is simply too fast and too far.
Overview of the Climate Act
I described the transition plan for New York’s Climate Act “Net Zero” target (85% reduction and 15% offset of emissions) by 2050. The Climate Action Council has been working to develop plans to implement the Act. The 22 members of the Council were chosen for their ideology and not their expertise and the lack of clear direction by the Hochul Administration led to misplaced priorities. Instead of focusing on overarching policy issues there has been inordinate attention to personal concerns of Council members.
Over the summer of 2021 the New York State Energy Research & Development Authority (NYSERDA) and its consultant Energy + Environmental Economics (E3) prepared an Integration Analysis to “estimate the economy-wide benefits, costs, and GHG emissions reductions associated with pathways that achieve the Climate Act GHG emission limits and carbon neutrality goal”. Integration Analysis quantitative implementation strategies were incorporated into the Draft Scoping Plan when it was released at the end of 2021. Since the end of the public comment period in early July 2022 the Climate Action Council has been addressing the comments received as part of the development of the Final Scoping Plan. Most recently they have been revising the Scoping Plan to come up with a final document. The intention is to release the Final Scoping Plan by the end of the year.
I expressed my disappointment with the public stakeholder process associated with the Draft Scoping Plan comments. Seven hundred people spoke at Climate Act Public Hearings and around 35,000 comments were received. However, on the order of 25,000 comments were “potentially the same or substantially similar”, i.e., form letters. That still left 10,000 unique comments that the Council promised would be “acknowledged”. In my opinion, the comment process was treated as an obligation not as an opportunity to improve, correct, or clarify the scoping plan.
Of course it is unreasonable to expect that the Council members could be expected to review all the comments themselves. Agency staff categorized the comments and then filtered them in presentations to the Climate Action Council that described themes with very little specificity. I think there was a clear bias in the presentations. Anything inconsistent with Administration’s narrative was disparaged, downplayed, or ignored. I was most disappointed that no comments on the fundamental basis of the Draft Scoping Plan, that is to say the Integration Analysis, were mentioned, much less discussed.
I also addressed the Climate Act mandates for 2023. The expectation is that the regulations that implement policies that force the transition away from fossil fuels will be implemented by the end of 2023. However, the Climate Act also mandates a public comment and consultation process before promulgating regulations. It requires the Department of Environmental Conservation (DEC) to complete a public comment and consultation process before it can promulgate the 2024 Implementing Regulations. This process includes public workshops and consultation with the Climate Action Council, the Environmental Justice Advisory Group, the Climate Justice Working Group, representatives of regulated entities, community organizations, environmental groups, health professionals, labor unions, municipal corporations, trade associations and other stakeholders. At least two public hearings and a 120-day public comment period must be provided. Only after this extensive stakeholder process concludes is DEC authorized to propose the implementing regulations. When the regulations are formally proposed the State Administrative Procedures Act requires a 60 day public comment period, public hearings, and that the agency respond to all comments. I think this is a very ambitious plan.
Electric Grid Risks
Many of the most vocal supporters of the Climate Act believe that existing renewable technology is sufficient to transition the New York electric grid to zero-emissions resources by 2040 and that suggestions that may not be true are misinformation. In order to address that fallacy my presentation concentrated on my concerns about the reliability risks of an electric grid that is dependent upon intermittent and diffuse renewable resources. The electric grid is crucial to New York’s energy future because the primary de-carbonization strategy is to electrify everything possible using those resources. I described the existing grid, generation resource planning, the current New York State system, and the projected New York State system. Electric grid reliability requires that generation resources match electric load at all times and the challenges associated with wind and solar in this regard are ignored by those who believe that existing technology is sufficient.
I made the point that failure to adequately plan will mean an inevitable catastrophic blackout like the Texas February 2021 blackout. In short, weather related issues due to freezing rain, snow and then an extended period of cold weather led to periods when the generating resources did not match the load necessary. The storm was the worst energy infrastructure failure in Texas history. Over 4.5 million homes and residences were without power, at least 246 people died, and total damages were at least $195 billion.
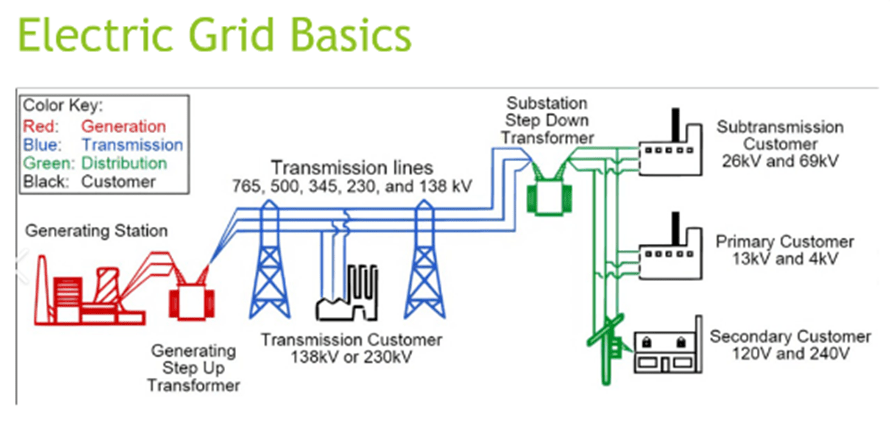
In order to illustrate the basic electric grid I included the following diagram. It shows that generating station provide power using turbine generators that convert mechanical energy into electric energy using water, steam, or other means to spin the turbines. I have heard the argument that the grid is inefficient because there are power losses between the generating station and the users but the fact is that New York will always be dependent upon a transmission system because there is insufficient space in New York City for sufficient renewable resources to provide the energy needed to keep the lights on. Power output from generating plants is stepped up at substation transformers for long distance transmission and then substation transformers step down the power for the distribution system for use by consumers.
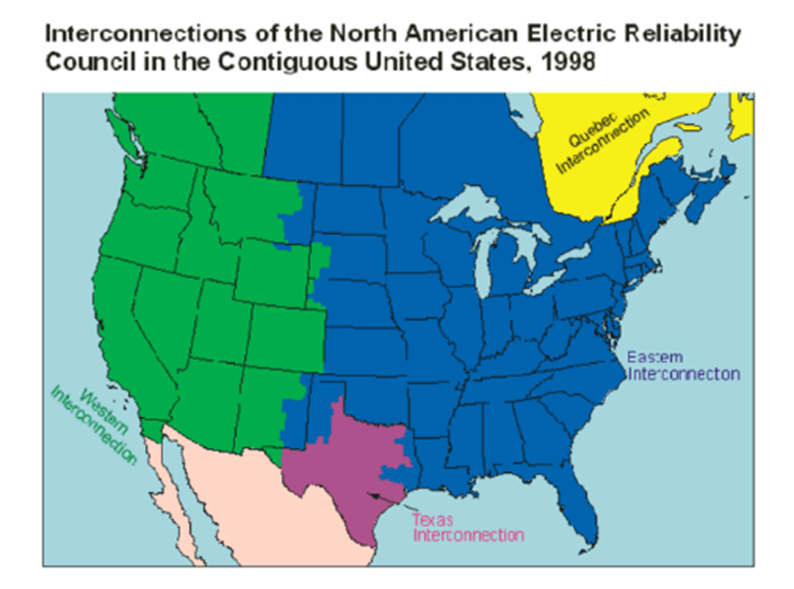
I included the following diagram to make the point that New York is in the Eastern Interconnection which is the largest machine in the world. Incredibly all the fossil, hydro, and nuclear generating stations in the Eastern Interconnection work together. In order to provide 60 Hz power the generating turbines are synchronized to run at 3600 revolutions per minute. Operators keeps the voltages as constant as possible in the entire area but have the advantage that those turbines provide inertia and they can dispatch generating resources as necessary. Unfortunately, wind and solar resources are inverter based and cannot be dispatched as needed.
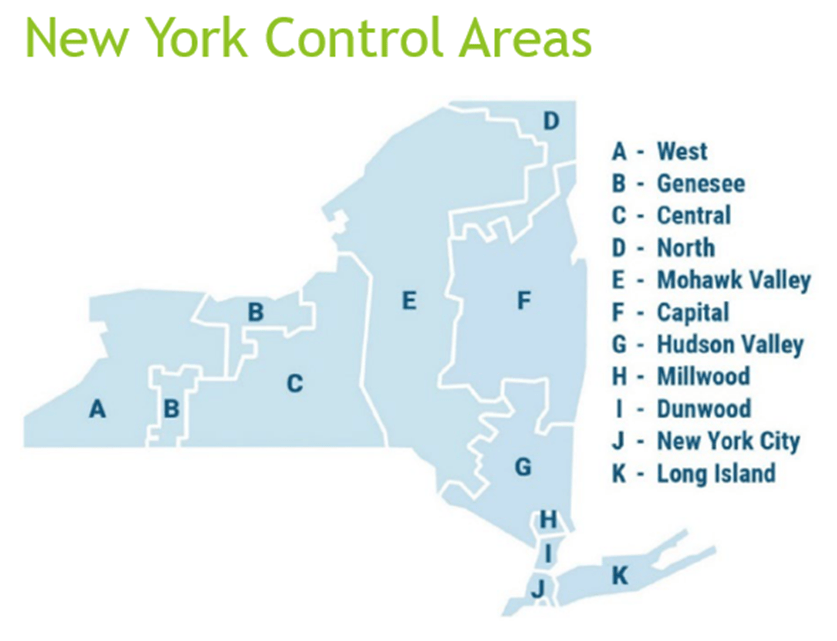
New York State has its own regional operator – the New York Independent System Operator (NYISO). Within Power the Eastern Interconnection system operators match the load with the generation in smaller regional systems. Regional system operators manage imports and exports between neighboring systems. New York has unique system constraints related to New York City and Long Island that warrant its own system operator.

NYISO operates the electric grid for New York State. There are 11 control areas with specific load, interconnection, and generation characteristics that must be addressed on a six-second basis to keep the lights on. New York State’s major challenge is that there are limits to transmission to the highly populated New York City and Long Island control areas. The NYISO has to address different time scales for load management:
- Sub-minute fluctuations are addressed automatically
- Hourly and daily fluctuations are handled by operators
- Annual peaks require planning so that operators can respond
New York’s high reliability performance standards are the result of decades of experience working with dispatchable resources and implementation of specific metrics developed after blackouts in 1965 and 1977.
In order to educate those who believe that existing renewable resources are sufficient for maintaining current reliability standards I described generation resource planning. The following load duration curve is a key concern of load management planning. There are three general resources. Baseline resources ideally are dispatched so they can run at a constant rate which enables the resource owners to tune the units to run as efficiently as possible. Daily load variations require some resources to follow load during the day. The biggest planning challenge is capacity and energy for peak loads that occur when temperatures are highest or lowest. Before deregulation, each utility was responsible for meeting all these resource needs. In New York City the solution for the peak load problem was a fleet of simple-cycle turbines dedicated for use to provide peaking power when and where needed.
The problem with existing renewable resource technology is matching load when the system is dependent upon renewable resources that cannot be dispatched and provide variable energy. This is a new and difficult challenge. It is exacerbated by intermittent renewable energy availability associated with peak loads. Load peaks with the coldest and hottest weather but those conditions typically are low wind resource periods. Wind lulls in the winter when solar is low availability is the critical reliability issue.

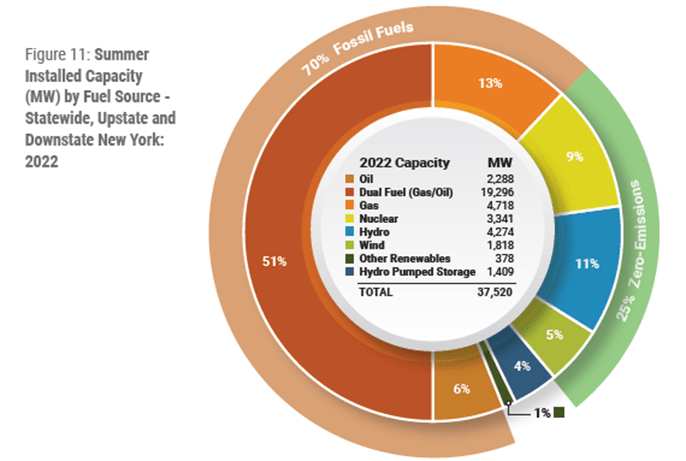
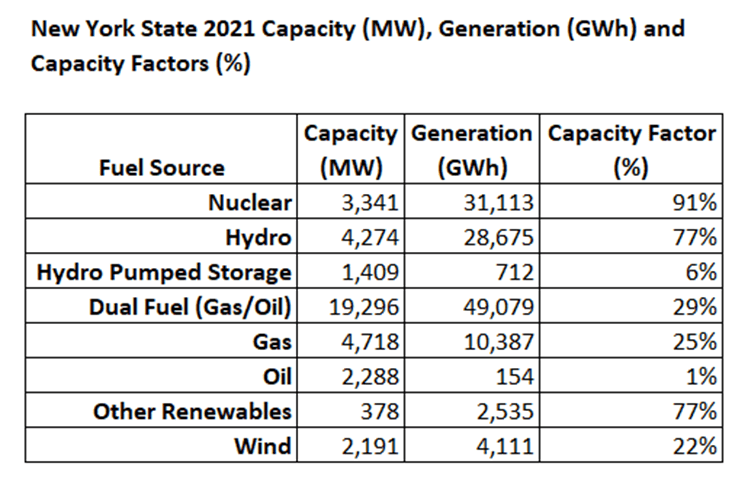
The NYISO 2022 Power Trends Report includes this description of the capacity (power available in MW) for the existing system. It shows that 70% of installed capacity is fossil fueled and 25% is zero emissions. Wind and other renewables (solar energy, energy storage resources, methane, refuse, or wood) account for only 6% of installed capacity. Note that NYISO does not measure distributed solar directly. In their accounting it reduces the load so less generation is needed.
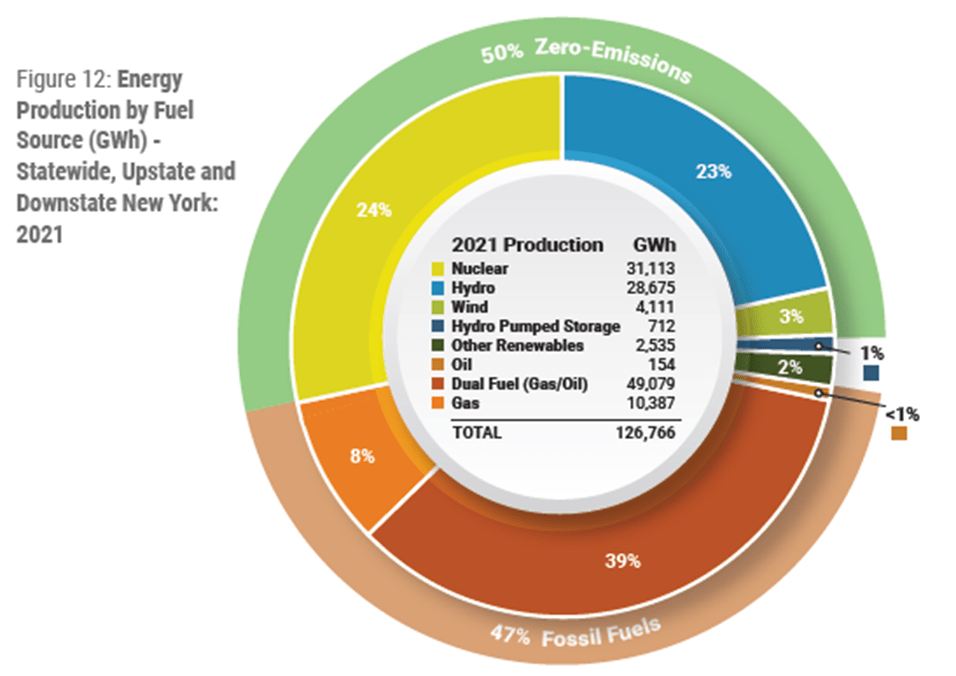
The NYISO 2022 Power Trends Report includes this description of Energy Production (MWh). Note that 50% of New York’s generated electricity is zero-emissions. There is a Climate Act target to “Increase renewable sources to 70 percent by 2030” that does not include zero-emissions nuclear. One reason that I am skeptical of the Climate Act is because 24% of renewable source energy produced is hydro and hydro pumped storage. Wind and other renewables (solar energy, energy storage resources, methane, refuse, or wood) account for 5% of energy produced. The 29% of the energy produced from renewable sources is far less than the 70% by 2030 target. I don’t think that it is feasible to develop over 29GW of renewable resources between now and 2030 with supply chain issues, constraints on permitting, procurement, and construction when development of supporting infrastructure is also needed for off-shore wind development.
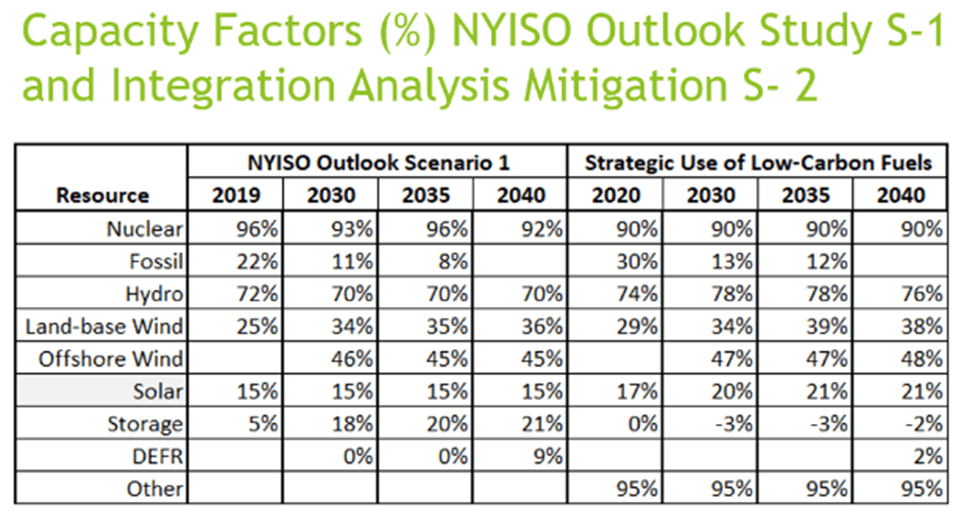
The capacity factor is a useful metric to understand electric generation resources. The annual capacity factor equals the actual observed generation (MWh) divided by maximum possible generation (capacity (MW) times the 8,760 hours. In New York nuclear is a key contributor but the Administration recently shut down 2,000 MW at Indian Point. At this time the simple-cycle peaking turbines are being phased out and peaking power is produced by oil-fired units and spare capacity in the gas and dual fuel units. Note that oil is a unique New York resource. Imagine the difficulty replacing that capacity with a resource that would only need to run 1% of the time. Note that in 2021 New York land-based wind only had a 22% capacity factor.
It is commonly argued that renewables are the cheapest type of new electric generating resources. For example, that was the claim in a Dave Davies interview on National Public Radio Fresh Air: “A new climate reality is taking shape as renewables become widespread” with New York Times staff writer David Wallace-Wells. Wallace-Wells said: “In fact, according to one study, 90% of the world now lives in places where building new renewable capacity would be cheaper than building new dirty capacity. And indeed, in a lot of places, it’s already cheaper to build new renewables than even to continue running old fossil fuel plants.” He went on to say “…we should be going all in on renewables here. We shouldn’t be building new coal or new oil or new gas capacity.”
The key to this claim is the reference to capacity. If that were the only factor involved in getting the electricity when and where it is needed 24-7, 365 days a year without losing load due to extreme (one in ten year) conditions then his argument that we shouldn’t be building new coal, oil, or natural gas capacity” would be valid. It is not. Obviously electric users want power even when the wind is not blowing at night. Electric system innumerates under-estimate the challenge of the energy storage requirements for extreme renewable resource lulls which correlate well with weather events that are safety threats because of extreme cold and heat.
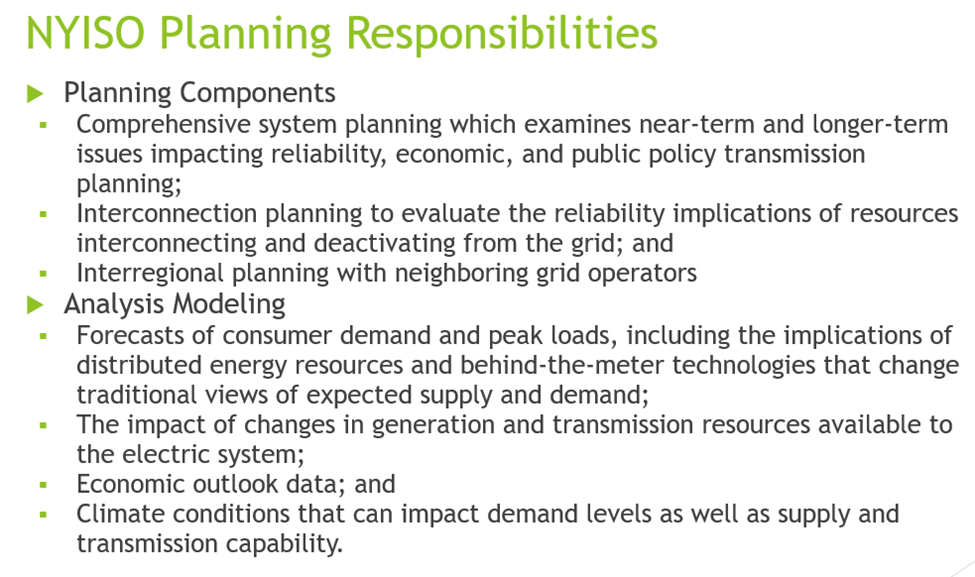
Given time restraints I could not fully describe all the NYISO’s planning responsibilities. I did not include the following slide but made the point that their modeling analyses incorporate all of the complexities of the New York electric system. I did not describe the three primary components of their responsibilities: comprehensive system planning which examines near-term and longer-term issues impacting reliability, economic, and public policy transmission planning; interconnection planning to evaluate the reliability implications of resources interconnecting and deactivating from the grid; and inter-regional planning with neighboring grid operators. One of the primary functions of the NYISO is electric system planning. NYISO modeling incorporates all the complexities of the eleven control areas in the New York energy system.
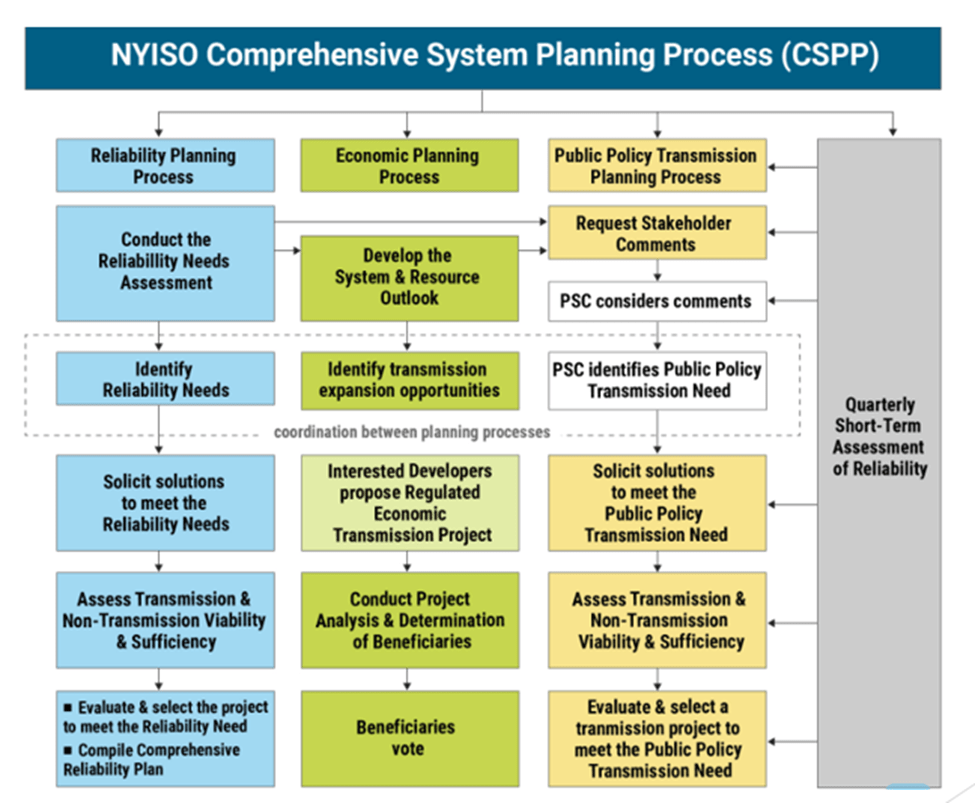
I included the following summary of the NYISO Comprehensive System Planning Process to show all the components and to highlight the recent addition of a new component. In order to address the Climate Act NYISO added “Develop the System & Resource Outlook” component that looks at a longer planning horizon that was included previously.
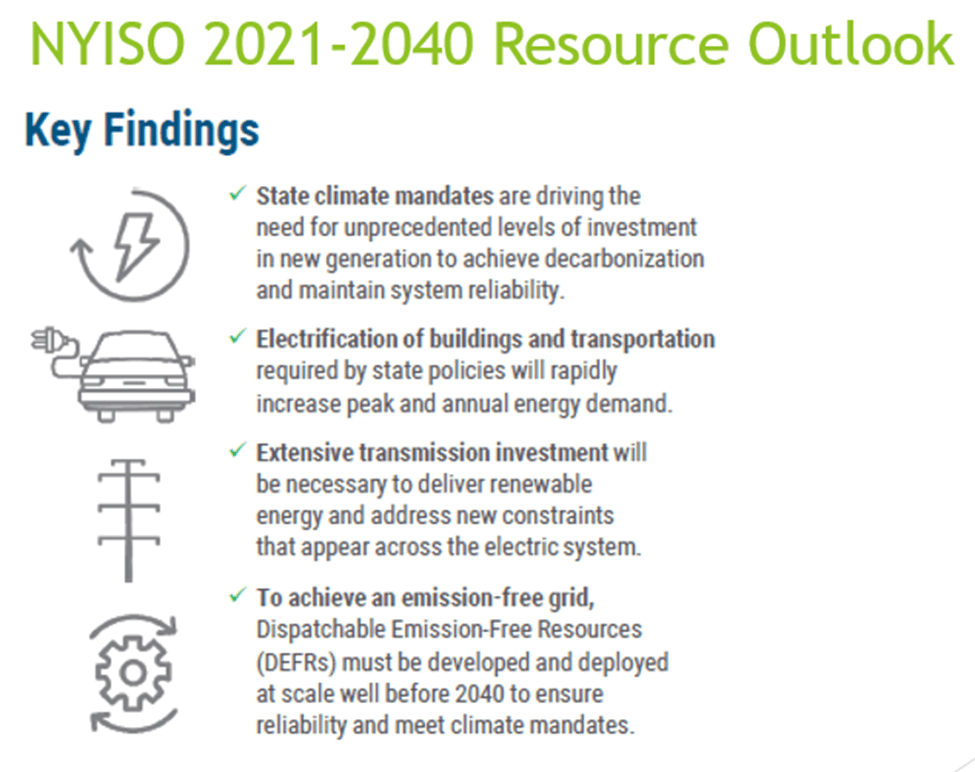
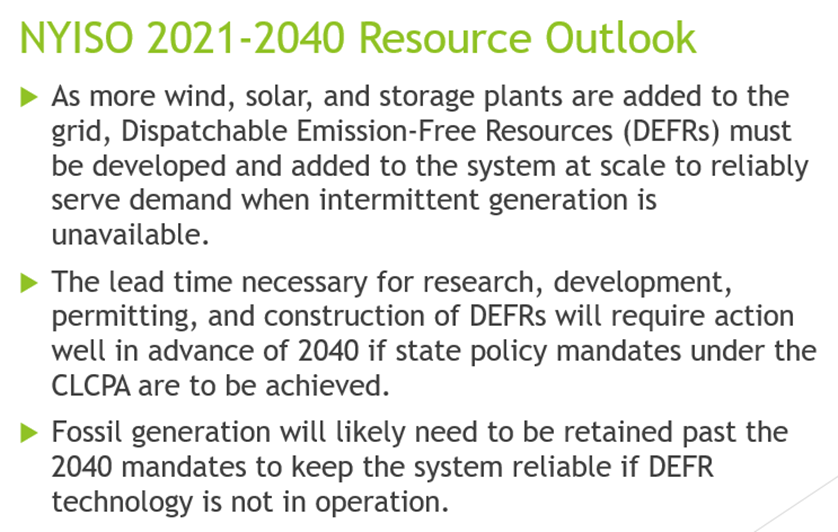
The first report for the resource outlook component was released a couple of months ago. The 2021-2040 System & Resource Outlook can be downloaded from NYISO and a datasheet summary of key takeaways of the Outlook report is also available. The summary describes the four key findings: an unprecedented buildout of new generation is needed, load will increase when we electrify everything, transmission is necessary and must be expended to get diffuse renewables to New York City and a new resource has been identified: Dispatchable Emissions-Free Resource (DEFR). That resource is essentially a fossil-fueled turbine without any emissions.
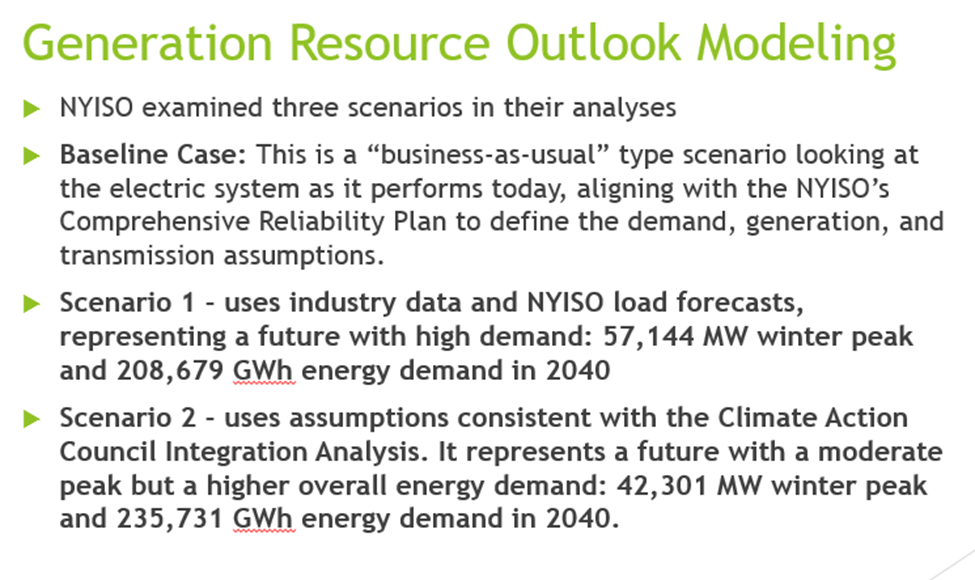
I compared the NYISO Resource Outlook modeling analysis with the Integration Analysis modeling. The Outlook analysis was based on three scenarios. In order to evaluate the effects of different policy options, this kind of modeling analysis projects future conditions for a baseline or business-as-usual case. The evaluation analysis makes projections for different policy options, and then the results are compared relative to the business-as-usual case. NYISO ran two policy scenarios: one based on their estimates of future demand and one that tried to simulate the Integration Analysis projections. I compared their scenario 1 to the Integration Analysis in the presentation.
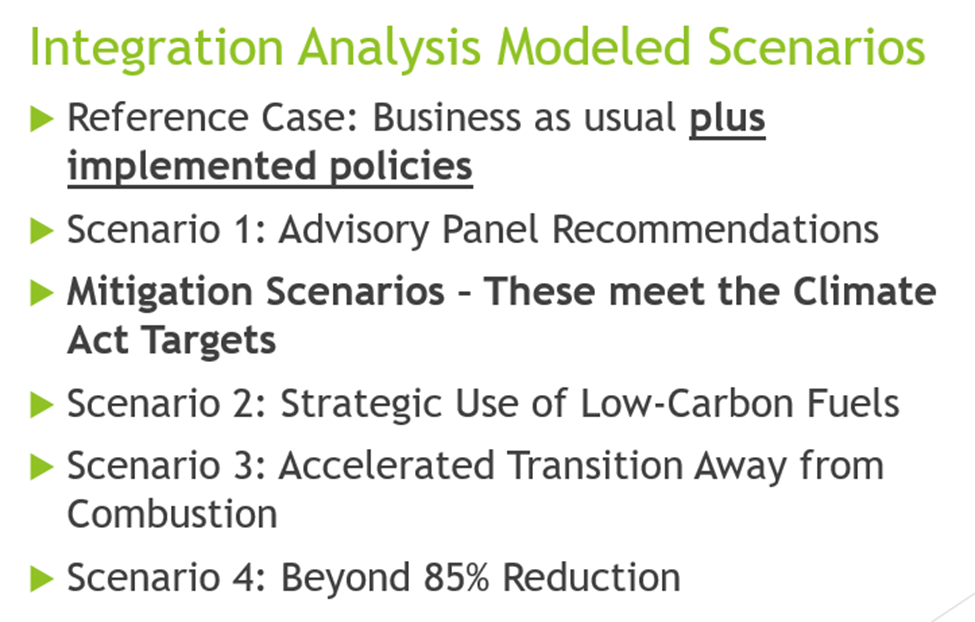
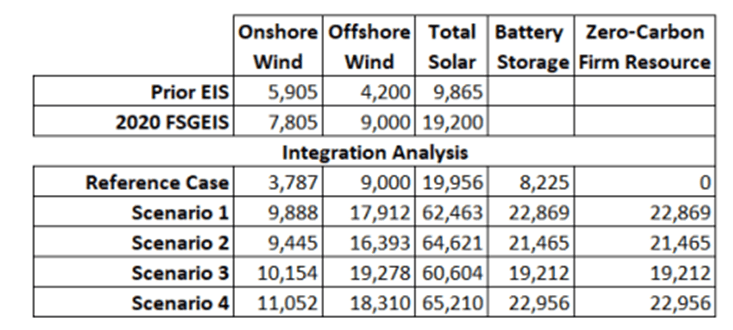
The Integration Analysis modeling was used to develop the Draft Scoping Plan. It is important to note that contrary to usual practice the Integration Analysis baseline was a reference case that included “already implemented” programs. In other words there are some programs incorporated into the Reference Case that only exist to reduce GHG emissions. This definition of the Reference Case instead of a Business-As-Usual case is different practice and motivated to get a specific answer. The Integration Analysis considered four different policy projections. The first considered the Advisory Panel recommendations for control measures, but the modeling showed that they did not meet the Climate Act targets. The Integration Analysis came up with three mitigation scenarios that did meet the targets. The model used for the analysis is not as sophisticated as the NYISO model. Modelers plugged in a set of control measures at varying efficiencies until they met the targets. Note, however, they have not claimed that the scenario measures as scoped out will provide electricity that meets current reliability standards. In my opinion this approach gave the impression to the Council that meeting the targets would be relatively easy. Council members requested scenarios that considered a faster implementation schedule and more reductions that the 85% target. The cost/benefit results claim that those more stringent scenarios provide more benefits primarily because of reduced costs. I think that is a counter-intuitive result so my comparison was against Scenario 2: Strategic Use of Low-Carbon Fuels.
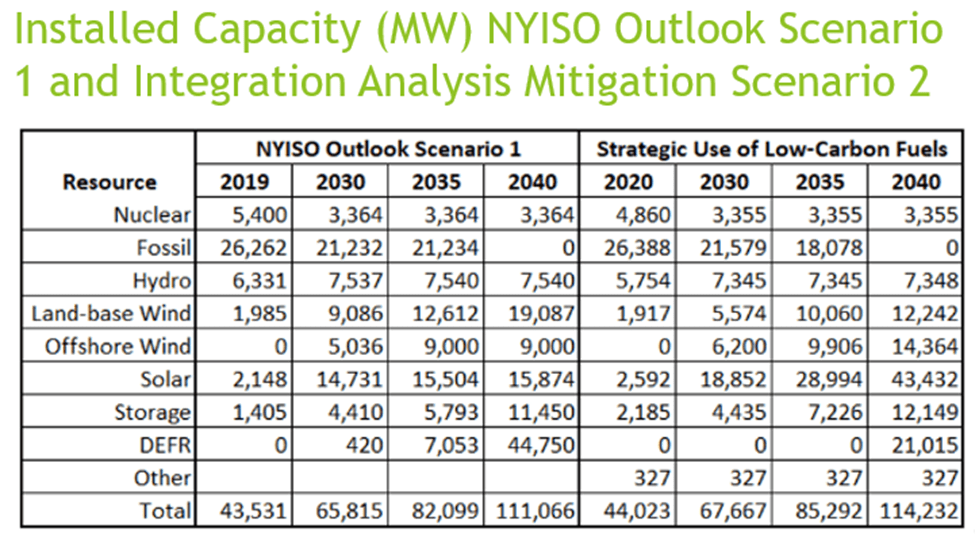
I compare the installed capacity for the two models in the next table. As noted by the NYISO, an extraordinary development of renewables by 2030 is required and both models agree on that. There also are some key differences. The NYISO modeling projects more onshore wind, less offshore wind, less solar, and more DEFR. The NYISO model simultaneously optimizes resource capabilities and costs to come up with a least-cost solution. I think the wind differences are due to cost and availability differences. The two modeling approaches handle distributed solar differently. NYISO does not measure generation from distributed sources and only considers it as a way to reduce the load needed. The Integration Analysis explicitly includes distributed solar capacity and generation as an output. Note that existing storage is pumped hydro but any new storage will be batteries. Finally, it is notable that both modeling analyses project that 2040 DEFR will be comparable to existing fossil capacity albeit NYISO projects significantly more and Integration Analysis a little less.
I compare the energy produced (GWh) for the two models in the next table. The largest difference between the models is that NYISO projects that DEFR generates ten times more energy. It turns out that NYISO has DEFR generating 14% of the total energy in 2040 but Integration Analysis projects only 1%. NYISO projects more onshore wind than offshore wind and the Integration Analysis projects the opposite. There is huge difference between solar but I believe that is related to the fact that NYISO does not explicitly include distributed solar. Clearly the two models handle storage differently.
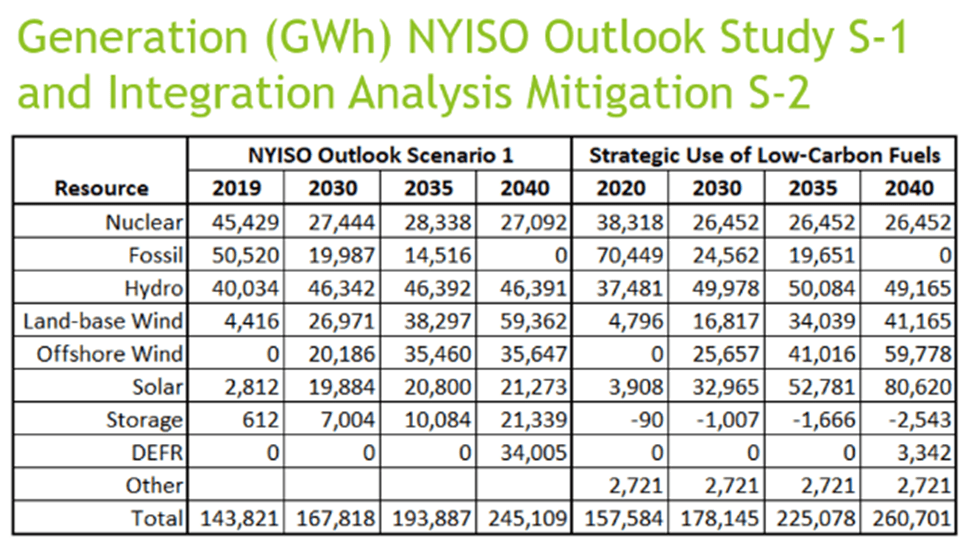
I noted earlier that I was disappointed that the Hochul Administration ignored my comments on the Integration Analysis. The capacity factor table shows one of the points I made in my comments. I pointed out that the Integration Analysis land-based wind capacity factors were unrealistically high. The model projected the 2020 generation with a capacity factor of 29% but the 2021 observed capacity factor was only 22%. As a result the Integration Analysis projections for the land-based wind needed to meet the load is too low. For all renewable resources the Integration Analysis capacity factors are higher than the NYISO projections. I prefer the projections from the organization responsible for New York reliability to those from the unelected bureaucrats who have no such responsibilities.
There is one other point in this table. The DEFR capacity factors are different. To this point the extra capacity needed to keep the lights on during peaking periods was provided by relatively cheap sources of energy. When new peaking resources were needed, cheap simple-cycle turbines were installed. Currently peak energy resources are primarily from existing old, amortized facilities. As we shall see, the new DEFR required to keep the system working will use much more expensive resources. In our deregulated system the NYISO will have to develop a market payment scheme to cover those increased costs.
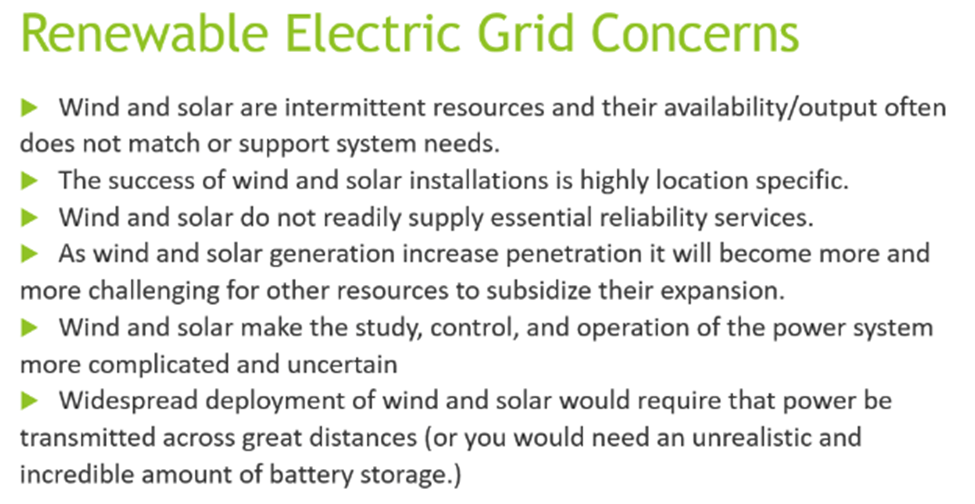
As noted earlier, I believe that the NYISO projections based on more sophisticated modeling has a much better chance than the Integration Analysis to describe a mix or resources that will maintain current reliability standards. Nonetheless, I have reservations about any projections because the future electric grid will depend on unprecedented amounts of renewable energy resources. The following slide lists six of concerns for an electric system dependent upon renewable resources. For my presentation I only mentioned the first three. Because wind and solar are intermittent that means you have to have storage for daily, seasonal, and peak load requirements. The lack of an implementation plan ignores that wind and solar success is location specific. New York needs a plan that encourages development where the resource is better during the winter lulls. Specifically, it is not a good idea to offer the same incentives to utility-scale developments on the Tug Hill plateau where over 200” of snow are common as areas where snowfall amounts are lower. The third concern is reliability services and they are a reason that wind and solar are far more expensive for deliverable energy than fossil.
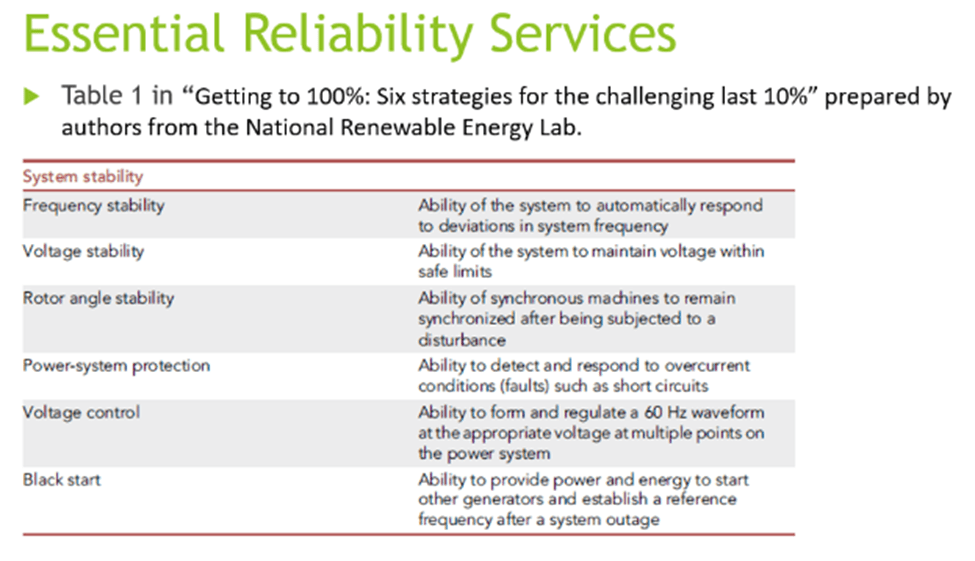
I found a good summary of the essential reliability services in a paper by National Renewable Energy Laboratory authors entitled Getting to 100%: Six strategies for the challenging last 10%. It describes ancillary services that must be provided to keep the transmission system going. Wind and solar do not provide those services so someone, somewhere else has to provide them at some additional cost.
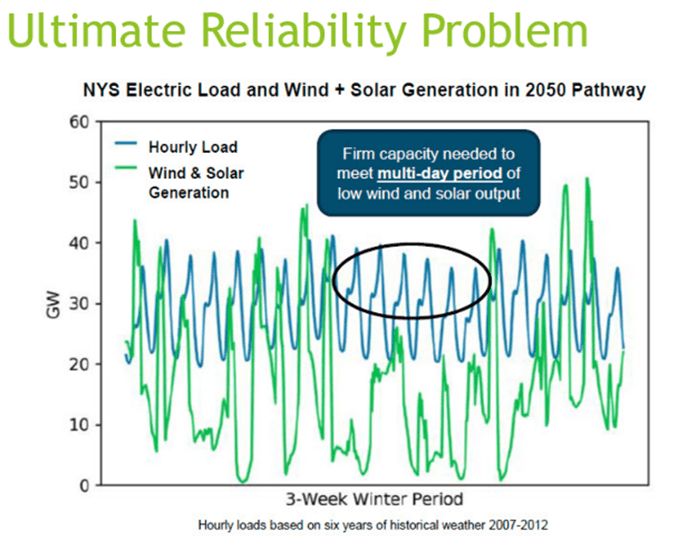
The ultimate reliability problem is illustrated in the following figure. This graph illustrates the long-duration wind lull problem from an early presentation to the Climate Action Council. It explicitly points out that firm capacity (DEFR) is needed to meet multi-day periods of low wind and solar resource availability. The Council has known about the problem all along but have basically pushed it aside as inconvenient. The thing to remember is that in order to prevent catastrophic blackouts caused because intermittent wind and solar are unavailable, NYISO and the Integration Analysis are both banking on DEFR capacity. Using wind, solar and storage exclusively makes meeting the worst-case renewable resource gap much more difficult.
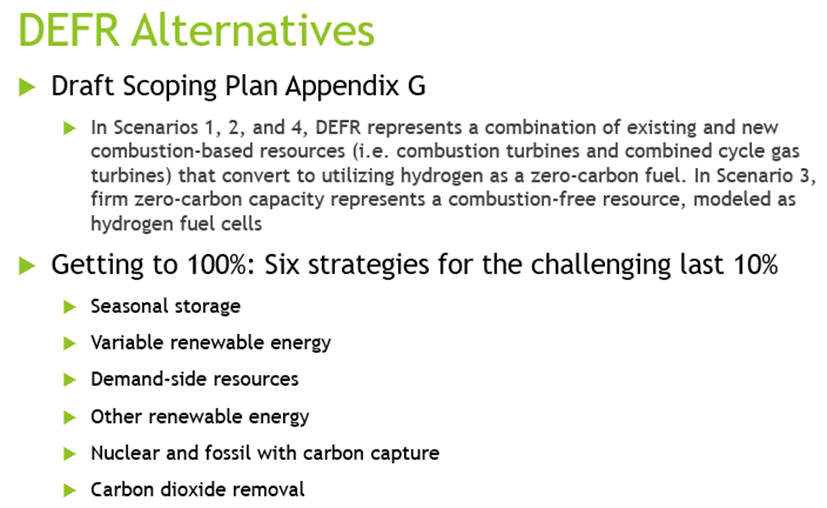
There is no doubt that the fate of future reliability is inextricably tied to DEFR success. The next slide discusses DEFR options. The Draft Scoping Plan acknowledges the need for DEFR and proposes seasonal hydrogen storage as a placeholder technology. NYISO, while explaining that the resource is necessary, has offered no recommendations what technology could fill the need. The NREL authors of Getting to 100%: Six strategies for the challenging last 10% described six DEFR strategies
- Seasonal storage which could be hydrogen or some other kind of long term storage solution
- Renewable energy is basically overbuilding with battery energy storage. I believe this represents the preferred approach of those who claim existing technology is sufficient.
- Existing technology adherents also claim that demand side resources can flatten the load peaks so much that less DEFR is needed
- The problem with other renewables (e.g. hydro) in New York is that they cannot be scaled up enough to meet identified needs
- Nuclear is the only proven and scalable DEFR technology currently available but it is a toxic option for NY politicians
- Carbon capture is unacceptable to the activists and has technological challenges that make it an unlikely a DEFR option.
- Because of the challenges of carbon sequestration to net out the 15% net-zero emissions, the Draft Scoping plan mentions the CO2 removal strategy but in my opinion it is unlikely.
There are two approaches advocated by those who believe that existing technology is sufficient to maintain electric system reliability in a zero-emissions electric grid. Some claim that only minimal storage is needed because renewables are available somewhere else, that is to say, the wind is always blowing somewhere. Others claim that overbuilding renewables supplemented with battery energy storage systems is a viable solution.
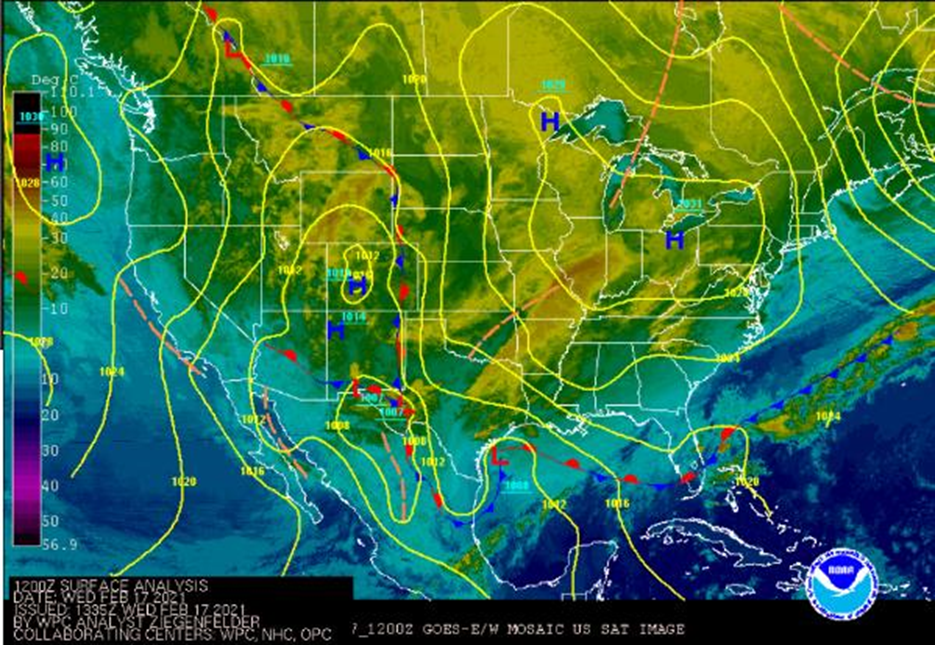
While the concept that the wind is always blowing somewhere else is indisputably true the issue is that in order to keep the lights on we need power at specific times and places from a dedicated source. New York City’s peaking turbines were located in specific locations to maintain reliability and they were dedicated to that application. New York’s reliability standards were developed based on decades of experience that showed that a certain installed reserve margin would guarantee that New York reliability standards could be maintained. Against that backdrop consider the following weather map on February 17, 2021. The Texas energy debacle was associated with this intensely cold polar vortex huge high pressure system. Remember that winds are higher when the isobars are close together. On this day there are light winds from New York to the southeast, west, and north including the proposed New York offshore wind development area. There are packed isobars in northeastern New England, in the western Great Plains, and central Gulf Coast. In order for New York to guarantee wind energy availability from those locations, wind turbines and the transmission lines between New York and those locations would have to be dedicated for our use. Otherwise I think it is obvious that jurisdictions in between would claim those resources for their own use during these high energy demand days. It is unreasonable to expect that building those resources for a once in a few years situation could possibly be an economic solution.
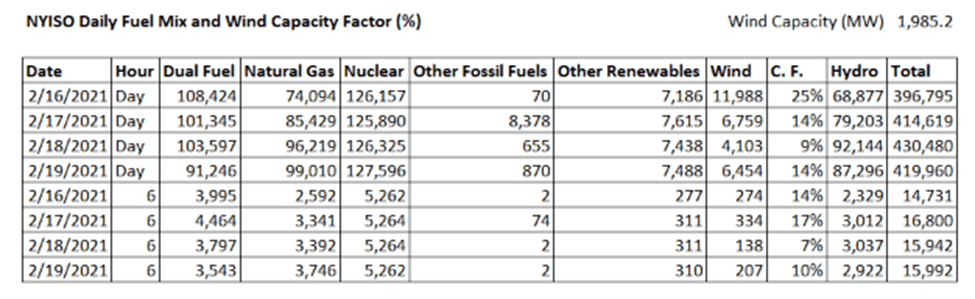
Another way of looking at this issue is to consider the NYISO fuel mix data available at the NYISO Real-Time Dashboard. I downloaded four days of February 2021 data to generate the following table. It shows that a high pressure system reduces wind resource availability across the state. The data show that less than a quarter of the daily wind capacity is available for this period. Note that the worst-case hour on 2/18/21 at 7:00 AM wind production was only 138 MW out of a New York total of 1,985 MW for a capacity factor of 7%. If we were to overbuild wind resources to replace the fossil capacity of 7,191 MW on that hour you would need 102,729 MW of wind resources.
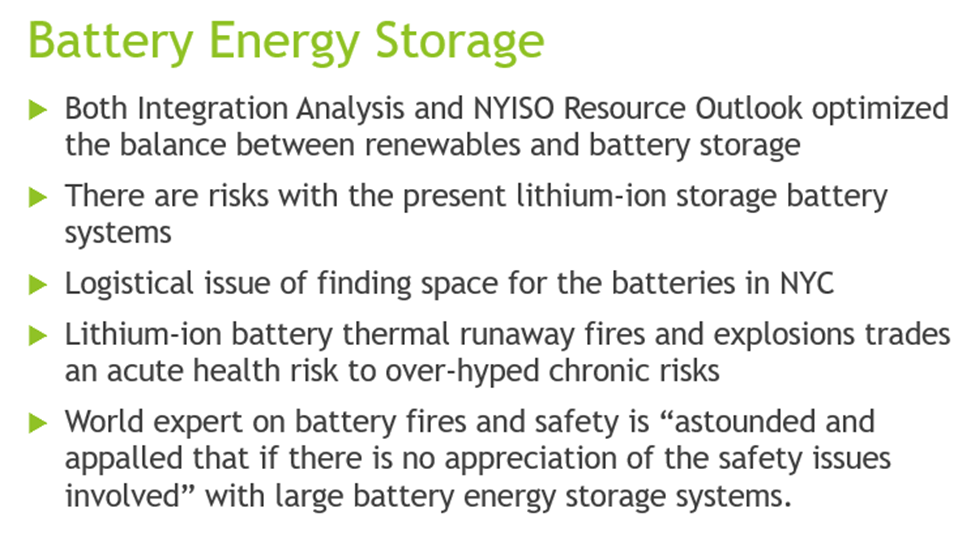
Clearly, overbuilding alone is not a viable solution. You have to have new energy storage and the currently available technology is battery energy storage systems. Both the Integration Analysis and NYISO Resource Outlook optimized the balance between renewables and storage but still found that DEFR was needed. Existing technology proponents claim that over-building wind, solar, and storage is viable but have not countered the NYISO or Integration Analysis modeling results. I am concerned about the risks associated with the current preferred technology: lithium-ion storage battery systems. The first risk is logistical inasmuch as battery storage footprints are larger than the existing peaking turbine sites so finding space for the batteries is an issue. Worse is the fact that lithium-ion storage batteries have the risk of thermal runaway fires and explosions that trade an acute health risk for chronic, and speculative, in my opinion, risks. Paul Christensen, Professor of Pure and Applied Electrochemistry at Newcastle University in the United Kingdom gave a presentation at PV magazine’s Insight Australia event in 2021 that describes the risks. His videos of thermal runaway tests are terrifying. He is one of the world’s leading experts on battery fires and safety and said global uptake of lithium-ion battery technology has “outstripped” our knowledge of the risks. He also stated that he is “astounded and appalled that if there is no appreciation of the safety issues involved” with large battery energy storage systems. This is another feasibility issue that is unaddressed by the Draft Scoping Plan.
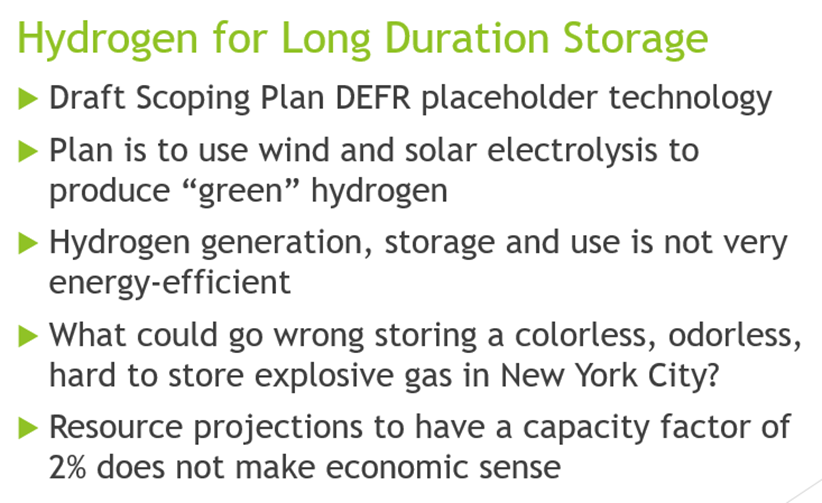
Hydrogen storage is the Draft Scoping Plan DEFR placeholder technology. The plan is to use wind and solar electrolysis to produce “green” hydrogen from water. The stored hydrogen would either be combusted to power turbines or used in fuel cells. There are fundamental issues associated with the use of hydrogen that I detail on my blog. Hydrogen generation, storage and use loses much more energy than alternatives and may not even have a net energy benefit so it is unlikely to be sustainable. In order for it to provide the necessary peaking power in New York City a colorless, odorless, hard to store explosive gas will have to be stored and used. I don’t think that the technology will be embraced in the City. All the infrastructure necessary to produce, store, and use will have to be built and paid for to meet a projected capacity factor of 2%. I doubt that makes economic sense.
I concluded my discussion of the risks to electric system reliability by summing up the NYISO Resource Outlook Key Findings Datasheet. According to the organization that is responsible for keeping the lights on, DEFR is necessary for future reliability. Because a politically acceptable DEFR that can be scaled up to meet the levels needed for reliability is not currently available, a new technology has to be developed, tested, and put on line well before 2040. The NYISO makes the point that until you have the necessary DEFR technology on line shutting down existing fossil generation is inappropriate. I am disappointed that the NYISO Resource Outlook has not mentioned any costs. This is likely to be a particular issue relative to DEFR. Clearly conditional implementation dependent upon the availability of DEFR would be a rational approach.
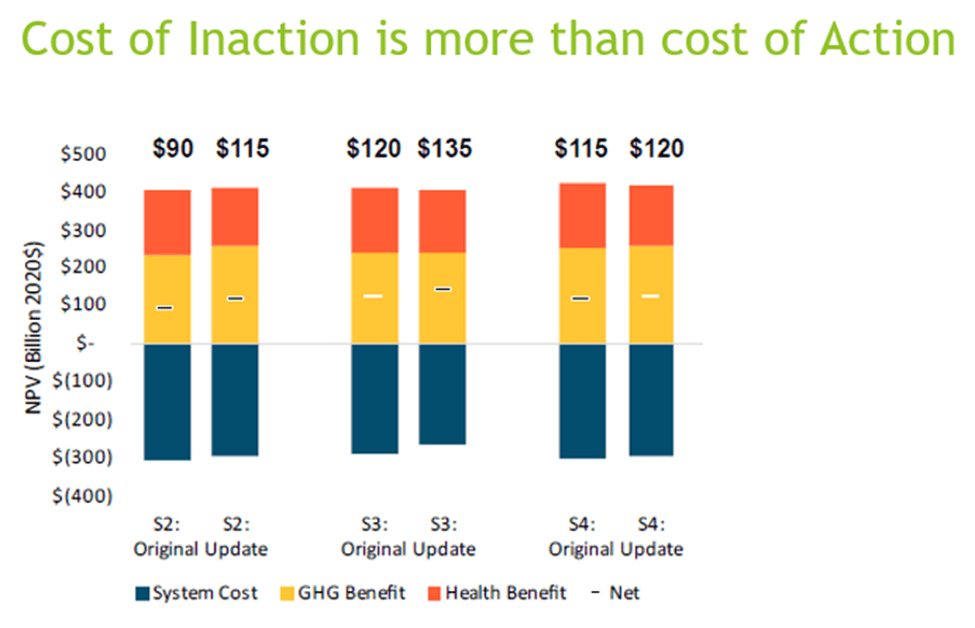
There is no documentation that lists the specific costs of control strategies, the expected benefits, or the expected emission reductions making it impossible to estimate the total costs of the Climate Act. That information is necessary to determine whether the Integration Analysis projections are feasible. The Draft Scoping Plan claims that the cost of inaction is more than the cost of action but a variation of this graph is the only documentation for that claim. I directly addressed this misleading and inaccurate statement in my comments at the Syracuse public hearing but there has been no response or mention of the issues I raised at any Climate Action Council meeting. The statement is misleading because costs are given relative to the Reference Case and not a business-as-usual case as explained earlier. I believe that the Reference Case includes at least the cost of the “already implemented” electric vehicle mandate. That means that all of the costs for electric vehicles, charging infrastructure, and distribution system upgrades necessary for electric vehicle charging are excluded from the cost of action. Correcting that “trick” would mean the costs of action are more than the costs of inaction.
There is another egregious cheat that further undermines the claim. It is inaccurate because the Draft Scoping Plan counts the societal benefits of avoided greenhouse gas emissions multiple times. My Draft Scoping Plan comments on benefits documents why I believe that their claim for $235 billion in societal benefits should only be $60 billion. Their approach is equivalent to me saying that because I lost 10 pounds five years ago, I can say that I lost 50 pounds. Correcting that error would also by itself invalidate their benefits claim. Bottom line is that I estimate that the real costs are at least $760 billion more than the imaginary claimed benefits.
In my opinion one of the biggest environmental success stories in my lifetime is the reintroduction of Bald Eagles. When I moved to Syracuse in 1981 it was inconceivable that it would be possible to see a Bald Eagle from my home but I have seen several in the last few years. One of the missing pieces of the Climate Act implementation plan is an update of the Cumulative Environmental Impact Statement to reflect the latest estimates of the number of wind turbines and areal extent of solar panels. I worry that the combined effect of all that development will threaten Bald Eagles.
The following table was not included in the presentation but shows the capacity of the resources not considered in the cumulative impact statements. Clearly, much more renewable capacity will be required than has been evaluated.
Comparison of Integrated Analysis Projected Capacity and Cumulative Environmental Impact Statements (MW)
The following table used in the presentation shows the number of wind turbines and areal extent considered in the completed cumulative impact statements relative to the projected numbers in the Integration Analysis. The Draft Scoping Plan calls for at least 497 more onshore wind turbines, 493 more offshore wind turbines and 602 more square miles covered with solar equipment than has been evaluated in cumulative analysis.
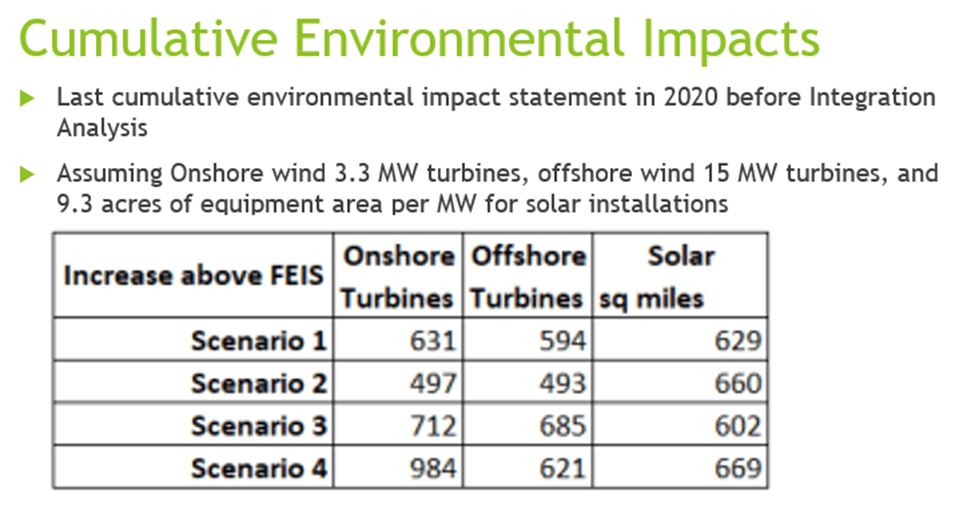
I have considered the avian impact of the Bluestone Wind Project in Broome County New York to show impacts for a single facility. It will have up to 33 turbines and have a capability of up to 124 MW covering 5,652 acres. Over the 30-year expected lifetime of the facility the analysis estimates that 85 Bald Eagles and 21 federally protected Eastern Golden Eagles will be killed. A first-order approximation1 is to scale those numbers to the total capacity projected for the Draft Scoping Plan. This back of the envelope approximation suggests that at least 216 Bald Eagles could be killed every year when there are 9,445 MW of on-shore wind. There were 426 occupied bald eagle nest sites in New York in 2017. In my comments on this topic I stated that the Final Scoping Plan must include proposed thresholds for unacceptable environmental impacts like this. There has been no response whatsoever to my comment.
When New York’s GHG emissions are considered relative to global emissions I conclude that New York only action is pointless. In the presentation I compared New York emissions to global emissions in two graphs. I used CO2 and GHG emissions data for the world’s countries and consolidated the data in a spreadsheet. I used the New York State GHG data set CO2e AR4 100 year global warming potential GHG values for consistency. Plotted on the same graph New York GHG and CO2 emissions cannot be differentiated from zero.
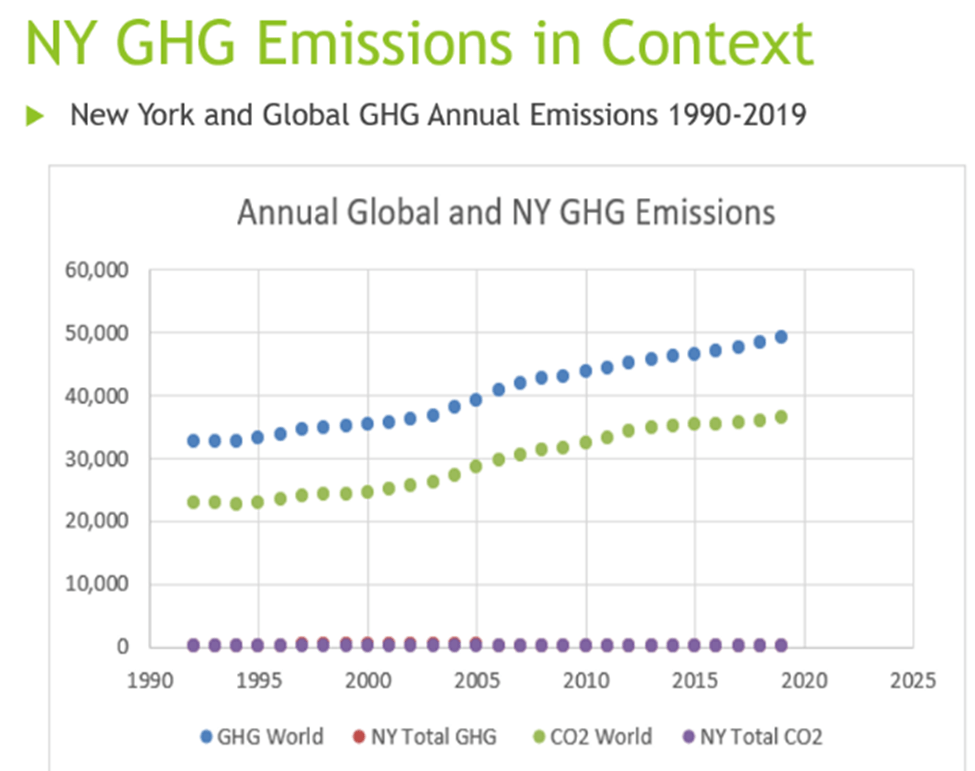
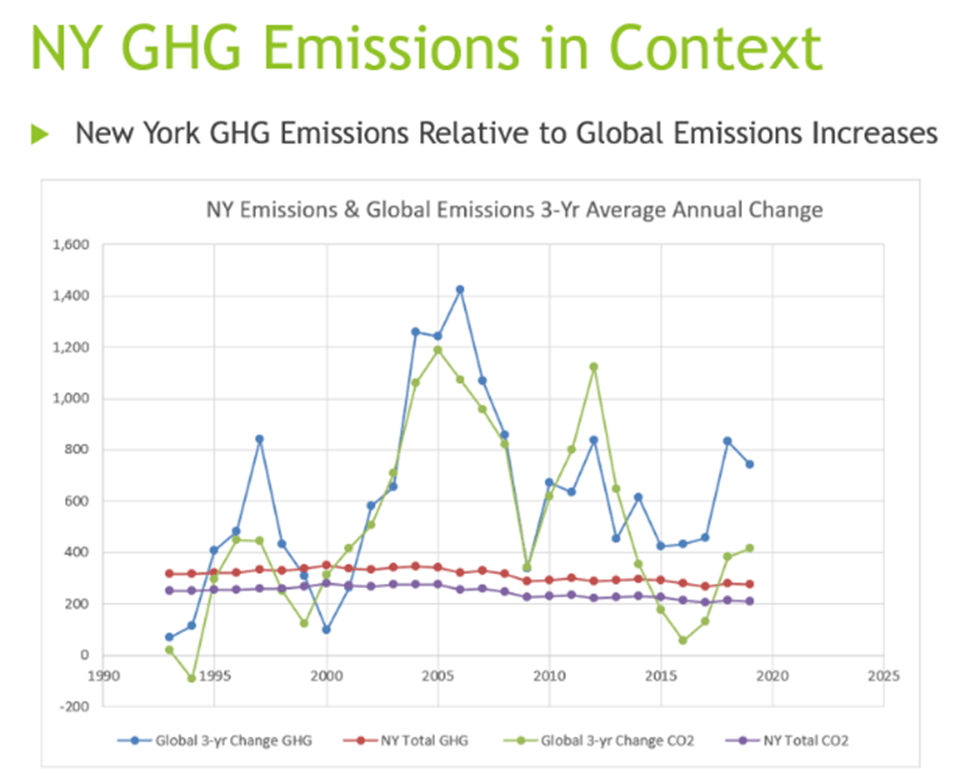
When the New York emissions are plotted relative to global emission increases the futility of New York affecting global emissions is shown. The trend results indicate that the year-to-year trend in GHG emissions was positive 21 of 26 years and for CO2 emissions was positive 24 of 30 years. In order to show this information graphically I calculated the rolling 3-year average change in emissions by year. New York’s emissions are only 0.45% of global emissions and the average change in three-year rolling average emissions is greater than 1%. In other words, whatever New York does to reduce emissions will be supplanted by global emissions increases in less than a year.
Climate Act advocates frequently argue that New York needs to take action because our economy is large. I analyzed that claim recently and summarized the data here. The 2020 Gross State Product (GSP) ranks ninth if compared to the Gross Domestic Product (GDP) of countries in the world. However, when New York’s GHG 2016 emissions are compared to emissions from other countries, New York ranks 35th. More importantly, a country’s emissions divided by its GDP is a measure of GHG emission efficiency. New York ranks third in this category trailing only Switzerland and Sweden.
Despite the fact that the ostensible rationale for GHG emission reduction policies is to reduce global warming impacts, the Draft Scoping Plan continues an unbroken string of the Administration not reporting the effects of a policy proposal on global warming. The reason is simple. The change to global warming from eliminating New York GHG emissions are simply too small to be measured much less have an effect on any of the purported damages of greenhouse gas emissions. I have calculated the expected impact on global warming as only 0.01°C by the year 2100 if New York’s GHG emissions are eliminated.
Conclusion
My presentation explained why I am skeptical of the value of the Climate Act. Attempting to get to zero emissions is an extraordinary challenge that is downplayed by the Climate Act, the Council and the Draft Scoping Plan so most people are unaware of the likelihood of success. The experts say we need DEFR but it has to be developed for New York in less than a decade which I believe is unlikely. There is no reason to expect that the costs won’t be huge despite the Hochul Administration’s cover up of costs and benefits. The cumulative impacts of the required renewable developments have not been evaluated and could be unacceptable. There is no plan for implementation so there are going to be problems. Finally, what is going to happen when we have electrified everything and there is an ice storm? Extreme weather events can have devastating consequences on a more fragile wind and solar electricity network. I am particularly worried about ice storms. On a local level it is not clear how the public will be able to survive a multi-day power outage caused by an ice storm when the Climate Act mandates electric heat and electric vehicles but the bigger reliability concern is that fact that ice storms can take out transmission lines. The January 1998 North American ice storm struck the St Lawrence valley causing massive damage and required weeks to reconstruct the electric grid. When everything is electrified how will it be possible to rebuild?


One thought on “Skeptical Overview of the Climate Act Presentation”