

I recently stumbled upon an old New York State Energy Research and Development Authority report describing the first New York industrial wind facility. This post compares the projections for the facility with the observed performance.
I have followed the Climate Leadership & Community Protection Act (Climate Act)since it was first proposed, submitted comments on the Climate Act implementation plan, and have written over 400 articles about New York’s net-zero transition. The opinions expressed in this article do not reflect the position of any of my previous employers or any other company I have been associated with, these comments are mine alone.
Overview
The Climate Act established a New York “Net Zero” target (85% reduction in GHG emissions and 15% offset of emissions) by 2050. It includes an interim 2030 reduction target of a 40% reduction by 2030 and a requirement that all electricity generated be “zero-emissions” by 2040. The Climate Action Council (CAC) was responsible for preparing the Scoping Plan that outlined how to “achieve the State’s bold clean energy and climate agenda.” In brief, that plan is to electrify everything possible using zero-emissions electricity. The Integration Analysis prepared by the New York State Energy Research and Development Authority (NYSERDA) and its consultants quantifies the impact of the electrification strategies. That material was used to develop the Draft Scoping Plan outline of strategies. After a year-long review, the Scoping Plan was finalized at the end of 2022. Since then State agencies and the legislature have been attempting to implement the plans.
Madison Wind Farm
According to its Wikipedia page:
The Madison Wind Farm is a power generation plant located in the town of Madison, New York. Constructed in 1999-2000, it was the first wind farm completed in New York state and the first merchant wind farm in the country. The power plant consists of seven Vestas V66-1.65 MW wind turbines,[1] generating enough energy to power up to 10,000 homes. The Vestas V66-1.65 MW wind turbines have a hub height of 67m and a 66m rotor diameter totally 100m to the top of the rotor
It is now owned by EDP renewables. There have been maintenance issues and talk of decommissioning but could not find anything to confirm that.
The Madison Windpower Project Final Report was prepared for NYSERDA by AWS Scientific, Inc. December 2003. The Abstract for the report stated that:
This report covers the development and operation of the Madison Windpower Project in Madison County, New York developed by PG&E Generating. The project began commercial operation in October 2000 and consists of seven Vestas V66-1.65 MW OptiSlip® wind turbines for a total capacity of 11.55 MW. Long term wind resource estimates predicted an annual hub-height average wind speed of 7.3 m/s. The net annual plant energy production was predicted to be 23,621 MWh, which would produce a capacity factor of 23.3%. The wind turbines were dispatched and controlled from the PG&E Pittsfield operations center, which was also responsible for substation maintenance. Vestas took charge of inspection, adjustment, and repair of the turbines (both scheduled and unscheduled) and established an operations and maintenance facility in the Madison area. The wind plant produced a total of 61,379 MWh of electricity for three years for an annual average of 20,460 MWh and an overall capacity factor of 21%. The capacity factor is lower than the expected value of 23.3% primarily due to lower than predicted wind speeds and turbine and grid outages.
Observed Operations
The New York Independent System Operator (NYISO) prepares a report describing load and capacity data for all New York generating units that participate in the electric market. Universally known s the “Gold Book” it is the best reference for New York electric generation data. The 2024 Load & Capacity Data Report presents load and capacity data for 2024 and future years. To prepare this summary of Madison Wind Farm operations I relied on a compilation of observed data from Gold Book reports dating back to 2006.
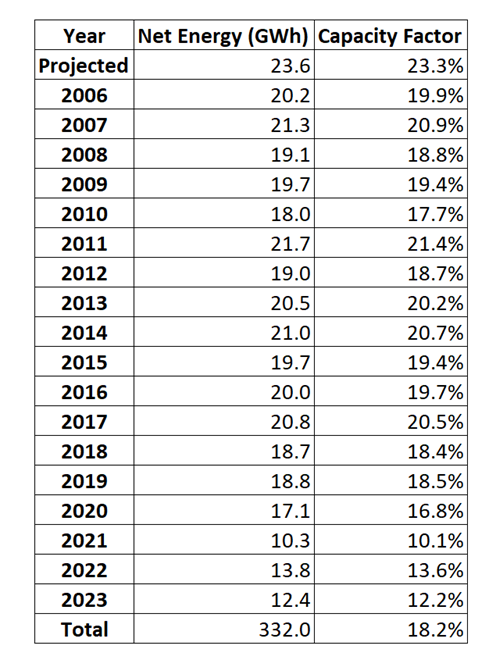
The following table lists the observed net energy (GWh) and capacity factors from 2006 to 2023 and the projections made in 2003 by AWS. In that analysis the observed capacity factor was 21% in the first three years. Since then, only one year achieved that level and the last three years the capacity factor was less than 14%. AWS projected that 425 GWh would be produced since 2006 but the energy produced by this facility was only 332 GWh, 22% less.
Table 1: Madison Wind Farm Performance Based on NYISO “Gold Book” Load & Capacity Data Report Table III-1 Including AWS 2003 Projections
The Conclusion of the AWS report summarizes the key findings:
The experience at Madison shows that the energy production from a wind facility is primarily dependent on the actual wind experienced and the performance and reliability of the turbines. The Vestas V66 turbines performed well when they were online because they produced the expected amount of energy for a given windspeed. However, the actual wind speeds experienced during the period and the reliability of the turbines were both lower than expected.
The wind speeds were lower than expected due to the incomplete meteorological record used to predict the wind resource, the lower-than-average wind speeds in this region of the state during plant operation, and the difference in elevation of the project met towers. This experience demonstrates the need to have sufficient long-term meteorological data in order to predict a wind plant’s energy production accurately. Continued evaluation of the projected wind speeds during plant operation can clarify trends and enhance understanding of the site’s wind resource. As such, it is expected that the overall wind resource at Madison will be more favorable during the lifetime of the plant.
The reliability of the machines was lower than expected due to the gearbox failures and other component difficulties discussed earlier in the report. These failures highlight the need for robust turbine reliability warrantees to protect turbine owners against loss of revenue in the case of such unexpected turbine component failures. On the positive side, excellent lightning protection in the V66 resulted in fewer outages due to static discharge than have been observed at other sites.
Discussion
As the first industrial wind facility Madison Wind Farm performance was evaluated in the AWS project. The report claims that it was a successful demonstration of large-scale wind development. I agree that it provides power and the information learned from it has been used to integrate other projects. However, I have concerns about the poor availability and decreasing capacity factors.
It was obvious at the time of the analysis that the projected capacity factor was lower than projected. The report argues that this was due to inadequate meteorological monitoring but optimistically notes the wind resource will be “more favorable during the lifetime of the plant”. That did not happen. The actual production since 2006 is 22% lower than they anticipated.
I think over-optimism is a characteristic of NYSERDA. The NYSERDA Integration Analysis projected a state-wide wind capacity factor of 29% in 2020 increasing to 34% in 2030. The Gold Book statewide capacity factor in 2020 was 23.9%. The Integration Analysis projected New York land-based wind in 2030 would generate 5,043 GWh but the actual production was only 4,162 GWh, 18% lower than they projected. In addition, the Integration Analysis did not acknowledge that as wind systems age their performance drops.
NYSERDA’s Integration Analysis quantified the generating resources that will be needed to meet the Climate Act mandates. However, comparison of observed and projected energy production shows that they have overestimated energy production which means that more wind capacity will have to be developed and that the costs will necessarily be higher than they projected. Unfortunately, there has not been any reconciliation between Integration Analysis projections and observations to refine their projections. This is in keeping with their complete lack of response to technical issues raised in comments on the Scoping Plan.
Conclusion
The performance of the first wind farm in New York is considerably less than projected. This is consistent with the observed and projected Integration Analysis 2020 statewide wind generation. These results should be used to refine the Scoping Plan but there is no indication that NYSERDA is considering such an effort. This is just one more example of the flaws hidden behind a veneer of political slogans that claim all is well with the Climate Act. Eventually it will become obvious that the Hochul Administration electric system “plan” is incompatible with reality. Unfortunately failing to address these issues promptly will increase costs and reliability risks

“I think over-optimism is a characteristic of NYSERDA.”
Apparently hope springs eternal at NYSERDA. However, maybe taller and bigger is better than shorter and smaller.
LikeLiked by 1 person
Its been 18 years for the Madison blades to lose their productive aerodynamic lift at the rate of 1 to 2 percent per year, as per a wind industry report on blade life. Wind facilities in my part of NYS are seeing blade replacements at 10 years. Leading edge erosion freeze/thaw, lightning and other wear and tear account for the replacements. At 10 to 12 percent capacity factor Madison verges toward net power loss when adding parasitic draw from the grid required at all times. We are restricted to best-guess calculations on grid loss, but 8 to 10 percent of capacity factor is plausible. After 20 years of trying to figure this out we might consider that an acredited loss can’t be computed. Otherwise where is the disgruntled former wind industry insider who is paid-off to reveal the formula. KVAR is a tough nut to crack when trying to measure power use of induction motors in variable, intermittent applications.
LikeLiked by 2 people