

The Regional Greenhouse Gas Initiative (RGGI) is a market-based program to reduce emissions from electric generating units. On December 18, 2025, New York State Energy Research & Development Authority (NYSERDA) hosted a meeting (agenda, recording) to present proposed changes to the RGGI Operating Plan Amendment (“Amendment”) for 2026. This post describes the trend of New York’s RGGI emissions that I will use as part of my comments on the draft Amendment.
I have been involved in the RGGI program process since it was first proposed prior to 2008. I blog about the details of the RGGI program because very few provide any criticisms of the program. There is no upside for companies affected by RGGI to disparage the program because it has become a sacred cow initiative that is treated as beyond criticism by agencies and activists. I have extensive experience with market-based programs because I have worked on analysis, implementation, and evaluation of every program affecting electric generating facilities in New York including RGGI and several Nitrogen Oxide programs. The opinions expressed in these comments do not reflect the position of any of my previous employers or any other organization I have been associated with, these comments are mine alone.
Background
RGGI is a market-based program to reduce greenhouse gas emissions (GHG) (Factsheet). It has been a cooperative effort among the states of Connecticut, Delaware, Maine, Maryland, Massachusetts, New Hampshire, New York, Rhode Island, and Vermont to cap and reduce CO2 emissions from the power sector since 2008. New Jersey was in at the beginning, dropped out for years, and re-joined in 2020. Virginia joined in 2021 but has since withdrawn and Pennsylvania recently withdrew completely.
According to a RGGI website:
The RGGI states issue CO2 allowances that are distributed almost entirely through regional auctions, resulting in proceeds for reinvestment in strategic energy and consumer programs.
Proceeds were invested in programs including energy efficiency, clean and renewable energy, beneficial electrification, greenhouse gas abatement and climate change adaptation, and direct bill assistance. Energy efficiency continued to receive the largest share of investments.
Proponents of RGGI claim the program has “successfully lowered CO2 emissions intensity and absolute emissions”. This post will show that this conclusion is not reflected in the New York emissions trends. In a subsequent post I will explain that ignoring the lessons of the observed reductions is leading to investment strategy decisions in the NY RGGI Operating Plan that will eventually cause serious problems. Proposed investment descriptions include beneficial electrification, climate change adaptation, and direct bill assistance that do not reduce electric sector emissions.
New York RGGI Emissions
This analysis of annual New York CO2 emissions from electric generating units uses data from the EPA Clean Air Markets Program Data (CAMPD) database. I downloaded unit-level data for all pollution control programs so that I can compare emissions from the start of RGGI in 2009 to a baseline before the program started. The data include a record describing the primary fuel type These records are not standardized and include more categories than I need so I consolidated the labels as shown in Table 1.
Table 1: Consolidated Primary Fuel Type Labels
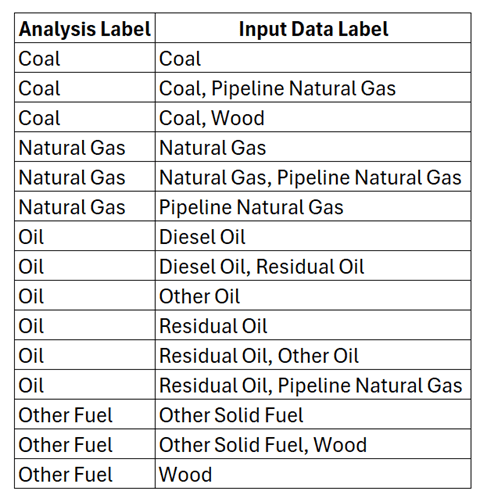
Table 2 lists the annual emissions since 2000 through 2024. Claims that the program has “successfully lowered CO2 emissions intensity and absolute emissions” are debunked in the following table and figure. This table lists mass CO2 emissions by fuel type along with the emission rate or intensity. Both absolute and emissions intensity do go down.
Table 2: New York Clean Air Markets Program Data Emissions Data for All Regulatory Programs
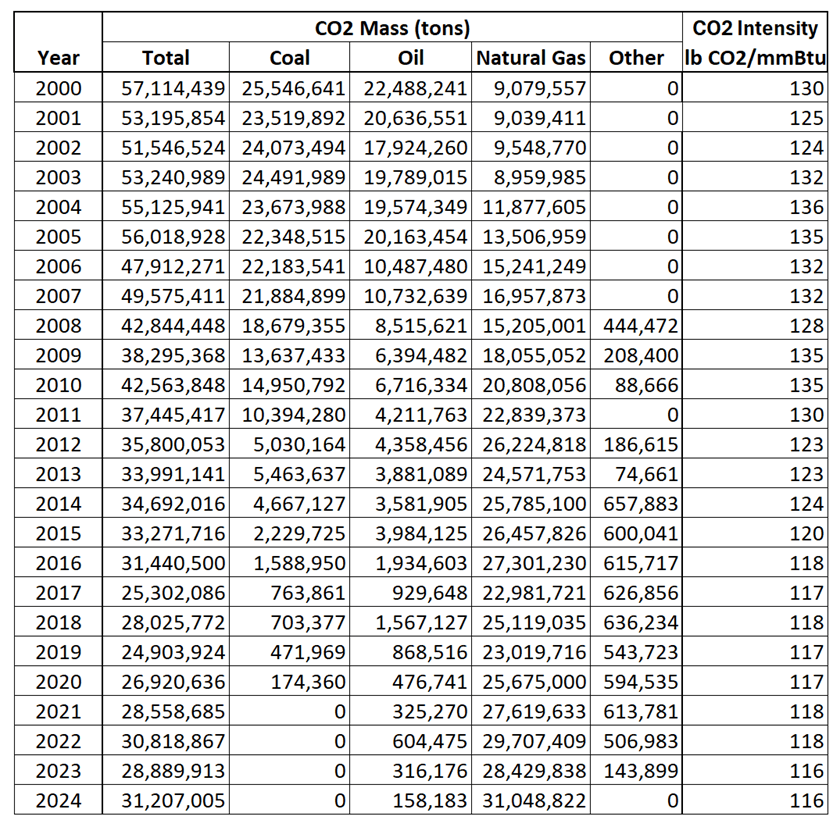
Figure 1 clearly shows the role of fuel switching away from coal and oil and the increasing use of natural gas. I believe that the fuel price differential for natural gas use was much greater than the added cost of RGGI allowances and thus the main driver of the observed reductions is economic fuel switching. This figure labels the 2006 to 2008 period that I use as the baseline for “before RGGI”, the start of RGGI, and when the possibility of additional fuel switching became impossible. If RGGI were the primary driver of emission reductions, then emission reductions would have continued to decrease after the lowest emissions in 2019, and they certainly would not have been increasing since then. The other big takeaway from this is that 2019 was the year that the inane premature retirement of the Indian Point nuclear station began. New York has not managed to replace generation from this zero emissions resource as emissions continue to rise.
Figure 1: New York Clean Air Markets Program Data Emissions Trend by Fuel Type
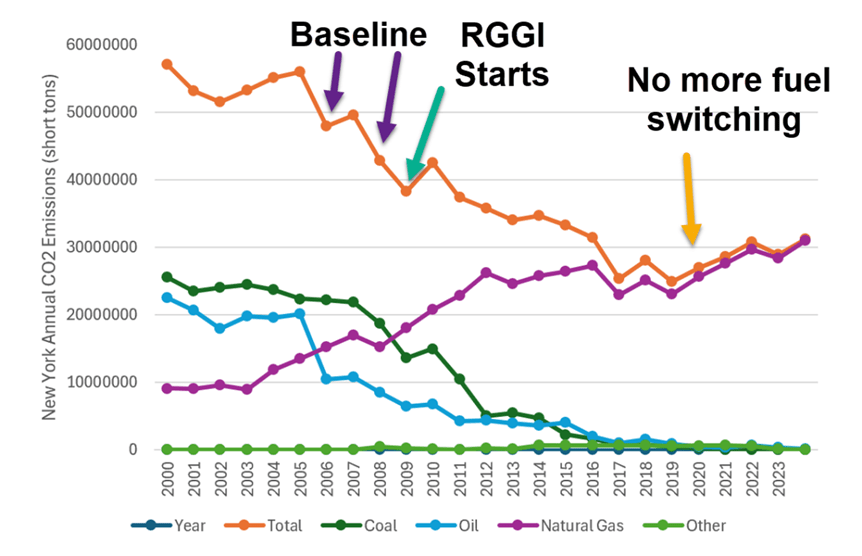
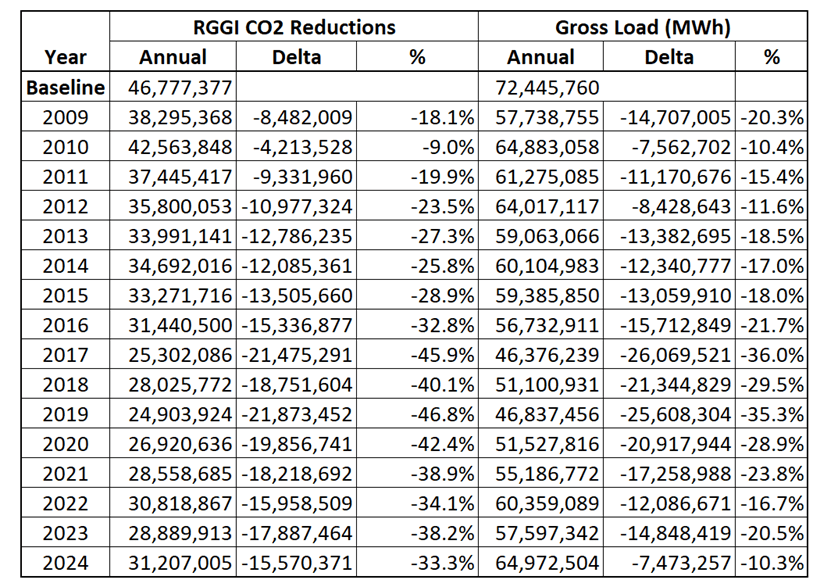
Table 3 lists the emissions reductions since the start of the RGGI program. I included this because it shows that in 2024 CO2 emissions since the start of RGGI are 33% lower. Also note that in 2019 emissions were 47% lower. I included the gross load to show that gross load also decreased. In theory this could represent displacement of fossil fired units because of RGGI investments. In my next post I will update last year’s analysis of the effect of RGGI investments that shows that is not the reason. NYSERDA program funding status reports estimate the emission savings from their program investments. Last year I showed that the total cumulative annual emission savings due to NYSERDA program investments through the end of 2023 that directly or indirectly affect electric generating source emissions is 1,405,513 tons. That means that emissions from RGGI sources in New York would have been only 3% higher if the NYSERDA program investments did not occur. I do not expect that this will change using the 2024 data.
Table 3: New York RGGI Emissions and Gross Load Reductions Since Start of RGGI
Discussion
I have two overarching concerns about the implications of RGGI emission reduction performance. Firstly, the RGGI cap on emissions essentially rations energy use because if there are insufficient permits to emit (aka allowances) affected generating units have no other options to reduce emissions so they can only shutdown to comply with the law. If replacement zero emissions generating resources are unavailable, then the electric grid would be placed in an artificial energy shortage that would lead to blackouts. Therefore, in my comments on the NYSERDA operating plan I will argue that programs that lead to emission reductions should be prioritized to prevent energy rationing.
My second concern is that idolatry of the RGGI as a program that should be replicated because of its success was a primary driver of the Climate Leadership & Community Protection Act’s Scoping Plan recommendation for an economy wide cap-and-invest program. In my last update on the New York Cap-and-Invest (NYCI) program I explained that there is potential for a judge to order that NYCI be implemented. These data show that this magical solution will not work as advertised.
Finally, I want to put the historical and projected generating load in perspective relative to RGGI and NYCI. The New York Independent System Operator(NYISO) annual load and capacity data report universally known as the “Gold Book” provides input for a couple of relevant graphs in NYISO 2025 Gold Book Forecast Graphs.
Figure 2 lists historical and weather normalized annual loads from 2015 to 2024. These observed loads closely track the RGGI electric generating unit loads. The scary issue is that NYISO is projecting significant increases in load going forward without the addition of large load facilities. The load increases are associated with electrification strategies associated with the Climate Act.
Figure 2: NYISO Historical New York Control Area (NYCA) Annual Energy and 10-Year Forecasts (GWh)
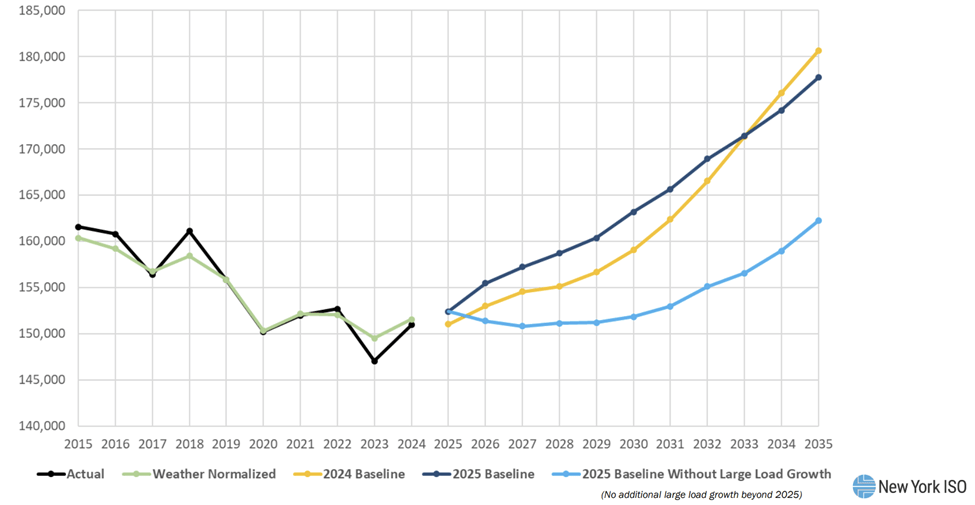
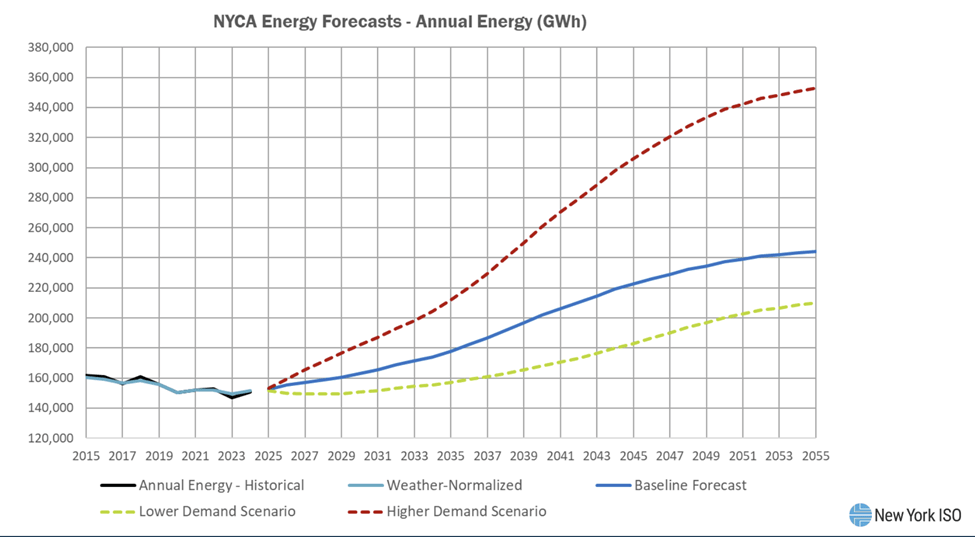
Figure 3 also lists historical and weather normalized annual loads from 2015 to 2024 but includes “additional load growth from large loads”. This increases the 2035 baseline around 17,000 GWh or another 10%. This would make it all the more difficult to provide sufficient zero-emission generating resources to comply with the Climate Act mandate to have a 100% zero-emission electric grid by 2040.
Figure 3: NYISO Historical New York Control Area (NYCA) Annual Energy and 10-Year Forecasts (GWh)
Conclusion
This analysis clearly shows that the primary driver of observed emission reductions from RGGI electric generating units was fuel switching. These results are consistent with similar analyses that I have prepared regarding RGGI emission reductions. I will incorporate these findings in my comments on the 2026 RGGI Operating Plan Amendment stating that this observations should be reflected in the Operating Plan just like I have for the last several years. I fully expect that NYSERDA will ignore my comments again and will continue to make investments to appease political constituencies. Political interference in energy policy will eventually fail, it is only a matter of time.
