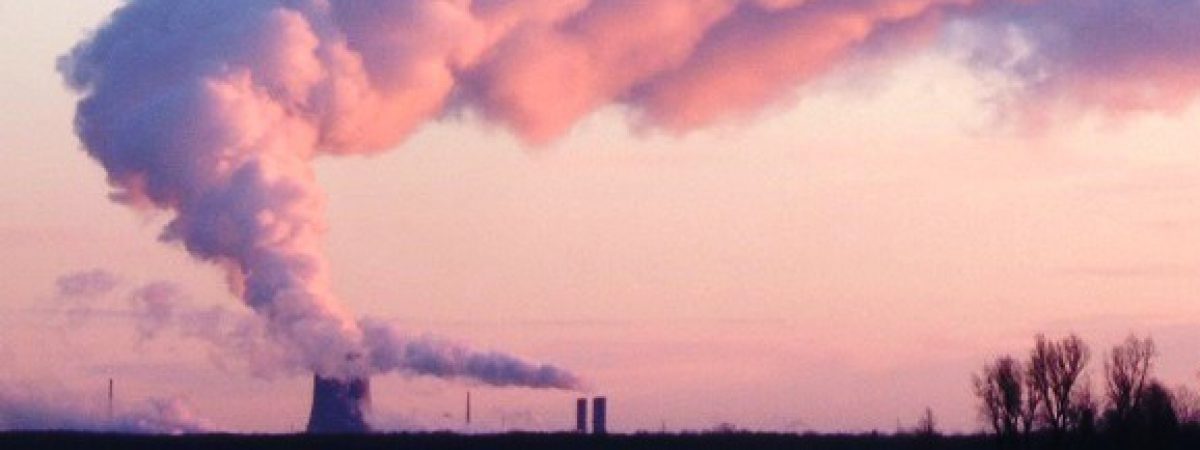
A recent Associated Press story noted that “For the 10th consecutive month, Earth in March set a new monthly record for global heat — with both air temperatures and the world’s oceans hitting an all-time high for the month, the European Union climate agency Copernicus said.” It went on to state that “Climate scientists attribute most of the record heat to human-caused climate change from carbon dioxide and methane emissions produced by the burning of coal, oil and natural gas.” This post provides evidence that human-caused climate change was not the primary cause for the records.
The rationale used for New York’s Climate Leadership & Community Protection Act (Climate Act) that reducing GHG emissions will affect climate is of special interest to me. However, I question whether we know enough about natural climate variability to legitimately make that claim. I have followed the Climate Act since it was first proposed, submitted comments on the Climate Act implementation plan, and have written over 400 articles about New York’s net-zero transition. The opinions expressed in this post do not reflect the position of any of my previous employers or any other organization I have been associated with, these comments are mine alone.
Observed Climate Variability
The video Climate the Movie: The Cold Truth includes a very good description of historical temperatures and CO2 trends. It provides examples why claims that today’s observations indicate unprecedented heat in earth’s history are wrong. In geologic time scales temperatures today are not at all unusual and because we are in an ice age all previous non-ice age geologic epochs were warmer. Over the last 2,000 years there also have been periods of warmer temperatures. The video goes on to compare CO2 trends over those periods to show that there is no link.
In a recent post I addressed the basic tenet of anthropogenic global warming catastrophists, like the authors of the Climate Act, that the correlation between CO2 and global warming evident since 1976 proves that CO2 is the control knob for climate. Andy May prepared an Annotated Bibliography for Climate the Movie that includes a section titled “From 1945 to 1976 the world cooled”. It includes the following plot of global temperatures and carbon dioxide. Climate Act proponents believe that increasing temperatures since the end of the Little Ice Age are caused by increases in CO2. This graph does not support that claim. From 1850 to 1910 temperatures trend slightly down and CO2 trends slightly up. From 1910 to 1944 there is little change in the CO2 trend but the temperature trends up markedly. CO2 emissions don’t start to rise significantly until the end of World War II in 1945 but from 1944 to 1976 the global temperature trends down. For the remaining two periods shown in the graph temperature and CO2 correlate well.
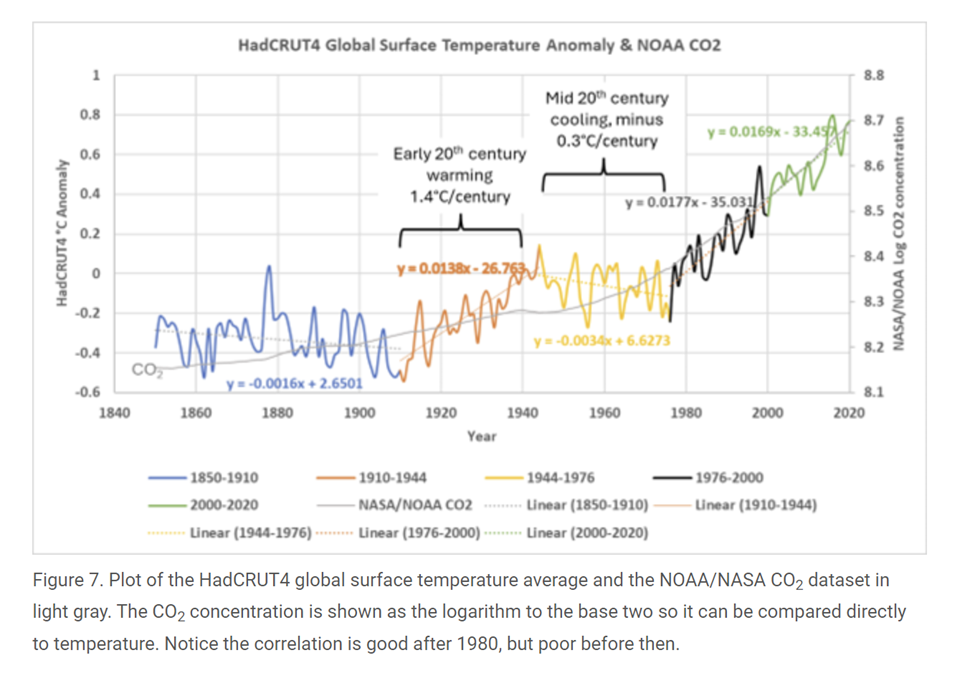
The caption highlights the key point. There is good correlation between CO2 concentrations in the atmosphere after 1980 but the correlation is poor before that. I believe this shows that natural climate variation caused the 1910 to 1944 warming. I do not believe that anyone has proven that the same natural climate drivers are not affecting the recent warming.
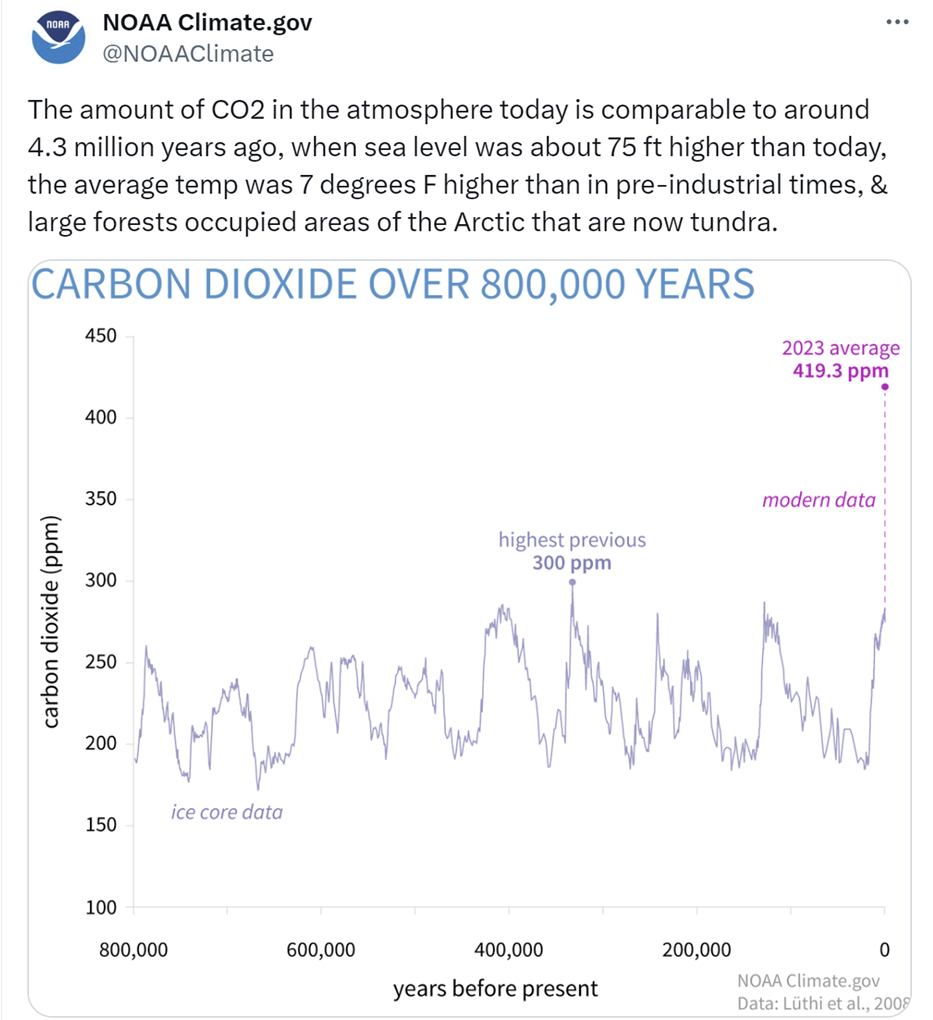
The National Oceanic and Atmospheric Administration (NOAA) recently posted a comment that contradicts the existential threat narrative and supports those who argue natural climate variability is the main driver of climate change. It states that “The amount of CO2 in the atmosphere today is comparable to around 4.3 million years ago, when sea level was about 75 ft higher than today, the average temp was 7 degrees F higher than in pre-industrial times, & large forests occupied areas of the Arctic that are now tundra.” Climate the Movie shows that going back further in time that CO2 levels were much higher than today. It is not clear to me why there is supposed to be an existential threat to society when temperature and CO2 concentrations were higher in the past and the ecosystems survived.
Recent Warming
The claims for recent global temperature records reference NASA satellite data. This data set only goes back to 1979 but it provides the greatest representative coverage of the globe because it does not depend on randomly spaced surface measuring stations. In the following graph note the large spike in recent months.
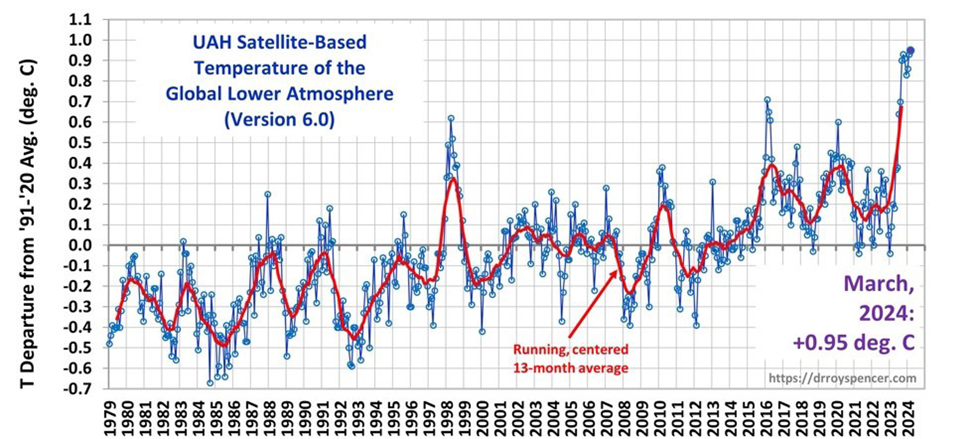
Note that the spikiness in these measurements is not reflected in the atmospheric concentrations of CO2 measurements. According to NOAA’s CO2 measurements:
The global surface concentration of CO2, averaged across all 12 months of 2023, was 419.3 parts per million (ppm), an increase of 2.8 ppm during the year. This was the 12th consecutive year CO2 increased by more than 2 ppm, extending the highest sustained rate of CO2 increases during the 65-year monitoring record. Three consecutive years of CO2 growth of 2 ppm or more had not been seen in NOAA’s monitoring records prior to 2014. Atmospheric CO2 is now more than 50% higher than pre-industrial levels.
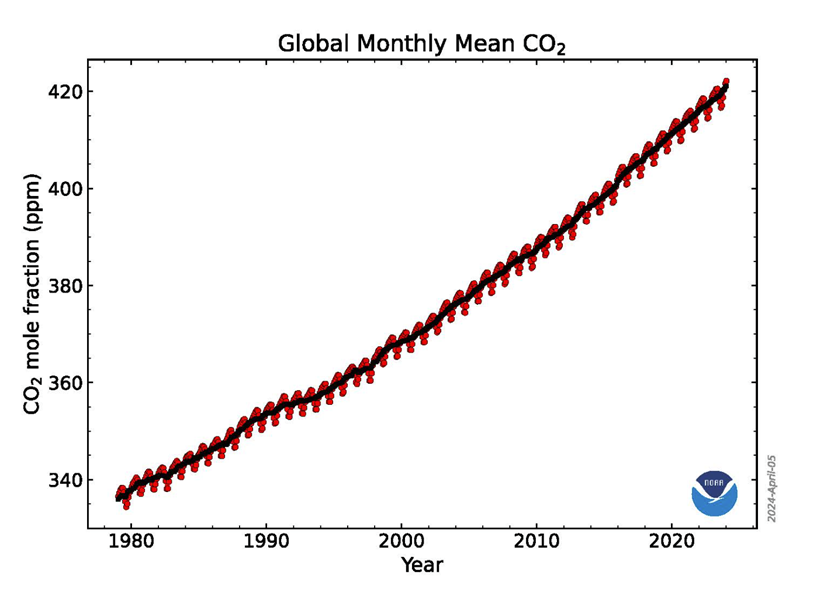
If CO2 really is the control knob, then why is there so much inter-annual variation in temperature at the same time there is so little variation in the CO2 trend? The only possible explanation activists have is that there are some natural variation processes. Picking and choosing CO2 as the cause of the increasing trend while simultaneously acknowledging that there also are natural processes affecting the observed temperatures does not seem to be a particularly strong position to me.
Most Recent Warming
The Associated Press article claimed that “Climate scientists attribute most of the record heat to human-caused climate change from carbon dioxide and methane emissions produced by the burning of coal, oil and natural gas.” The reality is that not all climate scientists support the claim that most of the record-breaking heat was caused by anthropogenic greenhouse gases.
Javier Vinós described the recent warming explaining that this spike in temperatures marked the warmest period recorded by instruments and that the recent change was exceptional. He found that “the temperature increase from the previous record was the largest in 153 years, at +0.17°C. This level of increase from previous records is remarkable, even for a year that has been recorded as the warmest on record.” If there had been a spike in GHG emissions that preceded this warming spike, then I would be more supportive of the CO2 is the control knob theory. It turns out that there was no spike in human emissions but there was a natural spike. The Tonga-Hunga underwater volcanic eruption blasted unprecedented amounts of water vapor into high levels of the atmosphere. Water vapor is more effective than CO2 as a greenhouse gas so this could be part of the reason for the recent warming spike.
There is another natural phenomenon likely responsible for some of the warming. Surface water temperatures in the Pacific Ocean oscillate between warm (El Niño) and cold phases (La Niña ) of the El Niño-Southern Oscillation or “ENSO”. The winter of 2023 occurred during an El Niño when the ocean releases heat into the atmosphere and has been associated with marked increases in global temperatures. However, the 2023 El Niño was a weak year so its contribution to the observed warming was minimal.
In an article entitled “State of the climate – summer 2023“, Judith Curry examined the top of the atmosphere radiation balance. As of June 2023, her analysis suggests that the water vapor increase in long-wave radiation warming from the Tonga-Hunga underwater volcanic eruption was offset by the short-wave aerosol particle cooling. She gave other reasons for the observed warming records:
The exceptionally warm global temperature in 2023 is part of a trend of warming since 2015 that is associated primarily with greater absorption of solar radiation in the earth-atmosphere system. This increase in absorbed solar radiation is driven by a slow decline in springtime snow extent, but primary by a reduction in reflection from the atmosphere driven by reduced cloudiness and to a lesser extent a reduction in atmospheric aerosol. Any increase in the greenhouse effect from increasing CO2 (which impacts the longwave radiation budget) is lost in the noise.
She lists three reasons for the warming. The slow decline in springtime snow extent has been linked to the warming trend as we come out of the Little Ice Age. Clouds affect global temperatures. Within the atmosphere more low clouds reduce temperatures by reflecting more sunlight but increased high clouds increase temperatures. Particles or aerosols also scatter light and can affect temperatures by blocking sunlight. She attributes the observed warming to the reduction in reflection from the atmosphere driven by reduced low-level cloudiness and to a lesser extent a reduction in atmospheric aerosol particles. Low-level cloudiness trends are not well understood and are not included in climate models. The aerosol changes are attributed to changes in the sulfur content of ship fuel. Most importantly, she points out that increasing CO2 effects are “lost in the noise” which directly contradicts the Associated Press article.
Conclusion
The rationale for the multi-billion Climate Act net-zero transition is the alleged link between climate change and greenhouse gas emissions. Undoubtedly the emissions increases have some greenhouse effect on global temperatures, but the effects of natural climate variability not only must have been responsible for all of the historical variations in global temperatures but also appear to be the primary driver even during the most recent period when carbon dioxide emissions and global temperatures are well-correlated. The rationale for the Climate Act transition is weak at best.
