

This post was updated on 10/24/22 to replace the second graph included and include data to 2019
The Climate Leadership and Community Protection Act (Climate Act) establishes a “Net Zero” target by 2050. The Draft Scoping Plan defines how to “achieve the State’s bold clean energy and climate agenda” and claims that there are significant direct and indirect benefits if New York’s greenhouse gas emissions (GHG) are reduced to net-zero but there is no mention of New York’s emissions relative to the rest of the world. I explained that any claim of benefits is illusory because in the context of global impacts New York’s contribution is miniscule. This short post puts the numbers into a couple of graphs.
Everyone wants to do right by the environment to the extent that they can afford to and not be unduly burdened by the effects of environmental policies. I submitted comments on the Climate Act implementation plan and have written extensively on New York’s net-zero transition because I believe the ambitions for a zero-emissions economy embodied in the Climate Act outstrip available renewable technology such that this supposed cure will be worse than the disease. The opinions expressed in this post do not reflect the position of any of my previous employers or any other company I have been associated with, these comments are mine alone.
New York and Global GHG Emissions
The purpose of this post is to illustrate how New York GHG relate to global emission increases. I found CO2 and GHG emissions data for the world’s countries and consolidated the data in a spreadsheet earlier this year. I downloaded the data again for this post and found data out to 2019. The following graph shows global and CO2 emissions for the world and New York plotted on the same graph. New York emissions are essentially zero.

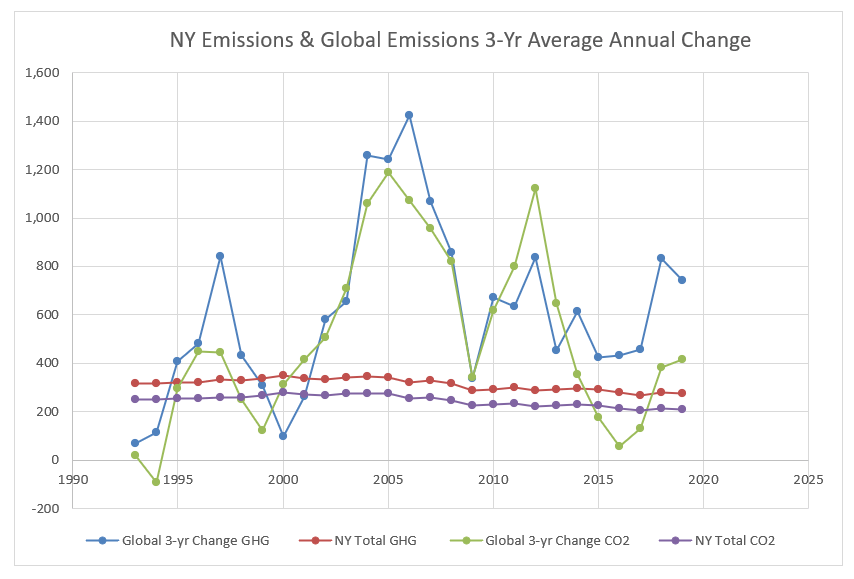
The trend results indicate that the year-to-year trend in GHG emissions was positive 21 of 26 years and for CO2 emissions was positive 24 of 30 years. In order to show this information graphically I calculated the rolling 3-year average change in emissions by year. The following graph shows that rate of change in emissions has been consistently higher than New York emissions since 1990.
Conclusion
By any measure New York’s complete elimination of GHG emissions is so small that there will not be any effect on the state’s climate and global climate change impacts to New York. I previously showed that although New York’s economy would be ranked ninth relative to other countries, New York’s emissions are only 0.45% of global emissions which ranks 35th. This post graphically shows New York emissions are negligible compared to global emissions. The change to global warming from eliminating New York GHG emissions is only 0.01°C by the year 2100 which is too small to be measured much less have an effect on any of the purported damages of greenhouse gas emissions. Finally, this post shows global emissions have increased more than New York’s total share of global emissions consistently since 1990. In other words, whatever New York does to reduce emissions will be supplanted by global emissions increases in a year.
The only possible conclusion is that the Climate Act emissions reduction program is nothing more than virtue-signaling. Given the likely significant costs, risks to reliability, and other impacts to New York society, I think that the schedule and ambition of the Climate Act targets needs to be re-assessed for such an empty gesture.

One thought on “Climate Act Emissions in Graphical Context”