

One of the biggest questions related to Governor Hochul announced plan to use a market-based program to raise funds for the Climate Leadership & Community Protection Act (Climate Act) is the revenue target. I incorporate the latest 2020 GHG emissions inventory data and some other bits of information to follow up on a couple of earlier posts that addressed this issue.
I submitted personal comments on the Climate Act implementation plan and have written over 280 articles about New York’s net-zero transition because I believe the ambitions for a zero-emissions economy embodied in the Climate Act outstrip available renewable technology such that the net-zero transition will do more harm than good. I also follow and write about the Regional Greenhouse Gas Initiative (RGGI) market-based CO2 pollution control program for electric generating units in the NE United States. Before I retired I had extensive experience with air pollution control theory, implementation, and evaluation having worked on every cap-and-trade program affecting electric generating facilities in New York including the Acid Rain Program, RGGI, and several Nitrogen Oxide programs. The opinions expressed in this post do not reflect the position of any of my previous employers or any other company I have been associated with, these comments are mine alone.
Background
The first related article I posted gave my initial impression of the New York cap and invest program. That post gives background information on the Climate Act’s economy-wide strategy and my overarching concerns. I explained that I had evaluated New York’s RGGI auction proceeds funding status report and found that the projected costs of the current programs are $776.1 million, the net greenhouse gas emission savings are 1,656,198 tons and that works out to emission cost per ton removed of $469. If all the RGGI administrative and operating costs are included another $113 million is added to the total and the emissions cost per ton removed is $537 per ton. I also evaluated existing emissions and the reduction trajectory necessary to meet the 2030 Climate Act emissions target. Those numbers will be updated in this post. The post also lists some practical considerations that should be a concern for this initiative.
The second related article determined different annual revenue targets. I determined the emissions reduction trajectory needed to meet the 2040 GHG emissions target, calculated the control cost per ton removed based on the RGGI auction proceed investments, and found that a total of $7.9 billion per year is needed. That is the low-end cost of the projections. At the upper end three projections exceed $45 billion a year. I will update those projections below.
New York GHG Emissions
In order to understand the challenge it is necessary to know where we stand for our GHG emissions. The following table (the link is to the full table because I cannot figure out how to make tables in the text get bigger when a reader clicks on it) lists the New York State GHG emissions (MMT CO2e AR5 20 yr) by sector from the DEC emissions inventory . It also includes the annual change in emissions since 1997.

I evaluated current emissions relative to the 2030 Climate Act target of a 40% reduction by 2030. The following table lists the trajectory of observed, projected, and interpolated emissions consistent with the 2030 requirement to reach 245.87 million metric tons of CO2e. New York State has released the official GHG emissions for New York State for 2018, 2019, and 2020 and they are highlighted in gold. I estimated emissions for 2021 and 2022 using the observed electric generating unit emissions and historical averages for other sectors. Note that emissions increase due to the shutdown of the Indian Point nuclear generating facility. The 2030 levels are fixed and are highlighted in rose. There are six columns that list the emissions trajectory necessary to get from the observed emissions (gold) to the target. The annual reduction in the trajectory is the difference between the observed emissions and the 2030 target divided by the number of years. For example, the estimated GHG emissions in 2021 were 381 million metric tons. If the emissions are reduced by 15 million tons per year, then in 2030 the emissions will meet the target of 245.87 million metric tons. Two projections are listed for 2022 that give bounds to the reductions necessary. One uses the estimated emissions and the other assumes that total state GHG emissions stay constant between 2020 and 2022.

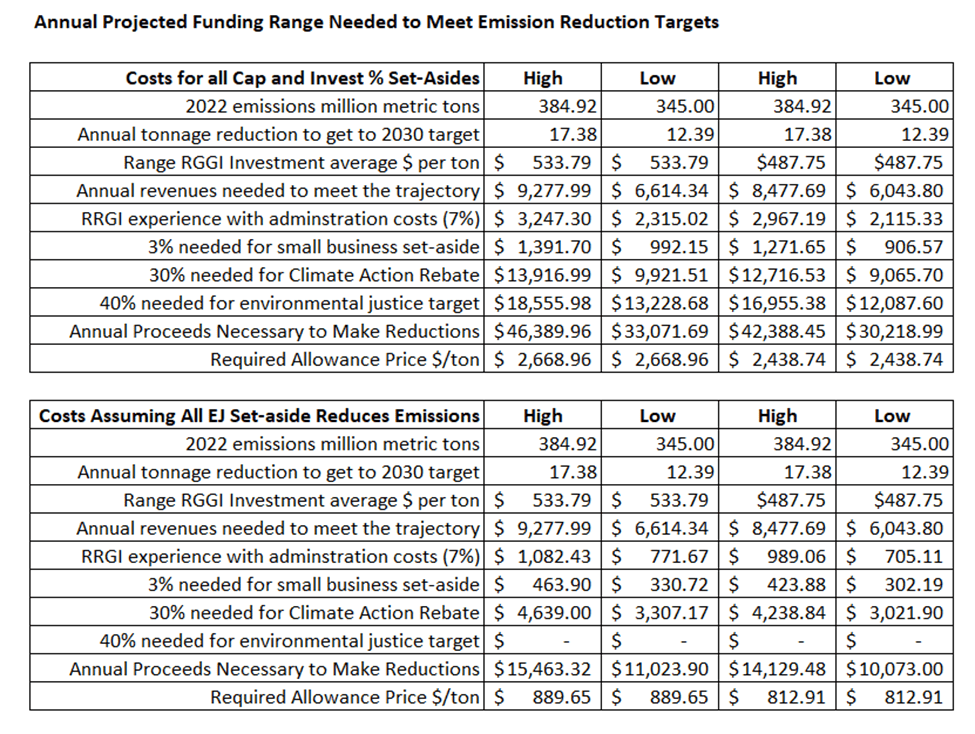
Ostensibly the goal of the cap and invest program is to generate the revenues necessary to make the required reductions. The following table uses the range of 2022 emission estimates (384.92 and 345 million metric tons of CO2e) and the range of cost per ton reduced ($533.79 and $487.75) to place bounds on the required reduction costs. If the assumption is made that all the reduction costs will be financed by auction proceed investments, then the annual revenue needed for the high bound is $9.278 billion and the low bound is $6.044 billion. That assumes that all the money collected is invested. However, Hochul announced that there would be a Climate Action Rebate of 30%. In order to maintain the revenue needed to meet the emission targets that means that the total collected has to increase from $9.278 billion to $12.254 billion increasing the cost per ton reduced to $763. In addition, she announced another 3% for small businesses and, this being New York, I assume that the administrative costs will be the same as the 7% as in RGGI. Incorporating those costs raises the total needed to between $15.463 million and $10.073 billion. That assumes that all the environmental justice targeted money can be invested in reductions that benefit environmental justice communities. If the interpretation of the 40% for environmental justice communities is in addition to the investments needed to meet the reduction targets, then the annual totals increase between $46.390 billion and $30.219 billion.
There are a couple of other potential annual revenue target methodologies. The clearing price at the last RGGI auction was $12.99 and assuming that 385 million allowances were auctioned off the revenues would be $5 billion. The highest auction clearing price would increase revenues to $5.35 billion. Keep in mind that that the allowances auctioned will decrease over time so this is the upper bound. In addition, there are mandates for set asides so that is not a true reflection of the number of allowances that would be auctioned. The annual reductions could also be set to the NYS Value of Carbon which is set at $129 in 2025 and $172 in 2050. The estimates for those revenues range between $1.6 and $3.0 billion.
Discussion
The sectors affected by the Climate Act Cap and Invest Program are most interested in the revenue target for the auction. Regulatory staff claim that they are interested in the emission reductions and not the revenues which would argue for setting the cap at a defensible value that could provide the reductions necessary. There are many issues with this simple approach. It is assumed that there are no other sources of funding to make the reductions. It also assumes that the cost per ton reduced is constant but control programs will increase as control efficiencies necessarily get tighter. There are also issues with how the EJ set-aside is invested and how much money is used for administration.
Conclusion
There is no clear and obvious revenue target. As with all GHG market-based control programs the real concern is that the costs necessary to make reductions are so high that they exceed the Value of Carbon and the likely limits of the public’s willingness to pay.
There is another concern. The Scoping Plan requires an ambitious emission reduction trajectory. Because there are no cost-effective control options for GHG emissions, the reductions will have to come from indirect displacement of fossil-fired energy use or simply reducing fossil-fuel use. The ultimate compliance control strategy is stop operating when there are no allowances available to be had. Energy demand is inelastic so there will be interesting times ahead as this plays out.

4 thoughts on “New York Annual Climate Act Cap and Invest Revenue Targets”