

I recently published a summary of the annual analysis of the Regional Greenhouse Gas Initiative (RGGI) annual Investments of Proceeds report. New York State publishes its own version that I have not bothered to analyze because the reporting metrics are not as clear as the RGGI report. However, the Climate Action Council has recommended: a tax or fee establishing a carbon price or a “cap-and-invest” program similar to RGGI to provide funding for the Climate Leadership and Community Protection Act (Climate Act). Supporters of RGGI claim that it is a successful model to emulate so I decided to evaluate how effective RGGI funding has been to reduce New York carbon dioxide (CO2) emissions.
I have been involved in the RGGI program process since its inception. I blog about the details of the RGGI program because very few seem to want to provide any criticisms of the program. I submitted comments on the Climate Act implementation plan and have written over 250 articles about New York’s net-zero transition because I believe the ambitions for a zero-emissions economy embodied in the Climate Act outstrip available renewable technology such that the net-zero transition will do more harm than good. The opinions expressed in this post do not reflect the position of any of my previous employers or any other company I have been associated with, these comments are mine alone.
This is a long and technical post so I have brought the discussion and conclusion to the beginning.
Discussion
This analysis wades through the New York RGGI funding reports prepared by the New York State Energy Research & Development Authority (NYSERDA). Those reports describe the expected emission (tons CO2e), load (MWhr), and heat input (mmBtu) savings from programs funded by RGGI proceeds. I compared the emission savings to the observed RGGI emissions from 2013 to 2021. The only two programs that directly affect CO2 emissions are the NY-Sun Initiative and NYSERDA Solar Electric programs. All the other programs in the Green Jobs – Green New York, Energy Efficiency, Community Clean Energy, Clean Energy Communities, and Charge NY categories affect CO2 emissions indirectly so the emission savings reductions claimed do not necessarily affect RGGI source emissions.
The observed New York State emissions from RGGI-affected sources decreased between 2013 and 2021 by 5,397,135 tons. If just the CO2 reduction savings that are listed for the NY-Sun Initiative and NYSERDA Solar Electric programs are considered over the years 2013 to 2021, the total investment is $565 million and the claimed savings are 861,442 tons of CO2e with a calculated cost benefit of 565 $/ton. Those CO2 reductions account for 16% of the observed emission reduction. Because observed CO2 emissions from coal-firing went from 5,463,637 tons in 2013 to zero in 2021 and CO2 emissions from oil-firing went from 3,871,162 tons to 313,115 tons, I conclude that the primary reason for the observed electric sector emission reductions in New York was due to fuel switching. I believe that the RGGI cost adder to fuel costs is a much smaller component than the cost of fuel itself so fuel switching was not driven by the cost of RGGI allowances.
There are implications for future emission reduction requirements. Coal and oil emissions from the RGGI affected sources are as low as they are going to get without retirement of oil-fired sources. The average CO2 emissions reduction per year has been 95,716 tons since 2013. New York Part 242 CO2 Budget Trading Program specifies an annual reduction of RGGI allowances of 880,493 per year starting in 2022 and continuing to 2030. That reduction is nearly ten times more than the reductions from RGGI auction proceed investments. The Climate Act is going to require even more emission reductions. It is not clear where those reductions will come from.
Conclusion
RGGI is supposed to be a CO2 emissions reductions control program. Proponents of RGGI brag about the emission reductions observed and the value of auction proceed investments. However, the observed emission reductions are primarily due to fuel switching in New York. NYSERDA has not focused its RGGI proceed investments on emission reductions which has not been a problem to this point but that strategy is about to hit a wall. The RGGI-affected sources have been running more the last two years because the State shut down 2,000 MW of zero-emissions nuclear generating capacity. Couple that with insignificant investment in new zero-emissions generating resources from the RGGI proceeds to ramp up actual electric generating emission reductions, the potential problem is that the RGGI-affected sources will not have sufficient allowances to operate. The RGGI allowance market is so confused now with states coming in and out, the potential problem of insufficient allowances to operate may be kicked down the road. However, there are implications that, so far, have not been acknowledged by the state.
On December 19, 2022 the Climate Action Council approved and adopted the Final Scoping Plan that outlines a plan to make the New York electric system zero-emissions by 2040. I expect that this mandate will be incorporated into the New York electric generating unit emission caps with even more stringent limits. The Scoping Plan proposes to use a “cap and invest” program similar to RGGI to provide funds for the electric system zero-emissions transition by 2040 and the overall net-zero by 2050 target. The ramifications of the poor RGGI-funded program investments record of actually reducing emissions has not been considered. This is yet another example why the ambitions of the Climate Act will flounder on the shoals of reality.
Background
RGGI is a “cooperative effort among eleven Eastern states to reduce carbon dioxide (CO2) emissions from power plants within each participating state” (Factsheet). This market-base program among the states of Connecticut, Delaware, Maine, Maryland, Massachusetts, New Hampshire, New York, Rhode Island, and Vermont set a cap to reduce CO2 emissions starting in 2009. New Jersey was in at the beginning, dropped out for years, and re-joined in 2020. Virginia joined in 2021 and Pennsylvania has joined but is not actively participating in auctions due to on-going litigation. According to a RGGI website: “The RGGI states issue CO2 allowances which are distributed almost entirely through regional auctions, resulting in proceeds for reinvestment in strategic energy and consumer programs. Programs funded with RGGI investments have spanned a wide range of consumers, providing benefits and improvements to private homes, local businesses, multi-family housing, industrial facilities, community buildings, retail customers, and more.”
The Climate Act establishes a “Net Zero” target (85% reduction and 15% offset of emissions) by 2050. The Climate Action Council is responsible for preparing the Scoping Plan that will outline how to “achieve the State’s bold clean energy and climate agenda.” The Scoping Plan was approved by the Council on December 19, 2022. Chapter 17 in the Plan describes economywide strategies:
After initially identifying three options for consideration, the Council narrowed its consideration to two economywide GHG policies: a tax or fee establishing a carbon price and a program that caps emissions across the economy, or within particular sectors, and allocates emission allowances primarily through an auction mechanism that provide revenues for investment, known as “cap-and-invest.” The Council concluded that clean energy supply standards, which would require providers of energy across the economy to reduce the carbon intensity of fuels they introduce into commerce, can complement economywide structures as discussed in this chapter, but because such standards apply only to energy sources, they do not offer the same comprehensive coverage and opportunities for cross-sector efficiency. For this reason, the Council determined that clean energy supply standards (like the Clean Energy Standard [CES] for electricity and clean transportation standard) should be considered separately under sectoral chapters.
A carbon tax/fee would establish the price per ton of greenhouse gas (GHG) emissions that regulated entities would pay. Carbon tax/fee proposals have been considered by the New York State Legislature, and the New York Independent System Operator (NYISO) put forward a proposal for a fee on every ton of carbon dioxide (CO2) emission from the electricity sector. A cap-and-invest program would also result in a price on emissions, but indirectly as the government entity establishes the emissions cap while the price is determined based on the available supply of and demand for emission allowances, rather than directly by the government entity. It would require regulated entities to purchase emission allowances, usually at an auction, to match their emissions. The difference from carbon tax/fee, however, is that a cap-and-invest program provides emissions certainty. A cap-and-invest program would limit the number of allowances sold, with the available amount decreasing year-by-year to ensure that overall aggregate emissions decline. Cap-and-invest programs have been implemented economywide in California and Quebec, and Washington recently passed legislation and adopted a rule to establish such a program. There are also existing sector-specific cap-and-invest programs, such as the Regional Greenhouse Gas Initiative (RGGI), that cover emissions from the electricity sector and include New York as a participant. In contrast to a carbon tax or fee, which would have to be enacted by the Legislature, the New York State Department of Environmental Conservation (DEC) could promulgate regulations establishing a cap-and-invest program using its existing authority to adopt regulations that reduce emissions.
Both carbon tax/fee and cap-and-invest programs provide a price signal stimulating lower emission choices and a source of funding for public investment and incentive programs. Both would regulate the bulk of energy, industrial, and other emissions in New York, including both fossil fuels and alternative fuels consistent with the requirements of the Climate Act. Both would be structured to comply with Environmental Conservation Law (ECL) § 75-0117, which requires that at least 35% of the overall benefits of spending be directed to Disadvantaged Communities, with a goal of 40%. But they have one fundamental difference: while both types of programs place a charge on emissions and invest the revenues, only a cap-and-invest program would implement a declining, enforceable cap on emissions overall and a mechanism for State enforcement of such limits against individual sources, thus ensuring that aggregate emissions do not exceed the statewide emission limits.
RGGI Success Narrative
I have written multiple articles that argue that RGGI advocates mis-lead the public when they imply that RGGI programs were the driving force behind the observed over 50% reduction in power sector CO2 emissions since the start of the program. In my latest evaluation I found that since 2009 RGGI funded control programs have been responsible for 5.6% of the observed reductions. The Investment of RGGI Proceeds in 2020 report does not directly provide the numbers necessary to calculate that estimate which I have come to believe is deliberate. When the sum of the RGGI investments is divided by the sum of the annual emission reductions the CO2 emission reduction efficiency is $818 per ton of CO2 reduced. I concluded that RGGI is not an effective CO2 emission reduction program.
The latest New York RGGI funding report prepared by the New York State Energy Research & Development Authority (NYSERDA) is the Semi-Annual Status Report through June 30, 2022. It states that:
This report is prepared pursuant to the State’s RGGI Investment Plan (2020 Operating Plan) and provides an update on the progress of programs through the quarter ending June 30, 2022. It contains an accounting of program spending; an estimate of program benefits; and a summary description of program activities, implementation, and evaluation. An amendment providing updated program descriptions and funding levels for the 2021 version of the Operating Plan was approved by NYSERDA’s Board in January 2022.
The State invests RGGI proceeds to support comprehensive strategies that best achieve the RGGI CO2 emission reduction goals. These strategies aim to reduce global climate change and pollution through energy efficiency, renewable energy, and carbon abatement technology.
New York Power Sector CO2 Emissions
The first step in evaluating the effect of RGGI on CO2 emissions is to determine the observed trend of New York electric utility emissions. My background is in the electric generating sector and I have been involved in the reporting process for electric generating unit (EGU) continuous emissions monitoring system (CEMS) data since the Environmental Protection Agency (EPA) mandated these systems for the Acid Rain Program. EPA’s Clean Air Markets Division maintains a data base of all the emissions data collected by every power plant in the United States since the mid-1990’s. Those data are used for RGGI program compliance and are used in this article.
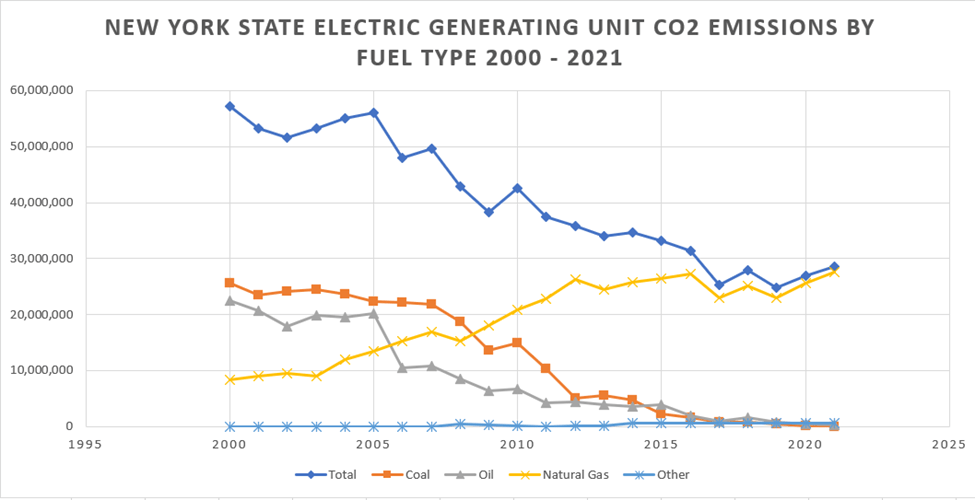
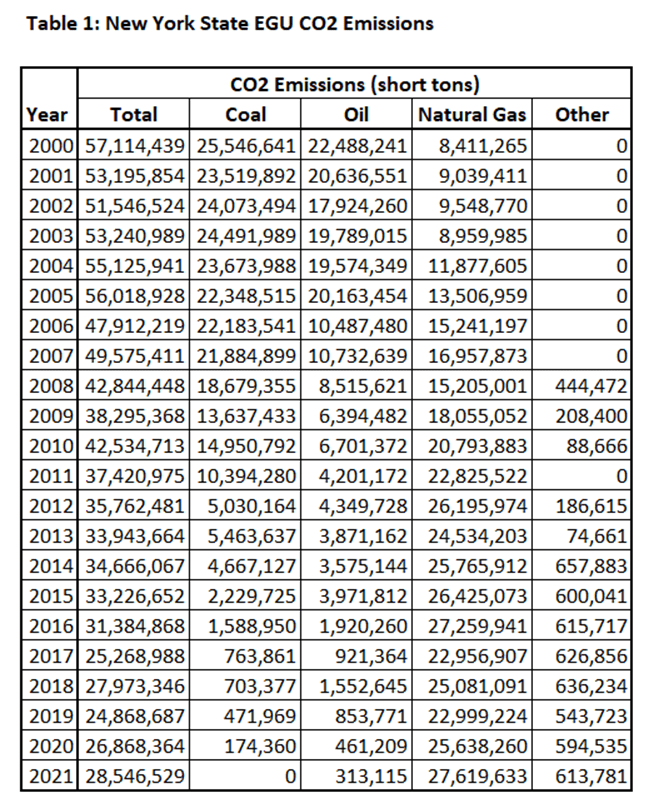
The following graph shows New York State CO2 emissions since 2000 based on data in spreadsheet NY RGGI Funded Program Status Report Summary. These data are the sum of all New York units that are required to submit CEMS data to EPA for any air pollution control program. The EPA database includes supplemental information such as the primary fuel type of each generating unit and I have listed CO2 emissions by fuel type. In 2000, New York EGU emissions were 57,114,438 tons and in 2021 they were 28,546,529 tons, a decrease of 50% (Table 1). In NYS 2021 CO2 emissions are 39% lower than the three-year baseline emissions before RGGI started. The reason that emissions have dropped is because coal and oil fuels have essentially gone to zero as shown in the following graph. Natural gas has increased to cover the generation from those fuels but because it has lower CO2 emission rates the New York emissions have gone down.
New York RGGI Program Investment Reductions
In the RGGI funding reports Chapter Summary of Portfolio and Program Benefits describes the NYSERDA tracking process:
NYSERDA begins tracking program benefits once project installation is complete and provides estimated benefits for projects under contract that are not yet operational (pipeline benefits). Estimated benefits are based on the expected lifetime benefits from installed and pipeline savings. The metrics presented in this section are estimates and not evaluated unless otherwise noted. Future evaluation and status reports will present the results as they are available. NYSERDA expects verified net savings to be incorporated in the year-end 2022 report. Program benefits may be reported prior to the financial reporting of funds spent, as fund transfers may lag behind the installation date. At this time, the program benefits include some projects that are jointly supported by other non-RGGI funding sources administered by NYSERDA.
The NYSERDA RGGI funding report formats and material presented have changed over time. I found that only since 2013 were the reports consistent enough for my purposes. I do not understand the quote in the preceding paragraph: “metrics presented in this section are estimates and not evaluated unless otherwise noted.” I used the numbers as they were presented in the report.
The estimated cumulative annual net GHG emissions savings as of the end of the reporting period for each of the reports since 2013 are shown in Table 2. I did not use the “lifetime” savings data because I have always felt that was inappropriate. In this application I am trying to compare the RGGI program benefits reductions to the RGGI compliance metric of an annual emission cap. Lifetime reductions are clearly irrelevant. The document description “Estimated benefits are based on the expected lifetime benefits from installed and pipeline savings” suggests that the values shown are lifetime values but the table includes both power (MMBtu) and energy (MWhr) savings where lifetime values are more appropriate for energy efficiency program accounting.

Emission trends over short periods are unreliable as indicators of policy implementation because there are other factors affecting the operation of generating units. The biggest outside factor is weather. If the year was abnormally hot or cold then the emissions would go up because the units operated more. There also can be issues related other units going down to problems or retirements. For example, the recent CO2 trend is New York is strongly affected by the closure of 2,000 MW of zero-emissions generating at Indian Point and I understand the units on Long Island have run more the last couple of years due to issues with transmission cables under Long Island Sound. Keep this issue in mind when looking at Table 3 that compares New York CO2 emissions with the cumulative RGGI net GHG emission savings. The emissions decrease between 2013 and 2021 is 5,397,135 tons but the RGGI investments claimed total 7,460,423 tons. NYSERDA is claiming that RGGI investments were responsible for all the emission reductions!

I don’t believe that the RGGI investments could actually be responsible for all the observed reductions. I think that fuel switching is more likely to be the cause of the emission reductions observed. Over this time period the last coal units shut down and the oil-fired units reduced their emissions about as low as I expect they can go and still provide capacity support. Another possible reason is that I assumed that the annual installed and pipeline emission savings represented an actual annual projection and not lifetime emission savings. That could account for the unrealistically high emission reduction claim.
There is another possible explanation. Appendix A, Section A.2 in Semi-Annual Status Report through June 30, 2022 describes the CO2 reduction savings methodology:
Emissions factors translate the energy savings data into annual GHG emission reduction values. The GHGs evaluated in the report include carbon dioxide, methane, and nitrous oxide. Because each of these gases has a different global warming potential, emissions for gases other than carbon dioxide are converted into carbon dioxide equivalent units (CO2e) through multiplication with their appropriate Intergovernmental Panel on Climate Change (IPCC) global warming potential value, shown in Table A-1.
Therefore, the other possibility for the discrepancy is that the cumulative RGGI net GHG emission savings in Table 2 of the status reports is not just CO2 but also includes methane and nitrous oxide. If that is the case then it would explain some of the inconsistency. It also would be inappropriate. RGGI is supposed to be a CO2 emissions reduction program. This document should report on the efficacy of RGGI-program investments and provide evidence how it will work in the future. In order to determine the value of the RGGI investments relative to the RGGI emission targets the only relevant GHG is CO2. Including methane and nitrous oxides misleads readers because it suggests higher emissions than what can be expected for investments needed to meet the RGGI emission reduction targets.
Appendix A goes on to say:
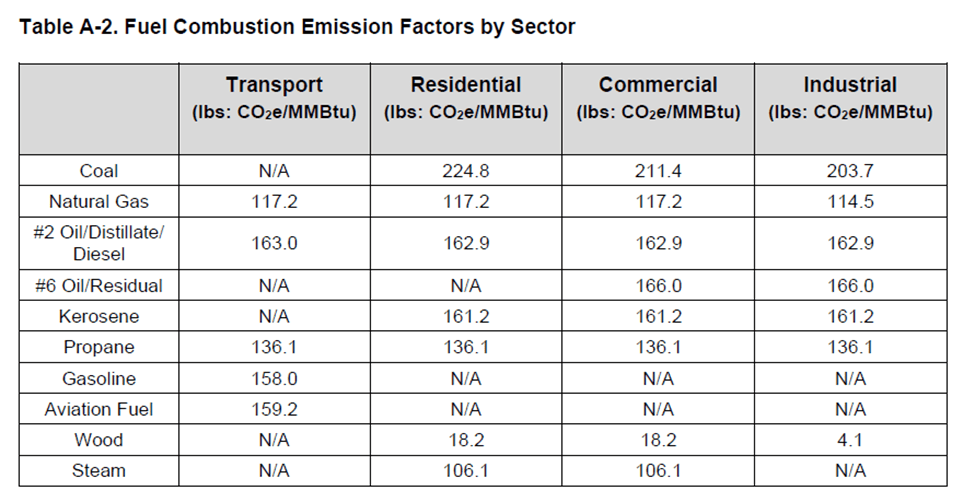
NYSERDA uses the emission factors shown in Table A-2 to calculate emissions from on-site fuel combustion derived from the U.S. Environmental Protection Agency (EPA) emission coefficients. The CO2e values represent aggregate CO2, CH4, and N2O emissions. If a program covers more than one sector, then the estimated reduction is based on a calculated average emission factor for the affected sectors.
Without more documentation I will admit to being flummoxed. This paragraph states that the emission factors used “represent aggregate CO2, CH4, and N2O emissions” but the values in the following paragraph are close to the observed CO2 only emission rates observed. This suggests that if the methane and nitrous oxide components of the aggregate emission rates are included that they are very small. It would be helpful if the documentation provided an example calculation showing how the aggregate factors were developed.
The final relevant section of Appendix A states:
For projects installed prior to 2016, a marginal emission factor of 1,160 pounds of CO2e/MWh estimates emission reductions associated with electricity use reductions for all sectors. When a project is installed and committed from 2016 onward, a marginal emission factor of 1,103 pounds of CO2e/MWh is applied to estimate emission reductions associated with electricity use reductions for all sectors. Although electricity savings may not lead to near-term emission reductions under the RGGI CO2 cap, savings will potentially reduce imports of electricity to NYS; the demand for CO2 allowances, leading to a possible future reduction in the cap; and the carbon footprint of end users, as they will be responsible for a smaller percent of the emissions associated with electricity production.
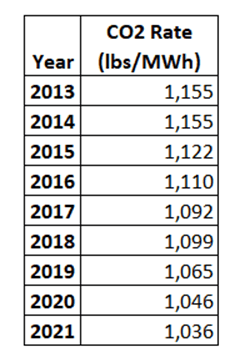
Even if the marginal emission factors represent aggregate rates for CO2 that incorporate methane and nitrous oxides, this is an over-estimate of current CO2 emission rates. The following table lists the calculated marginal emission rate for New York State electric generating units subject to RGGI. The fact is that current New York CO2 emissions are almost exclusively due to natural gas emissions that are significantly lower than the marginal emission factors quoted. At a minimum, there should be another methodology adjustment to correct for this over-estimate of emission reductions that could be expected when RGGI investments reduce energy use.
Alternative RGGI Program Investment Reduction Methodologies
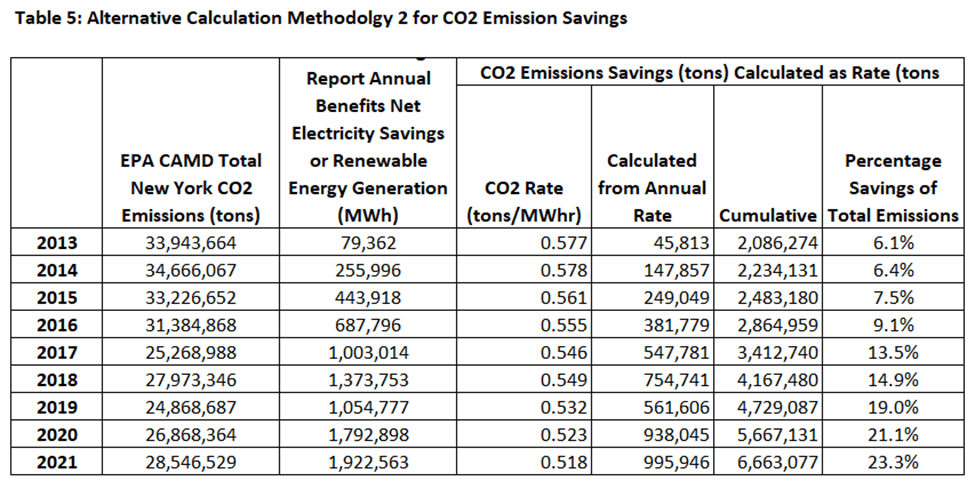
I calculated CO2 annual emissions in two alternative ways. In the status reports Table 2: Summary of Expected Cumulative Annual Program Benefits lists the net energy savings (annual MMBtu) and net electricity savings or renewable energy generation (annual MWh). The EPA emissions data includes those parameters so that an annual New York emission rate based on both parameters can be calculated. Once the calculated emission rate is determined then it can be multiplied by the projected annual savings due to RGGI funded programs to get an annual total emissions estimate.
Table 4 uses the heat input (MMBtu) data to calculate annual CO2 emission “savings”. Using this methodology, the cumulative total CO2 emissions expected from the RGGI-funding programs is 2,040,461 tons or 7.1% of the 2021 annual emissions. Recall that the emissions decrease between 2013 and 2021 is 5,397,135 tons so at least this estimate is less than the observed emission reduction.

Table 5 uses the load (MWhr) data to calculate annual CO2 emissions. Using this methodology, the cumulative total CO2 emissions expected from the RGGI-funding programs is 6,663,077 tons or 23.3% of the 2021 annual emissions. Recall that the emissions decrease between 2013 and 2021 is 5,397,135 tons so this estimate is greater than the observed emission reduction.
RGGI-Funded Program Reductions
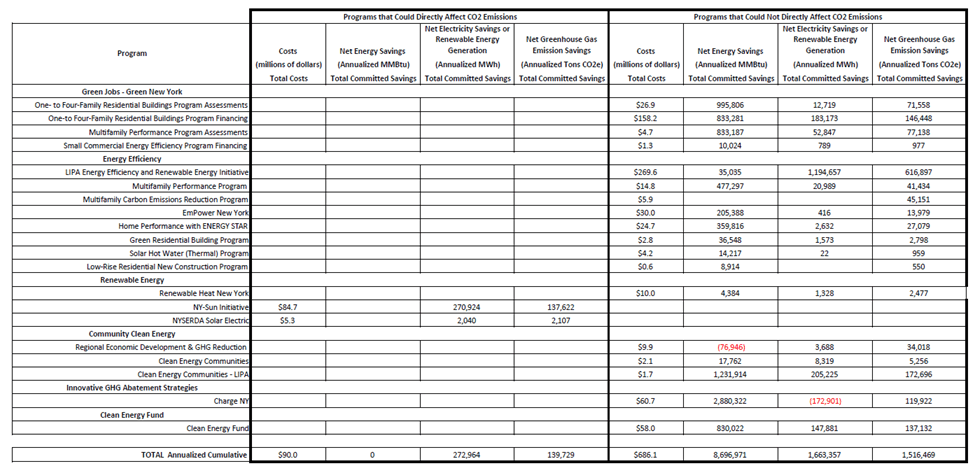
I believe that the underlying cause for the differences between the observed CO2 reductions using CO2 savings directly or the heat input (mmBtu) and generation (MWhr) data is that most of the RGGI-funded programs indirectly affect emissions. All the programs in the Green Jobs – Green New York, Energy Efficiency, Community Clean Energy, Clean Energy Communities, and Charge NY categories affect CO2 emissions indirectly. In the Renewable Energy category only the NY-Sun Initiative and NYSERDA Solar Electric programs fund programs that subsidize renewable energy projects that directly offset generation from fossil-fired generating units affected by RGGI. All the other programs reduce energy use that indirectly reduces the need for RGGI-affected unit generation.
Table 6 classifies the savings into two categories: direct and indirect effects on CO2 emissions for the latest year. The only two programs (NY-Sun Initiative and NYSERDA Solar Electric) that directly affect emissions invested $90 million through June 30, 2022 and are responsible for 272,964 MWh and 139,729 tons of CO2e savings with a calculated cost benefit of $644 $/ton. All the other programs listed in the latest NY RGGI Funding Status report invested $686 million through June 30, 2022 and are responsible for 1,663,357 MWh, 8,696,971 mmBtu and 1,516,469 tons of CO2e savings with a calculated cost benefit of $452 $/ton. Note that the report does not report heat input (mmBtu) savings for the direct CO2 reduction programs.
Table 6: Summary of Expected Cumulative Annualized Program Benefits through 30 June 2022
The key point of this long and technical article is to make the point that the total CO2 savings listed in the reports are not necessarily reductions that can be credited towards the observed emission reductions. Energy efficiency programs reduce the fuel needed to heat homes and lead to direct emission reductions in the building sector if oil, gas, or propane are used for heating. Energy efficiency reductions reduce electric generating load for cooling and homes that use electric heat but trying to figure out just how much that affects RGGI emissions is not straight-forward. I have never seen a state report quantify that reduction.
If just the CO2 reduction savings that are listed for the NY-Sun Initiative and NYSERDA Solar Electric programs are considered over the years 2013 to 2021, the total investment is $565 million and the claimed savings are 1,684,616 MWh and 861,442 tons of CO2e with a calculated cost benefit of $565$/ton. Recall that the emissions decrease between 2013 and 2021 is 5,397,135 tons so the only CO2 reductions that can conclusively be claimed account for 16% of the observed emission reduction. Because observed coal CO2 emissions went from 5,463,637 tons in 2013 to zero in 2021 and oil CO2 emissions went from 3,871,162 tons to 313,115 tons, I conclude that the primary reason for the observed electric sector emission reductions in New York was due to fuel switching.
