

I have prepared seven annual updates on the Regional Greenhouse Gas Initiative (RGGI) annual Investments of Proceeds report. While preparing the most recent edition I realized that there were some lessons to be learned concerning the relative emission reduction effectiveness of the different investments categories used in the reports. This post compares the dollars per ton of CO2 reduced for five investment categories.
I have been involved in the RGGI program process since its inception. I blog about the details of the RGGI program because very few seem to want to provide any criticisms of the program. The opinions expressed in this post do not reflect the position of any of my previous employers or any other company I have been associated with, these comments are mine alone.
Background
RGGI is a market-based program to reduce greenhouse gas emissions (Factsheet). It has been a cooperative effort among the states of Connecticut, Delaware, Maine, Maryland, Massachusetts, New Hampshire, New York, Rhode Island, and Vermont to cap and reduce CO2 emissions from the power sector since 2008. New Jersey was in at the beginning, dropped out for years, and re-joined in 2020. Virginia joined in 2021 and dropped out at the end of 2023. Pennsylvania has joined but is not actively participating in everything due to on-going litigation. According to a RGGI website: “The RGGI states issue CO2 allowances which are distributed almost entirely through regional auctions, resulting in proceeds for reinvestment in strategic energy and consumer programs. Programs funded with RGGI investments have spanned a wide range of consumers, providing benefits and improvements to private homes, local businesses, multi-family housing, industrial facilities, community buildings, retail customers, and more.”
Proceeds Investment Report
The 2022 investment proceeds report was released on July 8, 2024. For general information I refer you to my most recent update. In this article I am going to present data from the last five reports. Each report breaks down the investments into major categories. The 2022 investment report explains:
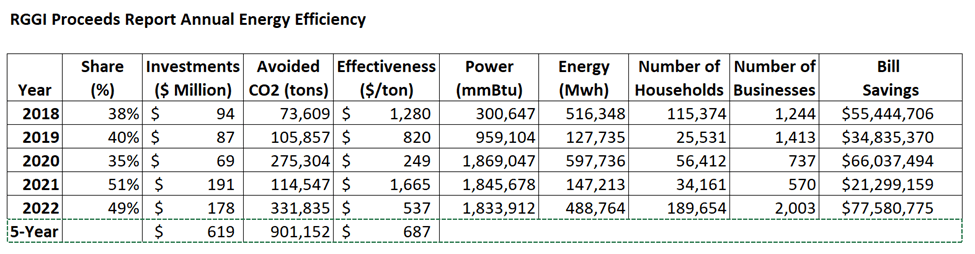
Energy efficiency makes up 49% of 2022 RGGI investments and 61% of cumulative investments. Programs funded by these investments in 2022 are expected to return about $1.5 billion in lifetime energy bill savings to more than 189,000 participating households and over 2,000 businesses in the region and avoid the release of 6.5 million short tons of CO2.
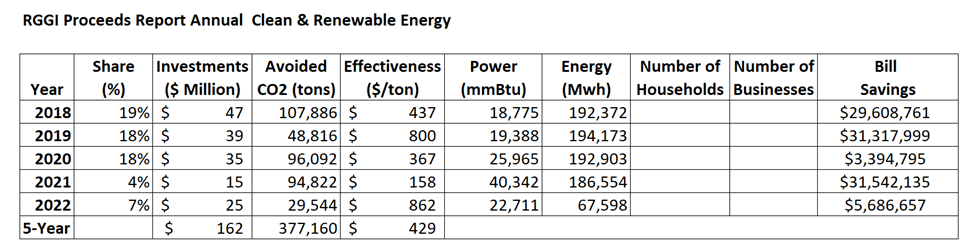
Clean and renewable energy makes up 7% of 2022 RGGI investments and 6% of cumulative investments. RGGI investments in these technologies in 2022 are expected to return over $139 million in lifetime energy bill savings and avoid the release of more than 660,000 short tons of CO2.
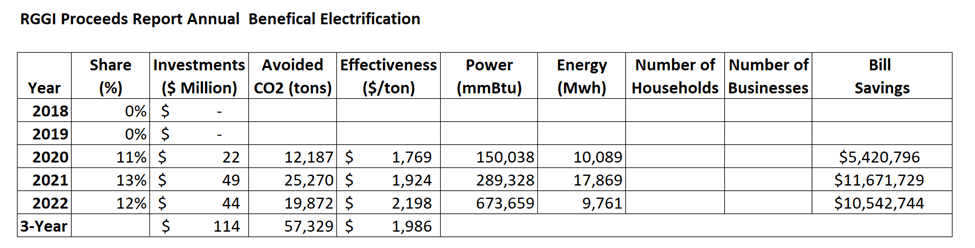
Beneficial electrification makes up 12% of 2022 RGGI investments and 4% of cumulative investments. RGGI investments in beneficial electrification in 2022 are expected to avoid the release of 315,000 short tons of CO2 and return over $97 million in lifetime savings.
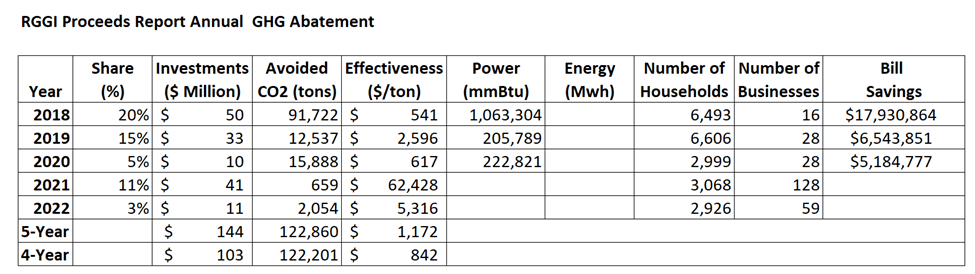
Greenhouse gas abatement and climate change adaptation makes up 3% of 2022 RGGI investments and 8% of cumulative investments. RGGI investments in greenhouse gas (GHG) abatement and climate change adaptation (CCA) in 2022 are expected to avoid the release of more than 11,000 short tons of CO2.
Direct bill assistance makes up 21% of 2022 RGGI investments and 15% of cumulative investments. Direct bill assistance programs funded through RGGI in 2022 have returned over $77 million in credits or assistance to consumers.
Emission Reduction Cost Efficiency
Ultimately RGGI is supposed to be a CO2 emission reduction program. GHG emission reduction efforts are complicated by the fact that there are no cost-effective add-on GHG emission controls available for existing sources. That means the owners of the electric generating units in RGGI have only two options to reduce emissions: switch to lower CO2 emitting fuels or operate less. Importantly, in order maintain reliability in the electric system when facilities run less, somebody else must develop replacement zero-emissions generating resources to replace their output. Proponents of cap-and-dividend programs like RGGI tout the use of the auction proceeds to fund the deployment of alternative resources and load reduction programs. However, as is the case with any source of funding controlled by a political bureaucracy, money can get diverted away from the original purpose of the program in many ways. There always is a rationale for all the other purposes but if insufficient resources are not available to support the deployment of alternative resources there will be problems providing sufficient load when it is needed while complying with the RGGI requirements.
All my summaries of the RGGI Investment Proceeds reports have found the same results. Since the beginning of the RGGI program RGGI funded control programs have been responsible for a small fraction of the observed reductions (e.g., only 7.5% in 2022). The primary reason for the observed reductions has been fuel switching away from coal and oil to natural gas. Importantly, the availability of potential fuel switching in the RGGI fleet of electric generating units is running out. Consequently, future reductions will have to rely on the deployment of zero-emission generating resources and load reductions which makes cost-effective emission investments important.
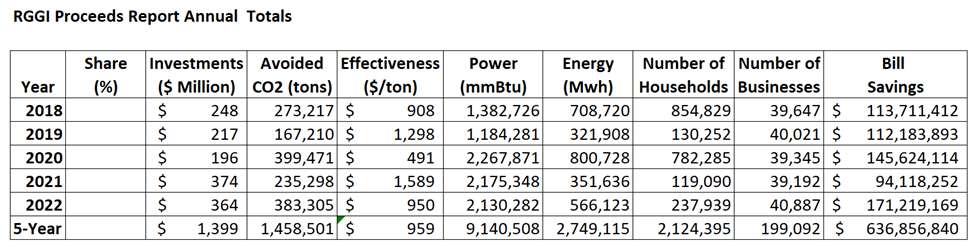
This makes the cost-effective investment for alternative resources all the more important. I calculate cost effectiveness by dividing the RGGI total investments divided by the estimated avoided CO2 emissions. In my annual summaries I only looked at the overall values. In 2022 the CO2 emission reduction efficiency was $941 per ton of CO2 reduced. In 2023 NY RGGI emissions totaled 28,654,177. If RGGI investments were the sole approach for emission reductions, then it would cost $27.0 billion to go to zero.
There is one more complication that I should note. I believe that the appropriate methodology to calculate the CO2 emissions reduction efficiency is to use the annual investment and avoided emission estimates. The problem is that the RGGI reports provide annual values and expected lifetime values. The metric for net-zero is annual emissions so it is inappropriate to consider lifetime values. The Proceeds reports always include a caveat that the states continually refine their estimates and update their methodologies, but the historical annual numbers are not included in the proceed reports so my estimates do not reflect subsequent refinements.
In the following sections I will provide specific information for each of the investment categories
Energy Efficiency
The RGGI report glossary describes energy efficiency programs as follows:
Programs designed to improve energy efficiency by reducing overall energy use without degrading functionality. This includes programs directed at assisting low-income families and small businesses. Program costs include evaluation and measurement. Examples: home energy audit programs, home and building weatherization, energy efficient appliance or industrial equipment rebate programs, compact fluorescent light bulb programs, and energy efficiency workforce training programs.
The following table lists information for this investment category for the last five years. Note that the effectiveness ($ per ton removed) ranges from $249 per ton to $1,665 per ton and the five-year average is $687 per ton. The range is so large that it suggests that there is an inconsistency. It could be differences due to different methodologies amongst the state agencies who prepared data for the report and interannual variation between analysts. Based on my experience with similar estimates this is more art than science because the assumptions and input data used can lead to markedly different estimates. In addition, the states included in the analysis varies so the effects of methodological differences changes. In my opinion, those issues would not account for the this wide a range so the possibility that there were typos in the data could also be a factor. The RGGI state decision to not update the annual values also could be a factor inasmuch they might have identified an error that subsequent analyses corrected. It is also possible that I made an error that is responsible for the variation.
Clean and renewable energy
The RGGI report glossary describes clean and renewable programs as follows:
Programs directed at accelerating the deployment of renewable or other non-carbon emitting energy technologies. Program costs include evaluation and measurement. Examples include incentives for residential solar panels, financing of commercial renewable energy projects through green banking, research and development of new energy technologies.
The following table lists information for this investment category for the last five years. Note that the effectiveness ($ per ton removed) ranges from $158 per ton to $862 per ton with a 5-year average of $429. Because of the wide range in values the previously mentioned caveats for potential errors are also relevant here.
Beneficial electrification
The RGGI report glossary describes beneficial electrification programs as follows:
Programs designed to reduce fossil fuel consumption by implementing or facilitating fuel-switching to replace direct fossil fuel use with electric power. Examples include incentives for electric vehicles and home appliances, and installation of electric vehicle infrastructure. Program costs include evaluation and measurement.
This category is complicated. The report notes that:
Often, these programs result in an increase in MWh, but do reduce carbon emissions overall. As the grid becomes cleaner, the emissions from electrified appliances become cleaner, as opposed to the fixed emissions intensity of fossil-powered appliances.
The report argues that net emissions are lower, but the details of the calculations are not provided. The net emissions calculation is highly dependent upon the characteristics of the electric generation resources that are displaced so I am skeptical with this claim. The reported values may also be affected if the power and energy estimates consider the energy losses between the generating stations and the electrification applications. This category was added in 2020 so the following table lists information for this investment category for the last three years. The cost effectiveness ranges from $1,769 to $2,198 per ton with a 3-year average of $1,986 per ton. Note that there is not as much variation in the cost per ton reduced effectiveness but that the cost efficiencies are much higher than the other investment categories.
Greenhouse gas abatement and climate change adaptation
The RGGI report glossary describes GHG abatement and climate change adaptation programs as follows:
Programs promoting the research and development of advanced energy technologies, the reduction of vehicle miles traveled, the reduction of emissions in the power generation sector, tree-planting projects designed to increase carbon sequestration, other initiatives to reduce greenhouse gases, and climate adaptation and community preparedness initiatives. Some projects can support multiple functions, such as natural area restoration that also serves flood mitigation planning purposes. Program costs include evaluation and measurement.
The following table lists information for this investment category for the last five years. Note that the 2021 and 2022 reports did not include avoided power and bill savings information. There is a huge variation in the cost effectiveness values with 2021 listed as 100 times higher than the lowest value. It appears that the avoided CO2 value is much lower than the other values. If that value is incorrect then it would explain the high outlier. The average value excluding the outlier is $842 per ton removed.
Direct bill assistance
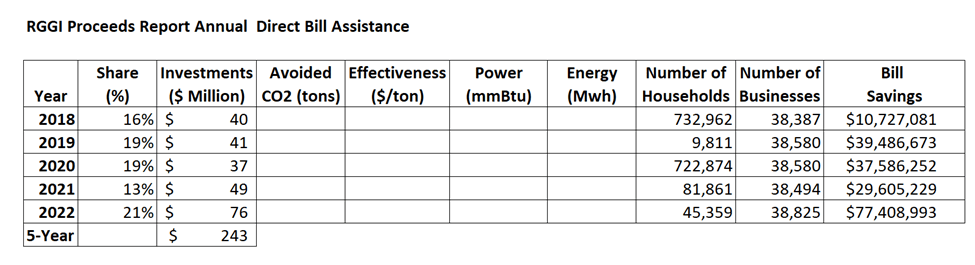
The RGGI report glossary describes direct bill assistance programs as follows:
Programs providing energy bill payment assistance, including direct bill assistance to low-income ratepayers. Program costs include evaluation and measurement.
This category does not provide any emission reductions. The following table lists information for this investment category for the last five years. Note that the total direct bill assistance totals $243 million.
Administration and RGGI, Inc.
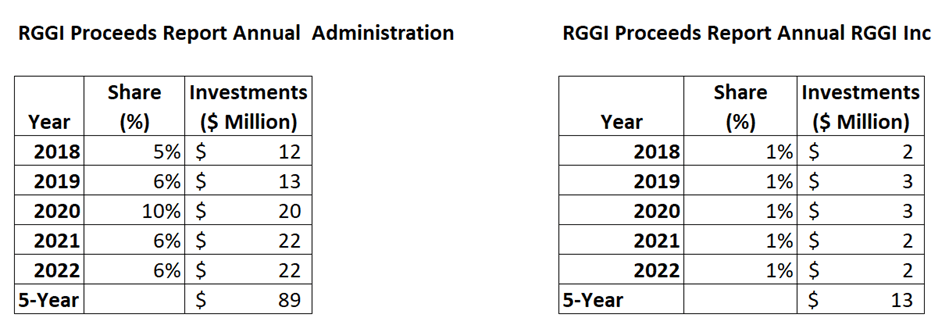
There are two other categories for administrative costs that do not provide any emission reduction benefits. The RGGI report glossary describes administration as “Funds directed to administrative overhead expense associated with all RGGI-funded programs, including outsourced and in-house overhead expenses” and RGGI Inc. as: “Funds provided to RGGI, Inc. to support and implement state CO2 Budget Trading programs.”
The following tables show the information for the last five years. Administration costs total $89 million and RGGI costs total $13 million.
Summary
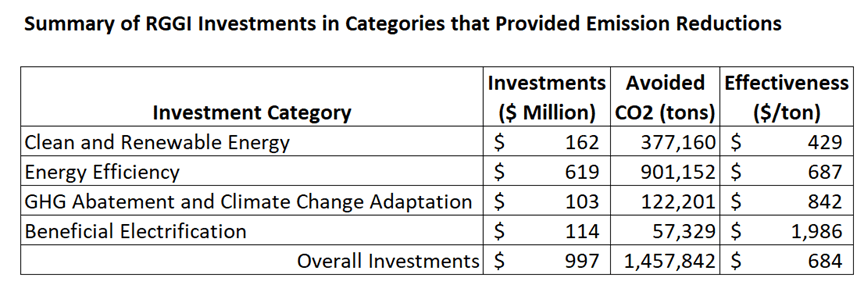
I summed the values for each category over the last five years to provide the following summary. Note that the overall cost effectiveness is $959 per ton avoided.
Cost Effectiveness Implications
RGGI is supposed to be an emissions reduction program. One of my big concerns about any cost on carbon emissions is that it is a regressive stealth tax on energy. There is a tradeoff between trying to minimize those impacts and reducing emissions. In the last five years $243 million or 17.4% of the RGGI auction proceeds went to direct bill assistance which is good but that means that much less was available to reduce emissions. Throw in the $102 million over the last 5 years for administration that means that 24.7% of the RGGI auction proceeds were not used to reduce emissions.
The primary goal of this article is to compare the cost effectiveness of emission reductions for the following investment categories: energy efficiency, clean and renewable energy, beneficial electrification, greenhouse gas abatement and climate change adaptation. The following table summarizes the cost effectiveness. For the investment categories that provided emission reductions Clean and Renewable Energy was the most effective way to reduce emissions. As far as I can tell this category provides the most funding for projects that directly reduce emissions. It is encouraging that the energy efficiency is right around the average over all the categories. This means that energy efficiency programs targeted at low- and middle-income households most affected by this energy tax will still provide effective emission reductions.
On the other hand, programs promoting the research and development of GHG abatement and climate change adaptation are less effective at reducing emissions. Perhaps a greater emphasis on programs promoting reduction of emissions in the power generation sector and advanced energy technologies and less emphasis on programs for the reduction of vehicle miles traveled, tree-planting projects designed to increase carbon sequestration, and climate adaptation and community preparedness initiatives would improve emission reduction efforts consistent with the emission reduction goal of RGGI.
The worst emission reduction programs are associated with beneficial electrification that are “designed to reduce fossil fuel consumption by implementing or facilitating fuel-switching to replace direct fossil fuel use with electric power.“ This category was added recently. There are two ways to look at the high numbers. On one hand, it could be that it recognizes that reductions of overall fossil fuel consumption require efforts across all sectors. On the other hand, I think it inappropriately transfers costs to the electric sector that do not provide efficient emission reductions.
Discussion
As noted previously, since the beginning of the RGGI program RGGI funded control programs have been responsible for a small fraction of the observed reductions (e.g., only 7.5% in 2022). The primary reason for the observed reductions has been fuel switching away from coal and oil to natural gas. There are limited opportunities to make further fuel switching changes. Consequently, future reductions will have to rely on the deployment of zero-emission generating resources. This means that compliance with the RGGI emission caps is out of the control of the affected generating units and that RGGI investments must fund much of the reductions needed.
There are associated ramifications with the RGGI Third Program Review currently underway but stalled for months. The Acadia Center has been lobbying to resolve the impasse and “Set a new cap that is in line with the States’ goals, we are in support of a cap that goes to zero by 2040”. The most effective compliance strategy to date, fuel switching, cannot reduce emissions to zero. The affected sources are unable to guarantee compliance because the deployment of zero-emissions resources are out of their control. The recently released Clean Energy Standard Biennial Review Report found that New Yorks deployment of renewable resources is incompatible with the 2030 Climate Act goal to reach 70% by 2030. Combined with the inefficient emission investment results, it is clear that Acadia’s position is incompatible with the reality of these findings.
Conclusion
To this point RGGI implementation has been able to rely on emission reductions from fuel switching at affected sources. In the current program review process, climate activists are demanding that the future emission reduction trajectory be consistent with a zero-emissions electric grid at some point. This means that fuel switching will eventually not be a viable option and, given that fuel switching opportunities are more limited than in the past, the ramifications are likely soon. This is troubling because the ultimate compliance strategy for an affected source that has insufficient allowances due to an inappropriate reduction strategy is to simply stop running.
If RGGI investments could effectively support the development of zero-emissions resources or reduce load efficiently, then the affected sources could meet reasonable emission reduction trajectories. Unfortunately, the results shown here suggest that RGGI investments have not been particularly cost efficient. The bigger issue is that pressure to use RGGI funds to support electrification of other sectors not only causes an increase in load and likely emissions for the affected sources, but these results show that those investments have the worst cost per ton removed efficiencies. Coupled with pressure to make equity-based investments that may or may not be efficient, this means that RGGI investments may be inadequate to support aspirational emission reductions targets. All this suggests that the likelihood that RGGI compliance requirements will cause artificial energy shortages when units stop operating because they have inadequate allowances is increasingly likely.

2 thoughts on “Lessons from the RGGI Investment Proceeds Reports”