

The recent winter storm stressed electric systems across the country. It also offers electric resource planners an opportunity to examine the impacts of future increased use of renewable energy during high-load conditions. This article takes an initial look at the potential impact of such a weather event on the existing New York renewable resources.
I am convinced that implementation of the Climate Leadership & Community Protection Act (Climate Act) net-zero mandates will do more harm than good if the future electric system relies only on wind, solar, and energy storage because of reliability and affordability risks. The opinions expressed in this article do not reflect the position of any of my previous employers or any other organization I have been associated with, these comments are mine alone.
Overview
The Climate Act established a New York “Net Zero” target (85% reduction in GHG emissions and 15% offset of emissions) by 2050. Among its interim 2030 targets is a 70% renewable energy electricity mandate and 100% zero emissions electric generation in 2040..
Electric systems must be built around reliability during peak demand. One of my primary concerns with the Climate Act weather-reliant renewable energy mandates is correlated variability because the conditions that characterize the highest loads also have the weakest expected wind resource availability. That makes electric resource planning for reliability during the peak period especially challenging.
From January 23 to January 27, 2026, a very large and expansive winter storm caused deadly and catastrophic ice, snow, and cold impacts from Northern Mexico across the Southern and Eastern United States and into Canada. In New York total snow/sleet accumulation ranged from 8-13” near the coast and 12-17” across the interior. As the precipitation ended a glaze of freezing rain occurred. Following the storm there was a period of prolonged sub-freezing weather.
This is a good case study for a New York extreme event that must be addressed by electric system planners. Although the data are for New York, this is a universal problem. It is only a matter of degree.
I relied on two sources of New York Independent System Operator (NYISO) data for this analysis. New York fuel-mix load data are available at the NYISO Real-Time Dashboard. The second source of data is the Operations Performance Metrics Monthly Report prepared by the NYISO Operating Committee. I looked at data from January 22-31, 2026 to bound conditions before the storm and after. Note that the cold weather went into February but the Metrics Report data for February are not available yet.
NYISO Real-Time Fuel Mix
The dashboard real-time fuel mix data includes links to current and historical five-minute generation (MW) for energy generated in New York State. I processed that data to calculate hourly averages. The generator types include “Hydro” that includes pumped storage hydro; “Wind”, mostly land-based wind but does include 136 MW of offshore wind; “Other Renewables” that covers solar energy (394 MW of “front-of-the-meter solar”), energy storage resources (63 MW), methane, refuse, or wood; “Other Fossil Fuels” is oil; “Nuclear”; “Natural Gas”; and “Dual Fuel” which are units that burn both natural gas and oil.
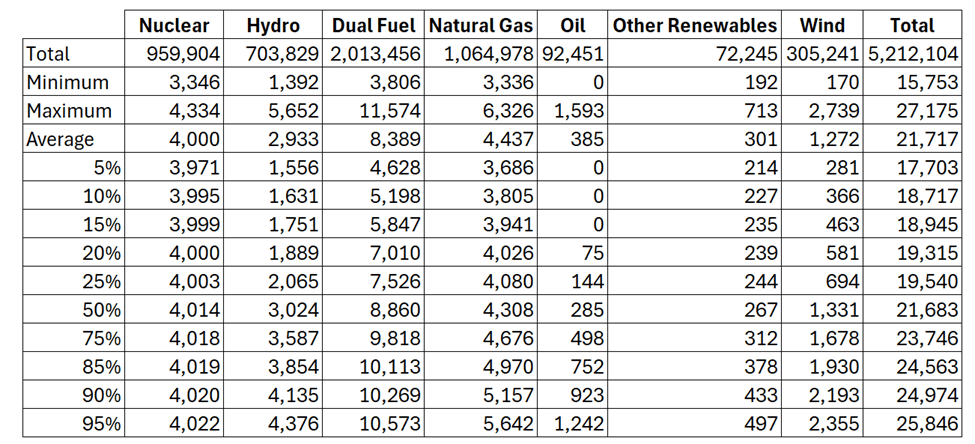
Figure 1 graphs all the fuel mix hourly data and Table 1 summarizes the data. The relative average fuel mix energy provided over these ten days was nuclear 18%, hydro 14%, and fossil fuels 61%. New York’s efforts to transition to renewables yielded only 7% of the total. In addition, the wind capacity ranged from 6% of the possible production to 96%, but 25% of the time the production was less than a quarter of possible production.
Figure 1: Hourly NYISO Realtime Fuel Mix January 22 to January 31, 2026
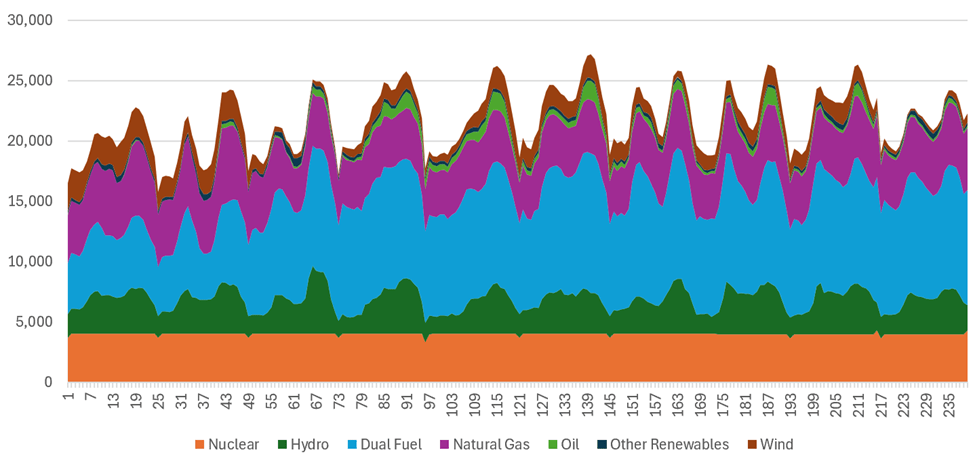
Table 1: Summary of Hourly NYISO Realtime Fuel Data Mix January 22 to January 31, 2026
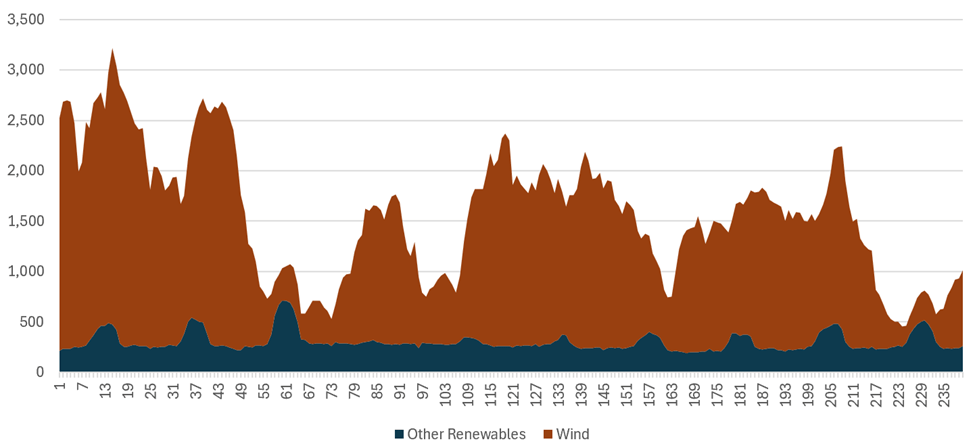
These data do not show the contribution of wind and solar well. “Other Renewables” includes solar energy (394 MW of “front-of-the-meter solar”), energy storage resources (63 MW), methane, refuse, or wood. The methane, refuse and wood facilities show up as the relatively constant base in Figure 3. Making the assumption that the 63 MW of energy storage is too small to show up on this graph, that means that the utility-scale “front-of-the-meter” solar shows up as the daily peaks on the first three days. The snow arrived in New York on the night of 24 January and continued through the next day. Note that utility solar was essentially zero on the 25th and did not return to the level of the 22nd until the 31st.
Figure 3: Hourly NYISO Realtime Fuel Mix Other Renewables and Wind January 22 to January 31, 2026
Operations Performance Metrics Monthly Report
I used the January Operations Performance Metrics Monthly Report for this analysis. There is a lot of information in these reports that is relative to the prospects for a successful Climate Act transition. So much that I am going to defer that discussion for a later post. For this post I am only going to highlight a couple of results presented in the report.
The report includes a graph of net wind and solar performance total monthly production and capacity factors (Figure 4). On average the higher solar output in the summer balances out the lower wind resources in the summer. Winter total renewable resources are lower, and wind does somewhat offset the low solar output.
Figure 4: Net Wind and Solar Performance Total Monthly Production and Capacity Factors
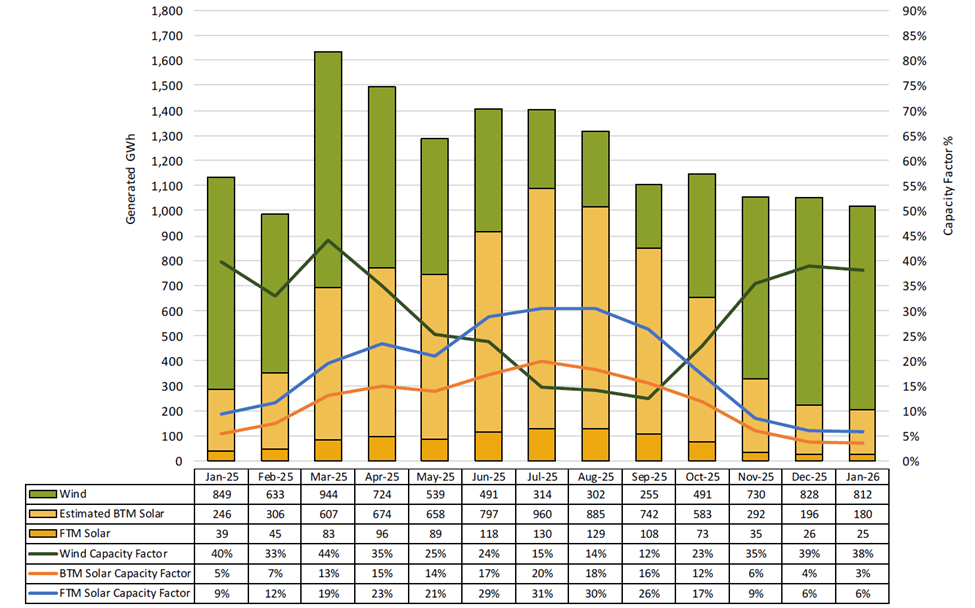
Source: NYISO January Operations Performance Metrics Monthly Report
Figure 5 is most important for this analysis because it breaks out the wind, utility-scale solar, also known as Front of the Meter (FTM) solar, and the rooftop top solar, also known as Behind the Meter (BTM) solar total daily production and capacity factors. Note that these data support the assumption that the daily peaks represent utility-scale production output in Figure 3. These data show that FTM solar has a higher output than the BTM solar. There is no question that the January snowstorm severely impacted solar output for days.
Figure 5: Net Wind and Solar Performance Total Daily Production and Capacity Factors
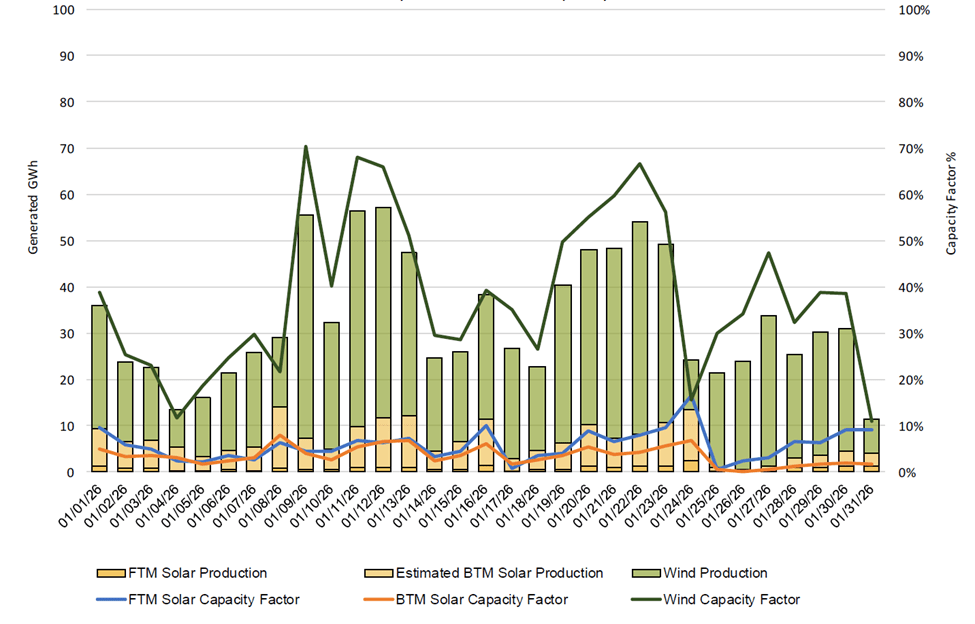
Source: NYISO January Operations Performance Metrics Monthly Report
Table 2 consists of three smaller tables. On the left, capacity factors derived from Figure 5 are listed for each day of the episode. At the top, resource capacity (MW) from the Operations Performance Metrics Monthly Report are listed for solar and wind resources. The main body of the table lists the calculated renewable daily energy (MWh) for each parameter and the renewable percentage of the total system energy that I calculated using the real-time fuel mix data.
Table 2: Capacity Factors Derived from Figure 5, Resource Capacity (MW) from Operations Performance Metrics Monthly Report, and Calculated Renewable Daily Energy (MWh)
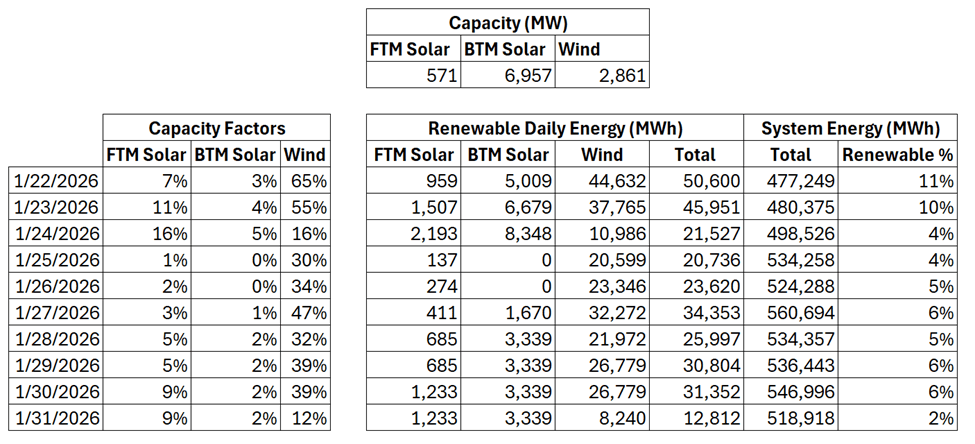
The total renewable output in Table 2 is an important finding. On average, wind resources counterbalance low winter solar resource availability. However, during dark doldrums when the wind fails renewable resources plummet. This storm also shows that the critical renewable resource period is best described as snowy dark doldrums.
Discussion
I contacted NYISO to get the actual data for these parameters but did not get a response. I have no doubt that NYISO staff will eventually evaluate these data in a similar fashion because of its importance to planning policy. Their results will only differ in degree but will conclusively show that DEFR is necessary. They may also show when DEFR is necessary as more renewables come on line and existing dispatchable resources are shut down.
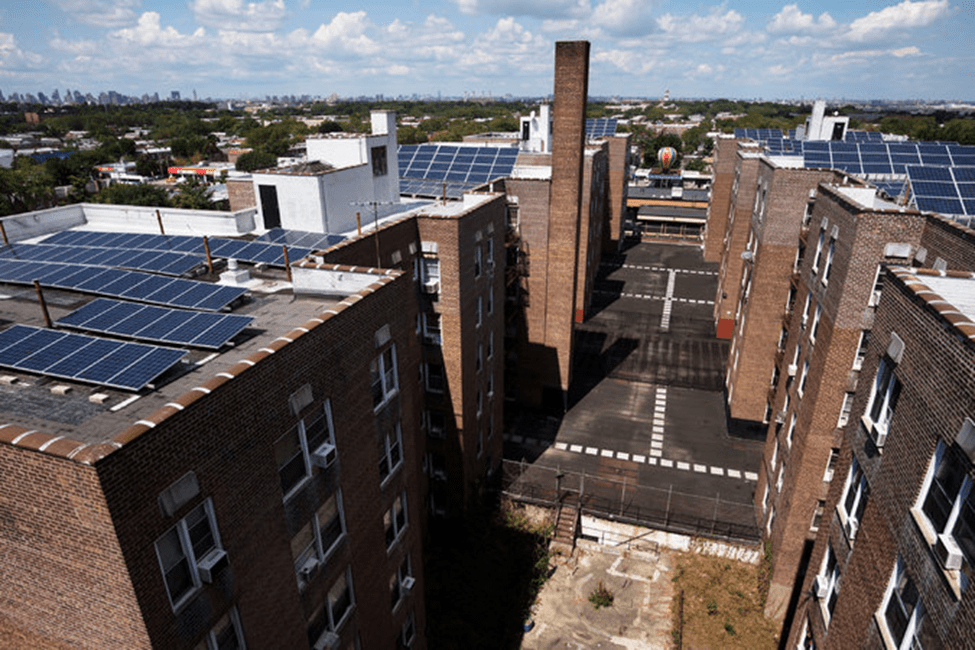
The NYISIO “Gold Book” has noted that New York will become a winter peaking system depending upon the timing and composition of heating electrification. This will exacerbate the correlation problem between peak loads and dark doldrum low renewable resource availability. There has not been a similar snowstorm since the deployment of significant amounts of BTM solar in New York City so this is the first unsurprising confirmation that snow can severely impact solar production when the solar panels are installed on flat roofs.
Figure 6: View of BTM Solar in New York City
Conclusion
On January 31, 2026 the total renewable energy production was 2% of the potential amount available. That was because of the weather conditions. No amount of additional capacity is going to be able to substantively improve that percentage. Intermittent, diffuse, and correlated electric generating resources are incompatible with electric system reliability when needed most.
On 1/28/26 the Public Service Commission issued a notice soliciting comments regarding the Coalition for Safe and Reliable Energy petition. Comments on the Coalition petition are due on 3/30/26. These results are another indication that it is time to demand that the PSC conduct a hearing to consider suspending or modifying the obligations of the Climate Act by submitting comments on the Coalition petition.

Cornell’s on campus and off campus PV output was close to 0 from Jan 24 to till the second week of Feb. Good thing they have a large central station co-generation facility on campus.
https://portal.emcs.cornell.edu/d/kkXN7E6Zk/solar-production?orgId=2&from=1768015546000&to=1773099421000
Mark Miller
LikeLiked by 1 person
Thanks for those links and the information
LikeLike