

Last month I wrote a couple of articles about the January 23-27 winter storm and its ramifications on a future electric system that depends upon wind and solar and how it demonstrated that Dispatchable Emissions-Free Resources (DEFR) will be needed. This article describes New York Independent System Operator (NYISO) documents that extend the previous analysis through February 9. The following documents were on the agenda for the NYISO Operating Committee March 19, 2026 meeting: a presentation titled Winter 2025-2026 Cold Weather Operations by Aaron Markham, NYISO Vice President Operations and the February 2026 Operations Performance Metrics Monthly Report. This article is limited to the description of the weather and resulting loads. I will follow up on the implications to the Climate Leadership & Community Protection Act (Climate Act) later.
I am convinced that implementation of the Climate Act net-zero mandates will do more harm than good if the future electric system relies only on wind, solar, and energy storage because of reliability and affordability risks. The opinions expressed in this article do not reflect the position of any of my previous employers or any other organization I have been associated with, these comments are mine alone.
Overview
The Climate Act established a New York “Net Zero” target (85% reduction in GHG emissions and 15% offset of emissions) by 2050. Among its interim 2030 targets is a 70% renewable energy electricity mandate and 100% zero emissions electric generation in 2040.
Electric systems must be built around reliability during peak demand. One of my primary concerns with the Climate Act weather-reliant renewable energy mandates is correlated weather-dependent resource variability because the conditions that characterize the highest loads also have the weakest expected wind resource availability. That makes electric resource planning for reliability during the peak period especially challenging.
January and February Winter Weather
From January 23 to January 27, 2026, a very large and expansive winter storm caused deadly and catastrophic ice, snow, and cold impacts from Northern Mexico across the Southern and Eastern United States and into Canada. In New York total snow/sleet accumulation ranged from 8-13” near the coast and 12-17” across the interior. As the precipitation ended a glaze of freezing rain occurred. Following the storm there was a period of prolonged sub-freezing weather.
Markham’s presentation summarized the cold weather event from January 23 through February 9:
- Coldest stretch of the 2025/2026 winter season with a daily average temperature of 15.2oF.
- Central Park was below freezing from 1/24 to 2/1 (9 days); longest consecutive day stretch since December 2017-January 2018 (14 days)
- Albany was below freezing from 1/23 to 2/10 (19 days); longest consecutive day stretch since January 2011 (21 days)
- Minimum temperature (-0.1o F) occurred on Sunday, February 8th and was the lowest of the season
- Essentially equal to the Winter 90th percentile design condition (0oF)
- Average season minimum: 3.8o F (2004-2005 to 2024-2025)
Figure 1: Observed Hourly Temperature and Wind Speed 1/23/26 to 2/9/26
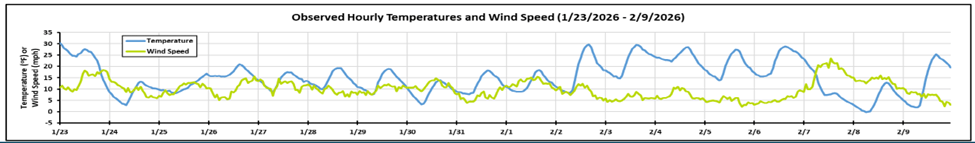
Source: Winter 2025-2026 Cold Weather Operations Presentation to NYISO Operations Committee March 19, 2025 ©Copyright NYISO 2026. All rights reserved.
NYISO Real-Time Fuel Mix
New York fuel-mix load data are available at the NYISO Real-Time Dashboard. These data include links to current and historical five-minute generation (MW) for energy generated in New York State. I processed that data to calculate hourly averages. The generator types include “Hydro” that includes pumped storage hydro; “Wind”, mostly land-based wind but does include 136 MW of offshore wind; “Other Renewables” that covers solar energy (394 MW of “front-of-the-meter solar”), energy storage resources (63 MW), methane, refuse, or wood; “Other Fossil Fuels” is oil; “Nuclear”; “Natural Gas”; and “Dual Fuel” which are units that burn both natural gas and oil. Note, my calculated values are not completely compatible with the final NYISO values.
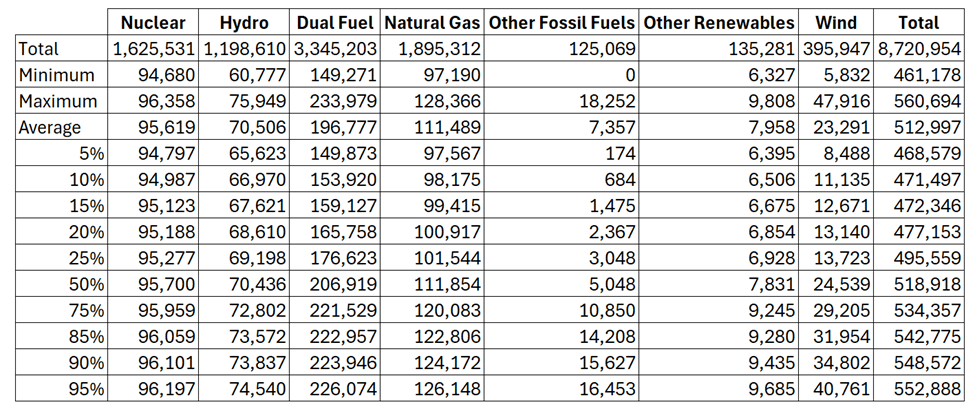
Figure 1 graphs all the fuel mix hourly data and Table 1 summarizes the data. The relative average fuel mix energy provided over these ten days was nuclear 19%, hydro 14%, and fossil fuels 62% totaling 94% of the total.
Figure 1: Hourly NYISO Realtime Fuel Mix (MW) January 24 to February 9, 2026
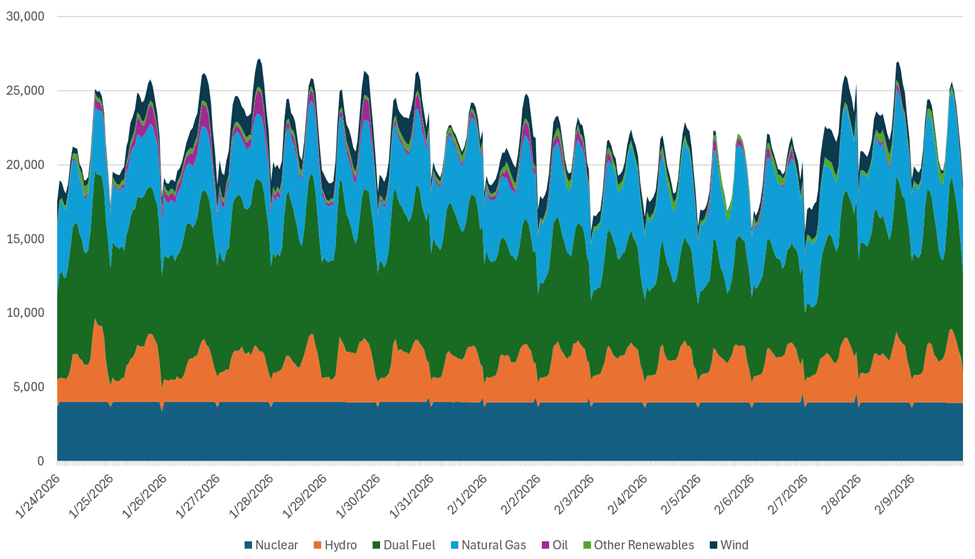
Table 1: Summary of Daily NYISO Realtime Fuel Data Mix (MWh) January 24 to February 9, 2026
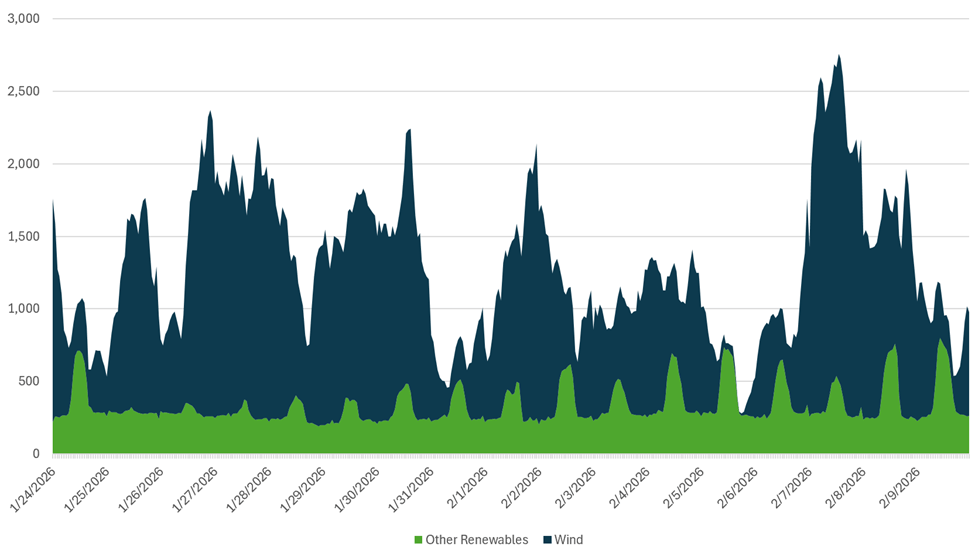
These data do not show the contribution of wind and solar well. “Other Renewables” includes solar energy (394 MW of “front-of-the-meter solar”), energy storage resources (63 MW), methane, refuse, or wood. The methane, refuse and wood facilities show up as the relatively constant base in Figure 3. Assuming that the 63 MW of energy storage is too small to show up, that means that the utility-scale “front-of-the-meter” solar shows up as the daily green peaks. The snow arrived in New York on the night of 24 January and continued through the next day. Note that utility solar was essentially zero on the 25th and did not return to the level of the 24th until February 2nd.
Figure 3: Hourly NYISO Realtime Fuel Mix Other Renewables and Wind January 24 to February 9, 2026
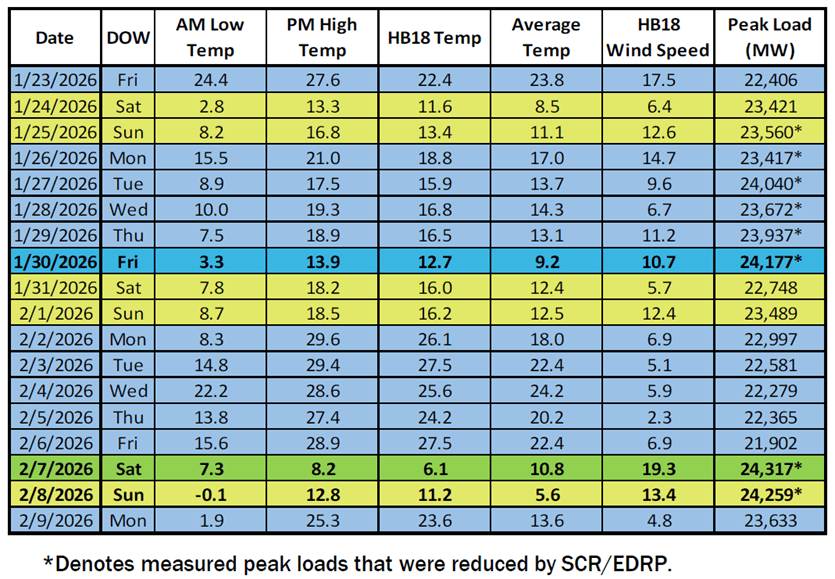
Loads Markham’s presentation summarized the load from January 23 through February 9:
- Highest peak load (24,317 MW) occurred on Saturday, 2/7, aligning with the lowest HB18 temperature (6.1oF) and highest wind speed (19.3 mph) during the period
- SCR/EDRP was called, which reduced the measured peak load by an estimated 400 MW
NYISO documents are heavy on jargon. HB18 temperatures means the load‑weighted average New York Control Area temperature during hour beginning 18:00 (6–7 PM). “SCR/EDRP” refers to two reliability-based demand response programs: Special Case Resources (SCR) and the Emergency Demand Response Program (EDRP).
Table 1: NYCA Weather and Peak Load Statistics For January 23 to February 9, 2026
Source: Winter 2025-2026 Cold Weather Operations Presentation to NYISO Operations Committee March 19, 2025 ©Copyright NYISO 2026. All rights reserved.
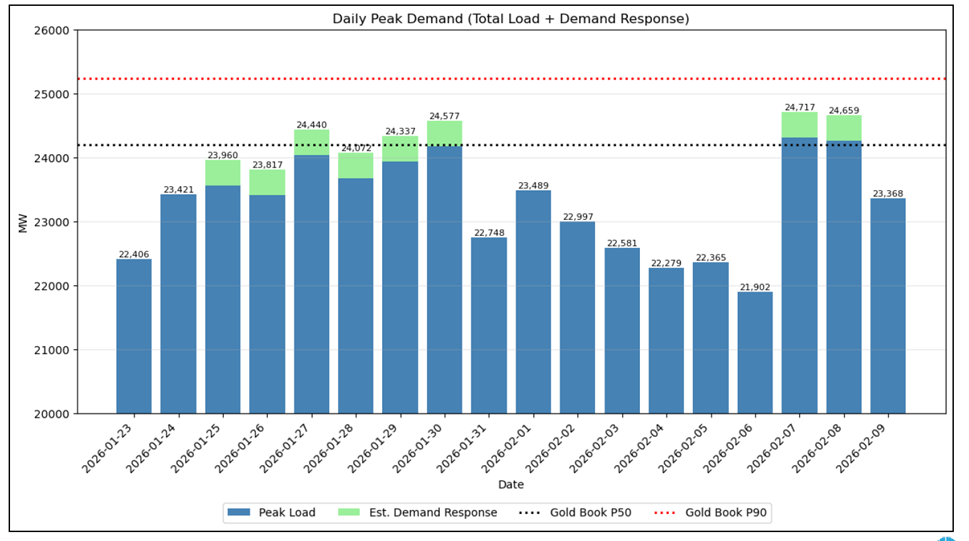
This article is not going to describe the SCR/EDRP resources and what these results mean but I will define what they mean. Special Case Resources (SCR) are demand response or behind-the-meter generation resources enrolled in the ICAP market that commit to be available to reduce load when NYISO calls an emergency event. Emergency Demand Response Program (EDRP) is an emergency-only demand response program that pays for voluntary load reductions during NYISO-declared emergencies but does not provide capacity payments.
These resources do impact observed load as shown in Figure 4. The blue bars represent the observed load and the light green the estimated reduction in load due to the SCR/EDRP programs. The dotted lines represent the projected daily peak load from the NYISO annual load and capacity data report universally known as the “Gold Book”. The P50 load forecast is the “most likely” baseline forecast. Tt represents the expected New York Control Area (NYCA) load under expected future weather conditions, with the load-modifying impacts already included. The P90 estimate is the weather-uncertainty “stressed weather” forecast case for a colder-than-expected winter peak episode. Demand during three days during the cold snap were about equal to the baseline peak load forecast of 24,200 MW. If the SCR/EDRP demand response programs were not available, then five days would have exceeded the baseline forecast topping out at 24,717 MW on 2/7/26.
Figure 4: Daily Peak Load and Estimated SCR/EDRP Impact
Source: Winter 2025-2026 Cold Weather Operations Presentation to NYISO Operations Committee March 19, 2025 ©Copyright NYISO 2026. All rights reserved.
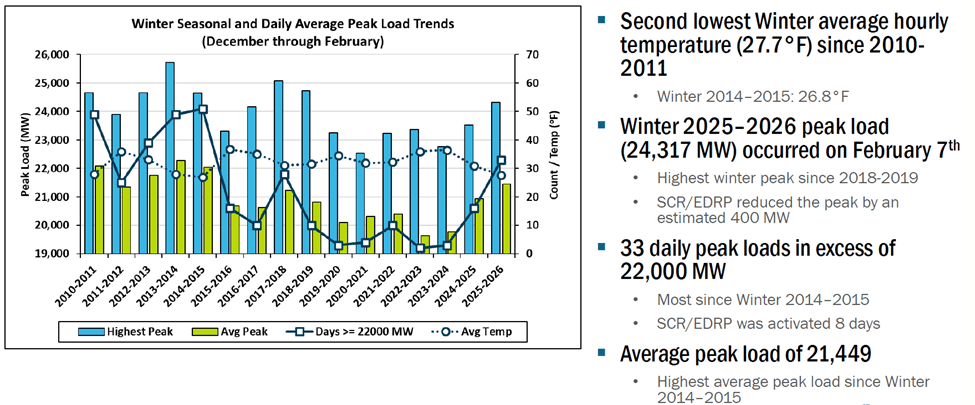
Figure 5 puts the peak loads in perspective. The cold weather this winter was the second lowest winter average since 2010-2011. The winter 2025–2026 peak load (24,317 MW) occurred on February 7th and was the highest winter peak since 2018-2019. Note that the SCR/EDRP demand reduction programs reduced the peak by an estimated 400 MW and was activated eight days. There were 33 daily peak loads in excess of 22,000 MW which is the most since winter 2014–2015
Figure 5: Winter 2025–2026 Daily Peak Loads In Perspective
Source: Winter 2025-2026 Cold Weather Operations Presentation to NYISO Operations Committee March 19, 2025 ©Copyright NYISO 2026. All rights reserved.
Renewables vs. Load
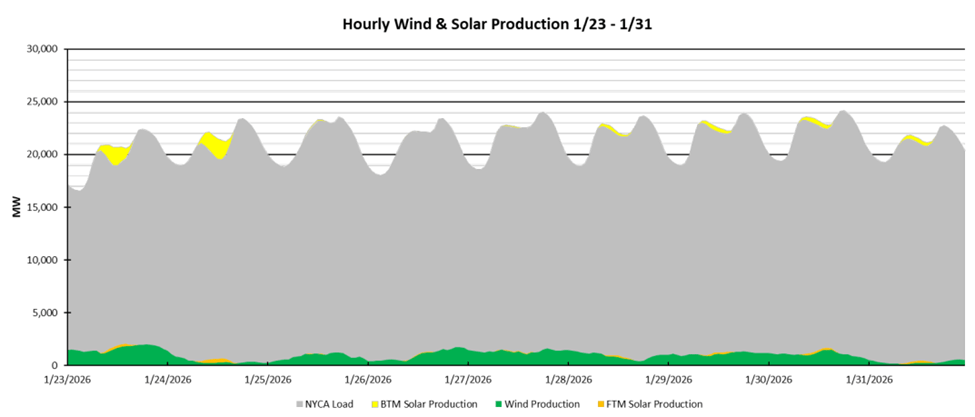
The NYISO Winter 2025-2026 Cold Weather Operations summarizes the NYCA renewables and load for the January and February portions of the cold snap in Figures 6 and 7. Relative to the total load it is clear that wind and solar under performed during the event. By 25 January solar output was essentially zero and did not provide much support until 4 February.
Figure 6: NYCA Renewables vs. Load – January 23 – 31, 2026
Source: Winter 2025-2026 Cold Weather Operations Presentation to NYISO Operations Committee March 19, 2025 ©Copyright NYISO 2026. All rights reserved.
Figure 7: NYCA Renewables vs. Load – February 2 – 9, 2026
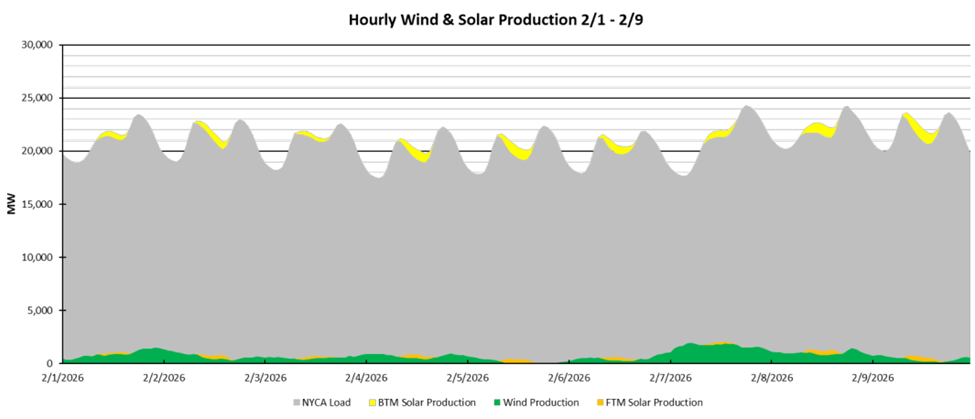
Source: Winter 2025-2026 Cold Weather Operations Presentation to NYISO Operations Committee March 19, 2025 ©Copyright NYISO 2026. All rights reserved.
The observed lack of solar is an important result. It shows that when there was a large snowstorm, all the solar resources in New York produced virtually nothing to support the system when there were significant peak loads. Wind performed better but still was only a small component of the total generation. It is impossible to resolve this by building more solar and wind because all New York weather-reliant generating resources ares correlated. One way to resolve this is to build energy storage but the amount of storage necessary is overwhelming. All the responsible projections for future energy resources that rely on solar and wind resources agree that a new dispatchable emissions-free resource (DEFR) is needed for these situations.
Discussion
This article simply describes the observed renewable energy production and loads during the episode with the day with this winter’s coldest temperature and peak load. Solar resources performed poorly during the episode and on the days when the wind gave out the need for DEFR is unquestionable. I intend to follow up with another post describing the implications to future electric resource planning. I expect that NYISO will incorporate their observations of this winter’s weather in their planning. I would not be surprised if revisions result in substantive changes.
Conclusion
The results provided confirm my prior assertions that wind and solar fail to support the system when needed most. Proponents of the Climate Act fail to recognize that electric systems must be built around reliability during peak demand and that this winter’s weather shows how risky the dependence on wind and solar will be without DEFR.
