

Last month I took an initial look at the impact of the January 23-27 winter storm on wind and solar energy production. I showed that dispatchable emissions free resources (DEFR) are necessary to achieve net-zero in New York. This post extends my analysis through the end of the cold snap ending on February 9, 2026.
I am convinced that implementation of the Climate Leadership & Community Protection Act (Climate Act) net-zero mandates will do more harm than good if the future electric system relies only on wind, solar, and energy storage because of reliability and affordability risks. The opinions expressed in this article do not reflect the position of any of my previous employers or any other organization I have been associated with, these comments are mine alone.
Overview
The Climate Act established a New York “Net Zero” target (85% reduction in GHG emissions and 15% offset of emissions) by 2050. Among its interim 2030 targets is a 70% renewable energy electricity mandate and 100% zero emissions electric generation in 2040.
In a recent article I noted instances where Governor Hochul and Public Service Commission Chair Rory Christian have raised the possibility for limited changes to the Climate Act interim targets. A recent article by Emily Pontecorvo summarizes the Green Energy Blob take on decarbonization but does not mention reliability risks of renewable energy. Those folks do not understand that electric systems must be built around reliability during peak demand. One of my primary concerns with the Climate Act weather-reliant renewable energy mandates is correlated variability because the conditions that characterize the highest loads also have the weakest expected wind and wintertime solar resource availability. That makes electric resource planning for reliability during the peak period especially challenging.
From January 23 to January 27, 2026, a very large and expansive winter storm caused deadly and catastrophic ice, snow, and cold impacts from Northern Mexico across the Southern and Eastern United States and into Canada. In New York total snow/sleet accumulation ranged from 8-13” near the coast and 12-17” across the interior. As the precipitation ended a glaze of freezing rain occurred. Following the storm there was a period of prolonged sub-freezing weather.
I summarized the weather and load impacts of the January 23 – February 9 extreme weather episode in a recent post that was based on two New York Independent System Operator (NYISO) documents: a presentation titled Winter 2025-2026 Cold Weather Operations (“Winter Operations”) by Aaron Markham, NYISO Vice President Operations and the February 2026 Operations Performance Metrics Monthly Report. This post relies on two additional NYISO sources of data: New York fuel-mix load data are available at the NYISO Real-Time Dashboard and the January Operations Performance Metrics Monthly Report.
NYISO Daily Energy Production
Figure 1 combines the net wind and solar performance data figures from the Operations Performance Metrics reports for the 2026 Winter episode. It shows that solar energy production was near zero during and immediately after the snowstorm. I interpolated data off this figure for the analysis described below.
Figure 1: Net Wind and Solar Performance Total Daily Production and Capacity Factors
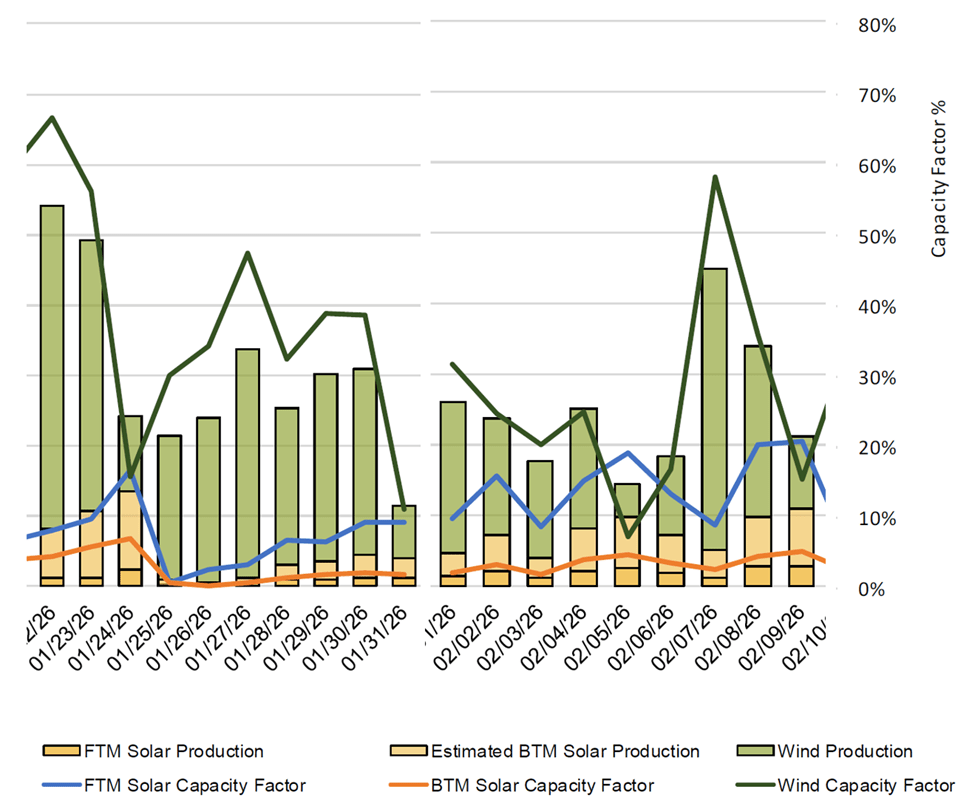
Source: NYISO January and FebruaryOperations Performance Metrics Monthly Reports
©Copyright NYISO 2026. All rights reserved.
Table 1 combines data from the dashboard and the Operations Performance Metric reports. I have previously described my use of the dashboard real-time fuel mix data to calculate daily energy use (MWh). The generator types include real-time fuel mix data base “Hydro” that includes pumped storage hydro; “Other Fossil Fuels” is oil; “Nuclear”; “Natural Gas”; and “Dual Fuel” which are units that burn both natural gas and oil. Two renewables are shown. “Wind”, mostly land-based wind but does include 136 MW of offshore wind from the NYISO real-time fuel mix data base. That source is also used for “Other Renewables” that covers solar energy (394 MW of “front-of-the-meter solar”), energy storage resources (63 MW), methane, refuse, or wood. The performance metric reports break out the wind, utility-scale solar, also known as Front of the Meter (FTM) solar, and the rooftop top solar, also known as Behind the Meter (BTM) solar total daily production and capacity factors. In this table, I subtracted the FTM solar data from the Performance Metric Report data.
Table 1: Daily NYISO Energy Production (MWh) January 23 to February 9, 2026
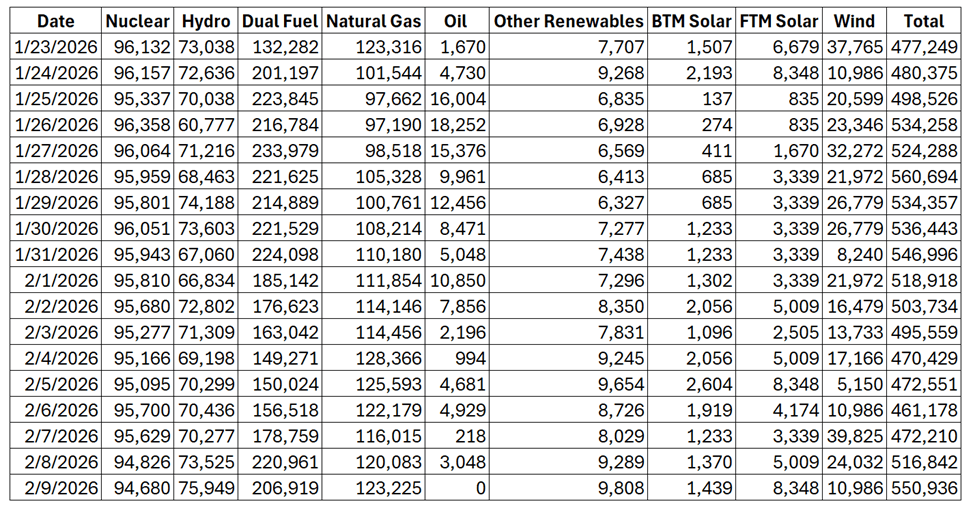
Table 2 includes two data sets. The top table lists resource capacity (MW) from the Operations Performance Metrics Monthly Report for solar and wind resources. The main body of the table lists the calculated renewable daily energy (MWh) for each parameter and the renewable percentage of the total system energy based on my analysis of the real-time fuel mix data. Note that wind and solar produced less than 10% of the total energy production for 17 consecutive days during an extremely cold period with high loads and seven of those days had renewable production under 5% of the total generation.
Table 2: Resource Capacity (MW) from Operations Performance Metrics Monthly Report, Calculated Renewable Daily Energy (MWh), and Realtime Total System Energy (MWh)
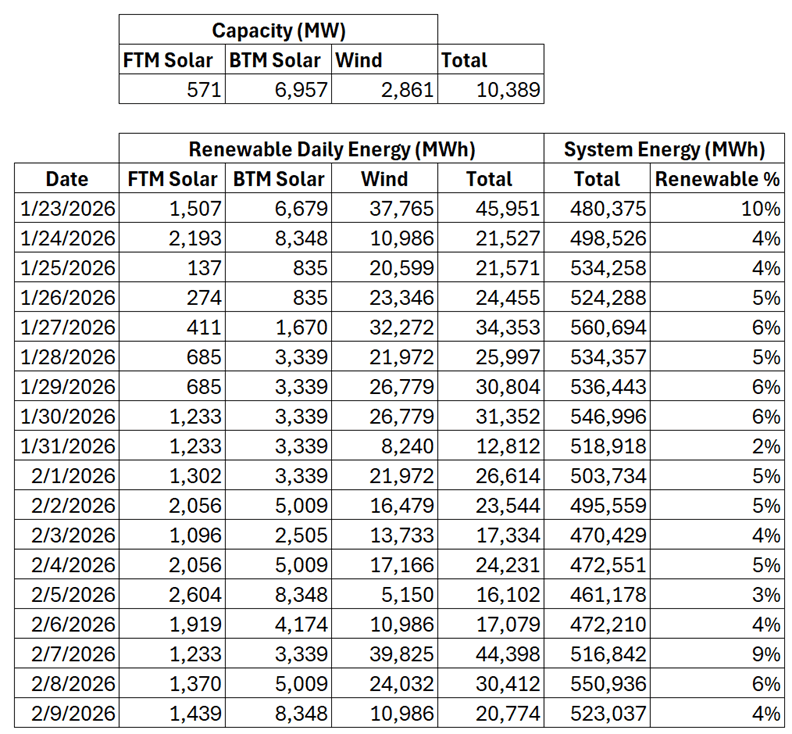
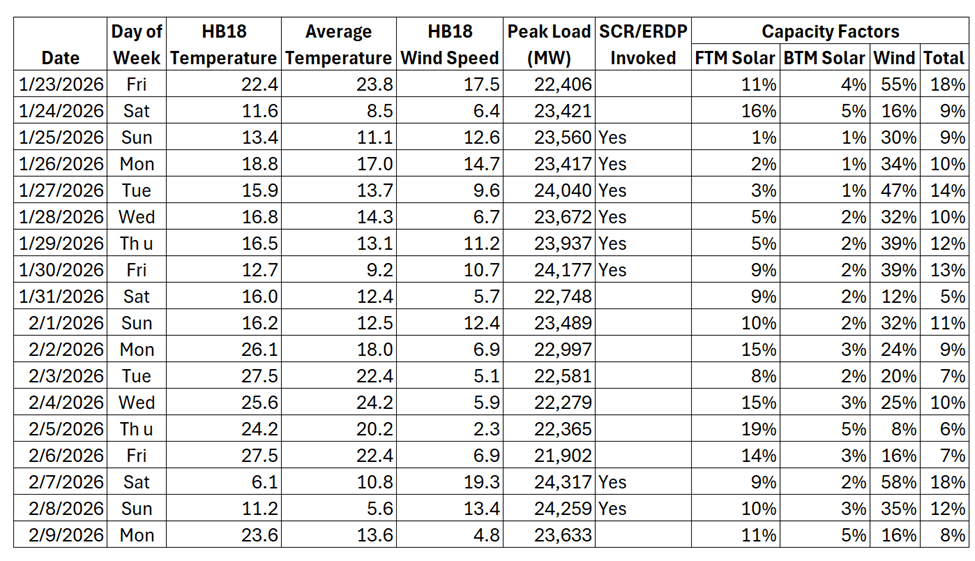
Table 3 combines a table from Markham’s Winter Operations presentation that summarizes the load and weather from January 23 through February 9 and the daily capacity factors calculated using Table 2 data. Markham pointed out that:
- Highest peak load (24,317 MW) occurred on Saturday, 2/7, aligning with the lowest HB18 temperature (6.1oF) and highest wind speed (19.3 mph) during the period
- SCR/EDRP was called, which reduced the measured peak load by an estimated 400 MW
NYISO documents are heavy on jargon. HB18 temperatures means the load‑weighted average New York Control Area temperature during hour beginning 18:00 (6–7 PM). “SCR/EDRP” refers to two reliability-based demand response programs: Special Case Resources (SCR) and the Emergency Demand Response Program (EDRP). Were it not for those programs the peak loads would have been around 400MW higher.
The capacity factor results are particularly important for the Public Service Law 66-P renewable energy program component of the Climate Act. This law mandates increased use of renewable energy. For the days when the electric system was stressed enough that the NYISO requested demand response programs note that on the renewable capacity factor on the best day was 18%. That result is because of weather conditions and will not change appreciably however much new renewable capacity is added. As a result, if, for example, the NYISO determines that they need another 1,000 MW of energy, then providing that using renewables will require at least 5,000 MW of capacity. That is for the best case! To cover the 24th of January 10,000 MW of additional renewable energy capacity is needed.
Table 3: New York Control Area Weather and Peak Load Statistics and Renewable Capacity Factors for January 23 to February 9, 2026
Dark Doldrum
This episode is a great example of what the Germans call “Dunkelflaute” and I have called the dark doldrums. This refers to episodes when solar resource availability is reduced due to the length of day or clouds and there are light winds. Based on this episode we know that dark doldrums impacts can be exacerbated by the snow that covered solar panels with enough snow to eliminate production (Figure 1). Note that most rooftop solar in New York City is essentially flat so snow cover is this is a significant issue there. I am going to have to amend my worst weather label to “snowy dark doldrums”.
DEFR and Peaking Units
In an article last month I showed earlier that these conditions are the fundamental driver of the need for DEFR. It is disappointing that clean energy advocates have continued to argue that the size of the DEFR gap has been overstated even after all the agencies responsible for electric system reliability argue otherwise. These results should put those arguments to rest. In this analysis, I take a slightly different approach to demonstrate both the need for DEFR and dispute arguments that things like Virtual Power Plants can replace the need for DEFR and existing electric system peaking power plants.
In New York State, peaking power plants have been vilified by environmental advocates because they emit more pollutants and are expensive to operate during peak demand periods. However, their essential role in providing power when the grid is most strained is often overlooked, as some proponents argue that their output can be replaced by expanded demand response programs, energy storage systems, and Virtual Power Plants (VPPs)
My analysis of the January data and VPP showed that the lack of renewable energy recharge means that the short-term energy storage systems will be completely exhausted early in a snowy, dark doldrum event and will not be recharged for days. This raises the question why we would want to invest in something that may save some short tern money, but when it inevitably fails the costs will be greater than the savings and potentially threaten lives in the ensuing blackout.
One rationale for virtual power plants (VPPs) is that they could reduce or even eliminate the need for peaking power plants. Estimating how much electricity peaking units produce compared to other fossil-fired plants involves considerable interpretation. However, it is clear that oil-fired power plants operate as peaking units—the high cost of oil relative to natural gas ensures they are dispatched only when needed to meet peak demand.
Figure 2 from the Winter Operations presentation lists the Real-Time Dispatch schedule of alternative fueled units during the 2026 extreme winter weather episode. In other words, this represents the shows the use of oil-fired units. Two fuels stand out: Ultra Low Sulfur Oil (ULSO) and Oil #6. ULSO is burned in New York City at several of the vilified peaking power plants. There are a small number of oil-fired steam boilers that use residual oil (#6). The Winter Operations report notes that an estimated 2 million MWh were produced from liquid fuels during this period.
Figure 2: Alternative Fuel Mix Plot for January 23 – February 9, 2026
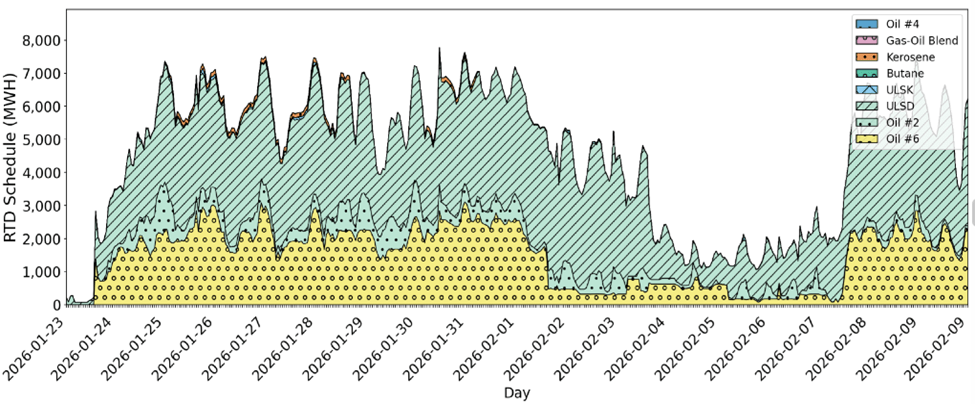
Source: Winter 2025-2026 Cold Weather Operations Presentation to NYISO Operations Committee March 19, 2025 ©Copyright NYISO 2026. All rights reserved.
These observations allow us to estimate how much additional renewable capacity would be required to replace the 2 million MWh supplied by oil. The total renewable energy produced over this period was 469,308 MWh. During peak load periods with limited renewable output, it is likely that all short-term energy storage would be depleted early, leaving insufficient renewable generation to both meet demand and recharge storage systems. The overall renewable capacity factor in this episode was only 10% so replacing the oil-fired generation would require expanding renewable capacity from the current 10,389 MW to approximately 100,000 MW. This level of expansion is clearly unrealistic, reinforcing the conclusion that DEFR is essential.
Discussion
Large wind and solar capacities do no good when the sun doesn’t shine and the wind doesn’t blow. This period exemplifies a period where that situation is evident. Addressing this problem is a major concern of the NYISO resource planners.
I wish I could say that Governor Hochul understands the magnitude of this challenge. Alas, Governor Hochul recently claimed that “Since I have been Governor, more than $88.7 billion has been invested in clean energy through programs that have made us an example for the rest of the nation.” I am not sure that investments that produced less than 10% of the total energy production for 17 days during an extremely cold period with high loads is an example anyone else would want to emulate.
My last concern is that DEFR is indispensable for a renewables heavy system, yet there is still no concrete plan to commercialize and deploy any DEFR technology at the scale required. Significant technical, economic, and regulatory uncertainties remain for all proposed DEFR options, so assuming that a viable solution will simply emerge in time amounts to taking an extraordinary reliability risk with the bulk power system.
If nuclear ultimately proves to be the only practical DEFR candidate, then a grid architecture centered on wind, solar, and short duration storage cannot be implemented reliably without large scale nuclear generation. However, nuclear power is best suited to continuous, high capacity factor operation, so holding it in reserve as an infrequently used DEFR “backup” misuses the technology and wastes its economic advantages.
Nuclear generation instead should serve as the backbone of a decarbonized electric system, providing the bulk of firm capacity and energy, with wind, solar, and storage playing complementary roles. In that case, the only realistically workable path to deep decarbonization may be a nuclear centered system model, implying that large scale investment in a wind , solar , and storage only strategy would amount to pursuing a “false solution” that cannot stand on its own without nuclear support.
Conclusion
The extreme winter weather episode of January 23 – February 9, 2026, has major implications for New York Climate Act implementation. The current debate about the possibility for limited changes to the Climate Act interim targets has focused on cost impacts. However these unacknowledged findings of reliability risks make an equally strong case for consideration of changes to the Climate Act.
