

I recently published an article about cold weather operations in New York during the most extreme cold weather episode that described other articles I wrote that addressed the impacts of the cold weather. This article describes the New York Independent System Operator (NYISO) summary of the renewable energy covering all of 2025 for the New York Control Area (NYCA)
I am convinced that implementation of the Climate Leadership & Community Protection Act (Climate Act) net-zero mandates will do more harm than good if the future electric system relies only on wind, solar, and energy storage because of reliability and affordability risks. The opinions expressed in this article do not reflect the position of any of my previous employers or any other organization I have been associated with, these comments are mine alone.
Overview
The Climate Act established a New York “Net Zero” target (85% reduction in GHG emissions and 15% offset of emissions) by 2050. Among its interim 2030 targets is a 70% renewable energy electricity mandate and 100% zero emissions electric generation in 2040. These mandates presume reliance on wind and solar. I believe that the poor wind and solar resource availability described in this post make it impossible to achieve the aspirational renewable mandates and continue to provide safe and adequate electricity.
Electric systems must be built around reliability during peak demand. One of my primary concerns with the Climate Act weather-reliant renewable energy mandates is correlated weather-dependent resource variability because the conditions that characterize the highest loads also have the weakest expected wind resource availability. That makes electric resource planning for reliability during the peak period especially challenging.
NYCA Renewables 2025
Cameron McPherson, NYISO Senior Operations Analysis & Services Analyst, presented the following document at the NYISO Installed Capacity Working Group (ICAPWG}and Market Issues Working Group MIWG meeting on April 8, 2026. There are five sections in the presentation:
- Wind Performance
- Behind the Meter (BTM) and Front of the Meter (FTM) Solar Performance
- Real-Time Market Curtailments
- Coincident Wind and Solar
- Load Ramps
Slide 3 in the presentation (Figure 1) documents the metrics used. Offshore wind data is not reported because there is only one active facility and NYISO does not report individual unit information. Past presentations and datasets are also available, Annual Renewable Presentations and hourly data sets from prior years can be found at the this primary link ant the locations below.
- BTM Solar Information is available under ‘Links’
- Annual Wind and Solar Information is available under ‘Reports’
Figure 1: Slide 3 from NYCA Renewables 2025
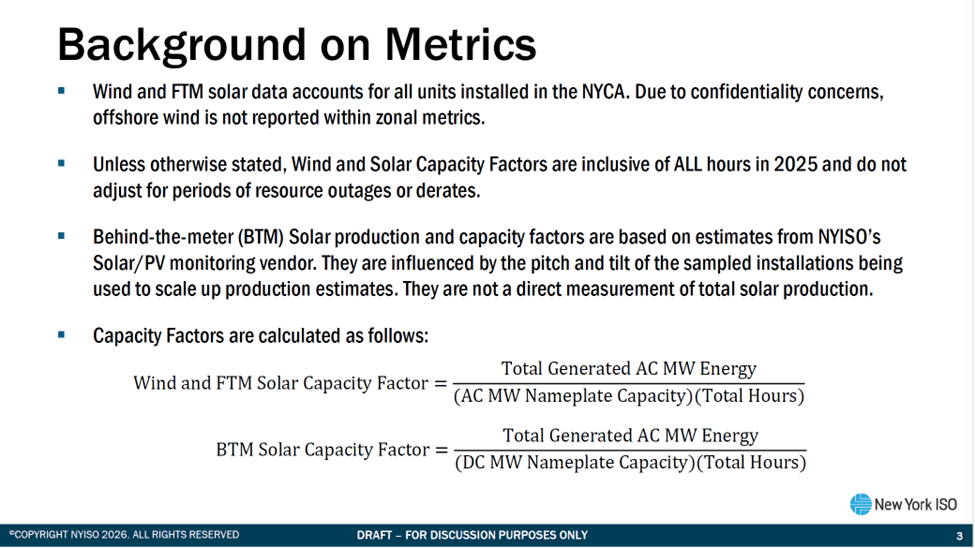
Source: NYCA Renewables 2025
I am not going to describe all the material in the presentation. I will limit this to the overviews of solar and wind, and the annual and monthly capacity factors for the renewable energy resources. There is much more interesting information in the presentation, so I encourage you to read the document.
NYCA Wind Performance
Figure 2 summarizes the wind nameplate capacity since 2005. It is notable that there really hasn’t been an appreciable uptick in wind development since the passage of the Climate act in 2019. That is going to change because the State and renewable energy developers have so rigged the permitting system now that any local objections are over-ruled and environmental protections are ignored.
Figure 2: Slide 6 from NYCA Renewables 2025
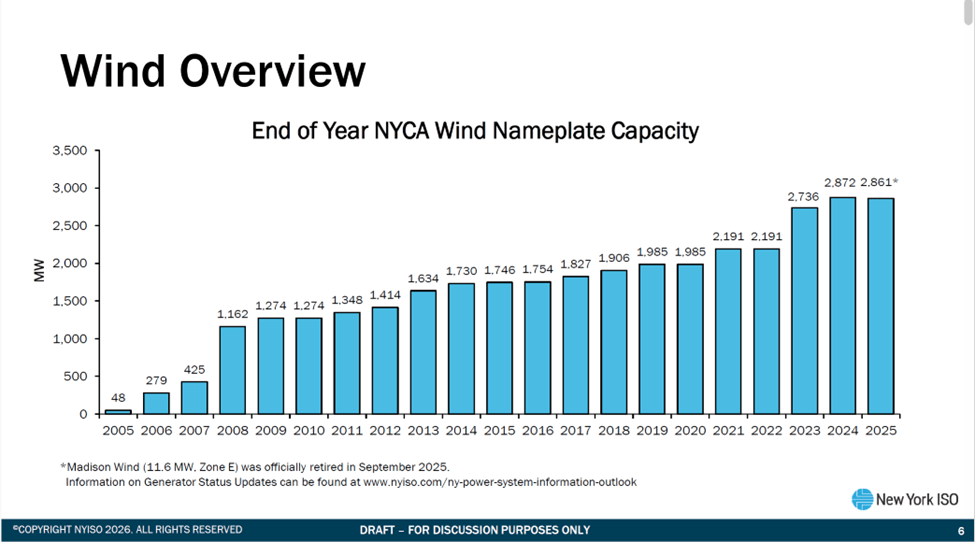
Source: NYCA Renewables 2025
Wind and solar generating resources are intermittent. The standard metric for measuring generating availability is the capacity factor. It is defined as the percentage of the electricity a power plant actually generates over a period of time compared to what it could have generated if it ran at full power the entire time. Figure 3 describes NYCA monthly and annual wind capacity factors over the last four years. There is interannual variation – some years are windier. Note, however, that the last year may be affected by the addition of an offshore wind facility that we would expect to have higher capacity. On a monthly basis there is a lot of variation. In 2025, the windiest month, March had a capacity factor of 44% while September was only 12%. The good news is that wind is available more in the winter when we expect solar to be less because the days are shorter and the sun is lower in the sky.
Figure 3: Slide 9 from NYCA Renewables 2025
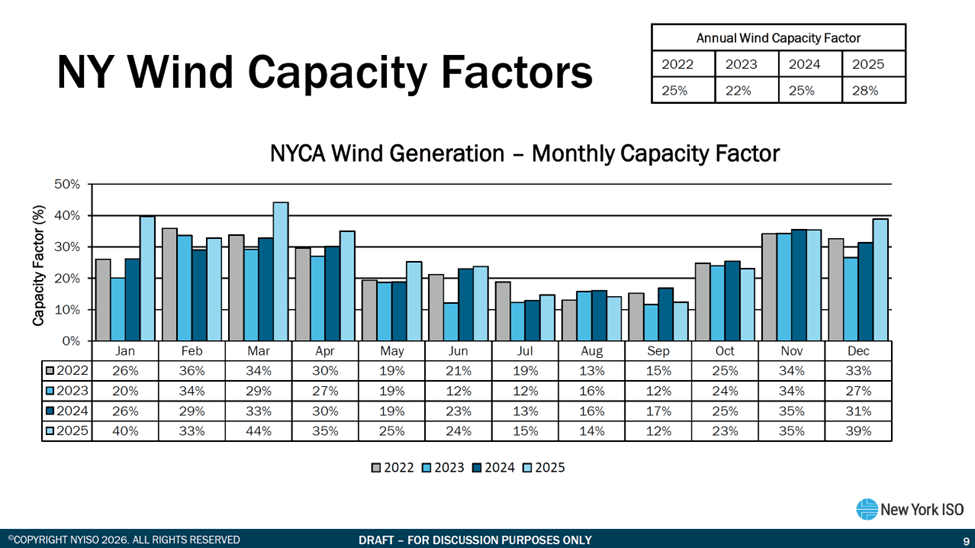
Source: NYCA Renewables 2025
Figure 4 lists the frequency of hourly capacity factors in 2025. There were less than 1,000 hours when the capacity factor of all the wind generators in the state were between 0% and 5%. I added the annual percentages on the right for the hourly frequency labels on the left. The less than 1,000 hours when the capacity factor of all the wind generators in the state were between 0% and 5% is somewhere between 9% and 11% of the annual hours. I included this to show that the wind capacity factor across New York State was less than 10% for nearly a quarter of the hours. At the other end, there are less than 20% of the hours when the statewide capacity factor exceeds 50%. New York does not have an impressive wind resource capacity.
Figure 4: Slide 12 from NYCA Renewables 2025
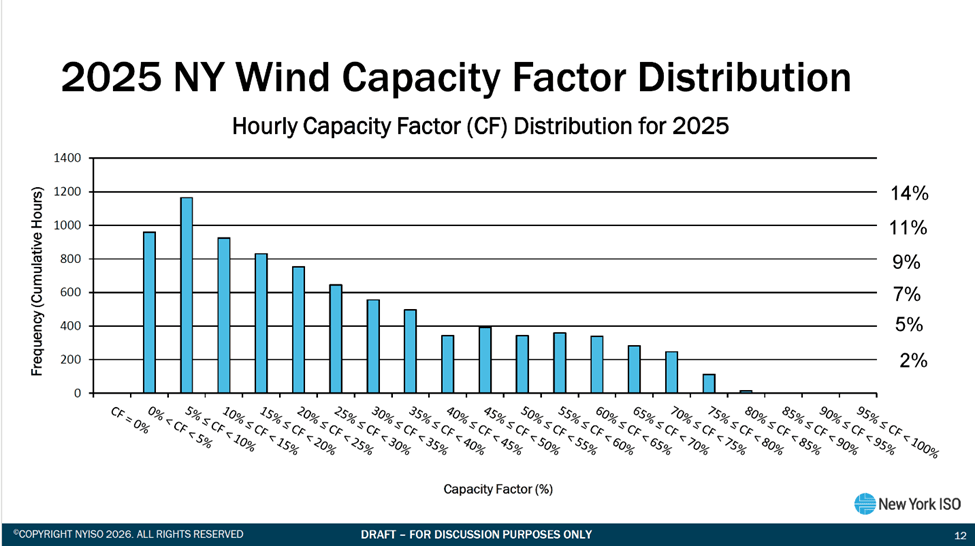
Source: NYCA Renewables 2025
NYCA Solar Performance
Figure 5 describes the Behind-the-Meter (BTM) solar methodology. These solar resources are the rooftop solar panels that are not directly monitored by NYISO. To provide the data, NYISO depends on a vendor who has instrumented a representative sample of sites across the state. Those measurements are combined with the estimated solar capacity to estimate solar production. This slide describes the process.
Figure 5: Slide 14 from NYCA Renewables 2025
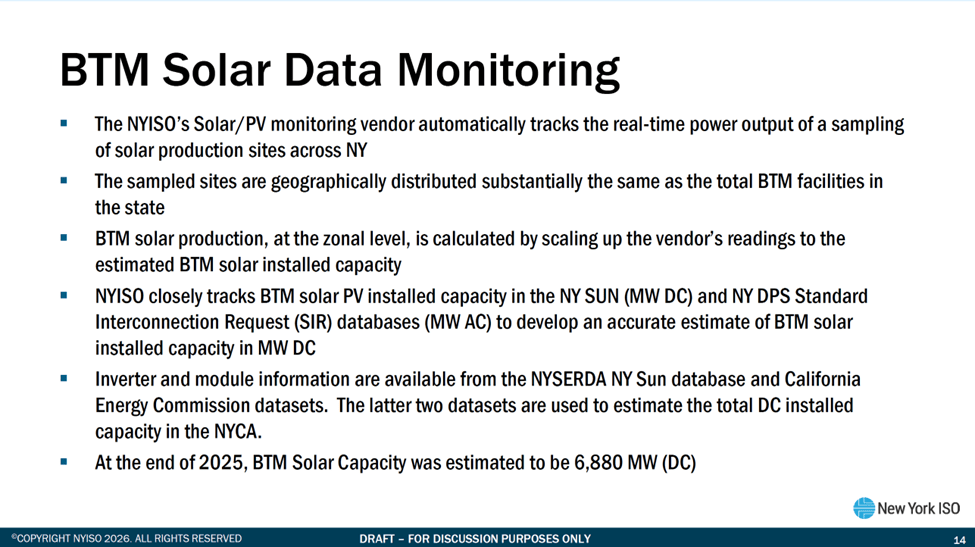
Source: NYCA Renewables 2025
Figure 6 summarizes the solar nameplate capacity since 2018. The Climate Act set a goal of 6 GW of distributed photovoltaic solar generation by 2025 and met the target in 2024.
Figure 6: Slide 15 from NYCA Renewables 2025
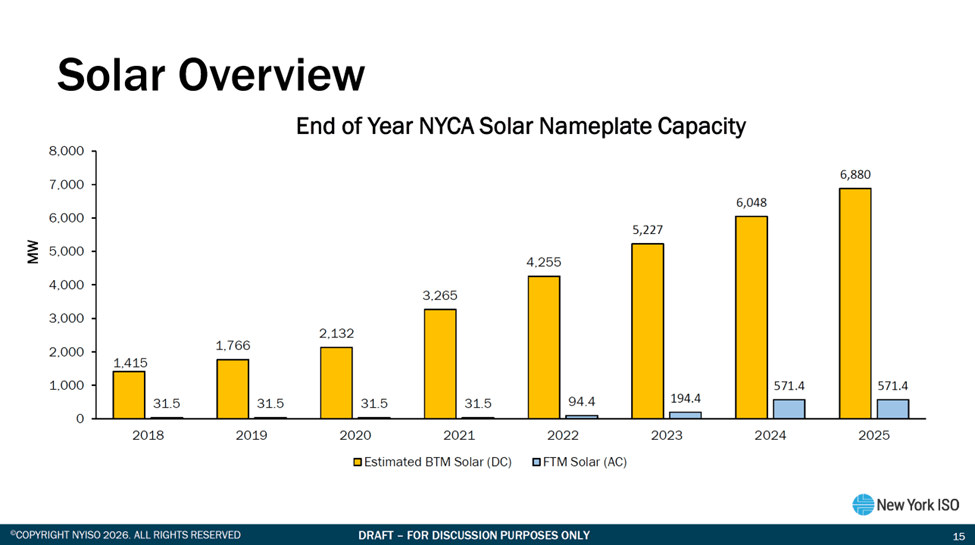
Source: NYCA Renewables 2025
One of the more naïve presumptions by the authors of the Climate Act was the idea that success in other jurisdictions would lead to similar results in New York. The available solar resources in California and Texas are the not the same as New York. Figure 7 describes NYCA monthly and annual BTM solar capacity factors over the last four years. There should be no surprise that at New York’s latitude January and December capacity factors are very low and that brings down the annual capacity factors. In the best year rooftop solar was only 13% of the total possible.
Figure 7: Slide 18 from NYCA Renewables 2025
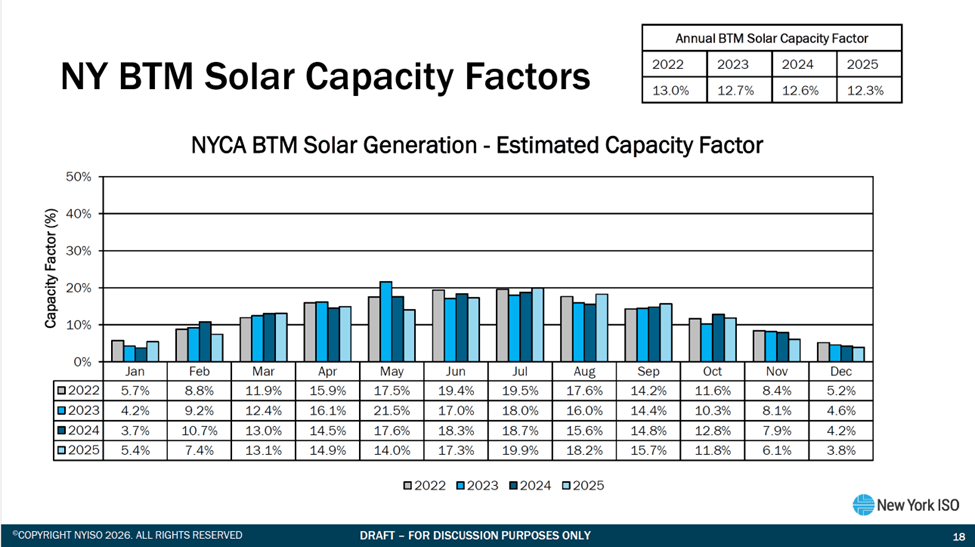
Source: NYCA Renewables 2025
Figure 8 describes NYCA monthly and annual FTM or utility solar capacity factors over the last four years. Utility-scale developments are sited to maximize the availability of solar resources and there is an improvement of annual capacity from 13% to 19%. Of course, nothing can improve the length of the day so solar drops significantly in the winter.
Figure 8: Slide 20 from NYCA Renewables 2025
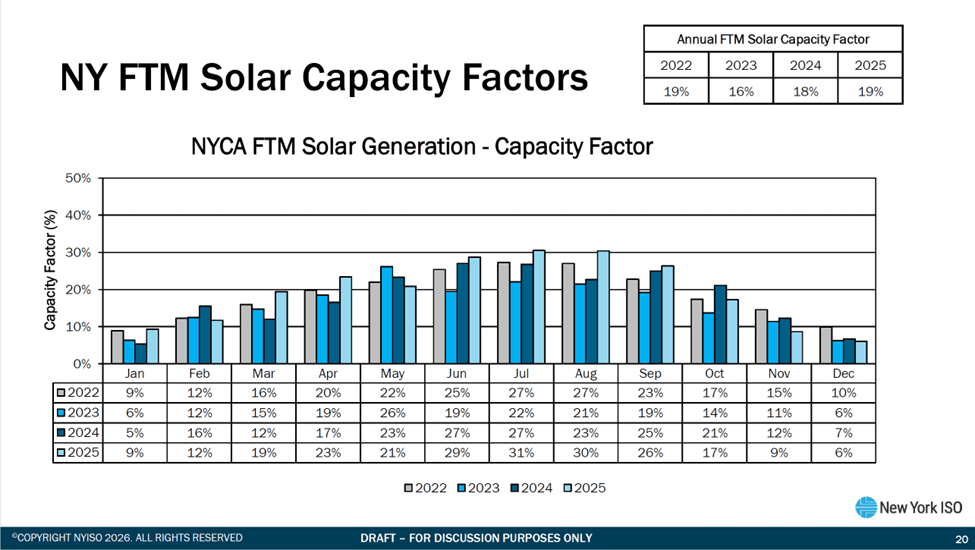
Source: NYCA Renewables 2025
Curtailments
Figure 9 “Background on Curtailment Metrics” explains the criteria for curtailments. The NYISO’s real-time market economically evaluates bids submitted by wind and FTM solar resources and when forecasted generation is uneconomic, wind and FTM solar resources are instructed to limit their output to economic levels. This section finds that real-time market curtailments associated with transmission constraints are the primary current driver of curtailments. Those can be outages for maintenance, repair or upgrades or something that requires upgrades to the system. All those who claim that the Climate Act does not affect utility rates must ignore that the costs for these transmission improvements are buried in the rate cases. Someday the over build necessary to supply peak loads with as much renewable as possible will shift the reason for curtailments to generation-to-load balancing constraints.
Figure 9: Slide 26 from NYCA Renewables 2025
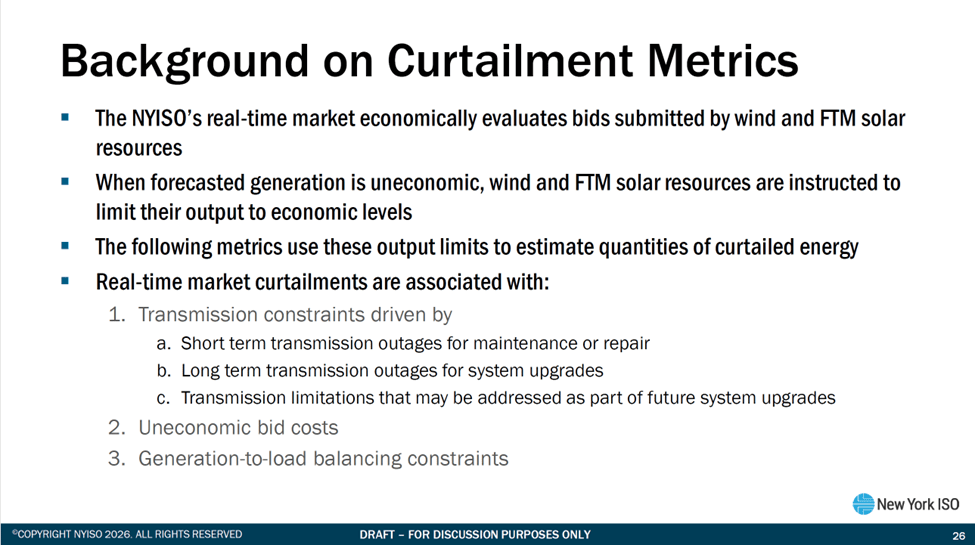
Source: NYCA Renewables 2025
Coincident Wind and Solar
The sections describing wind and solar monthly capacity factors showed that wind was generally higher when solar was generally lower and vice versa. This suggests that together they might be dependable. However, both parameters must be considered at the same time. Figure 10 describes monthly performance in 2025 and supports the idea that the combined wind and solar support each other.
Figure 10: Slide 36 from NYCA Renewables 2025
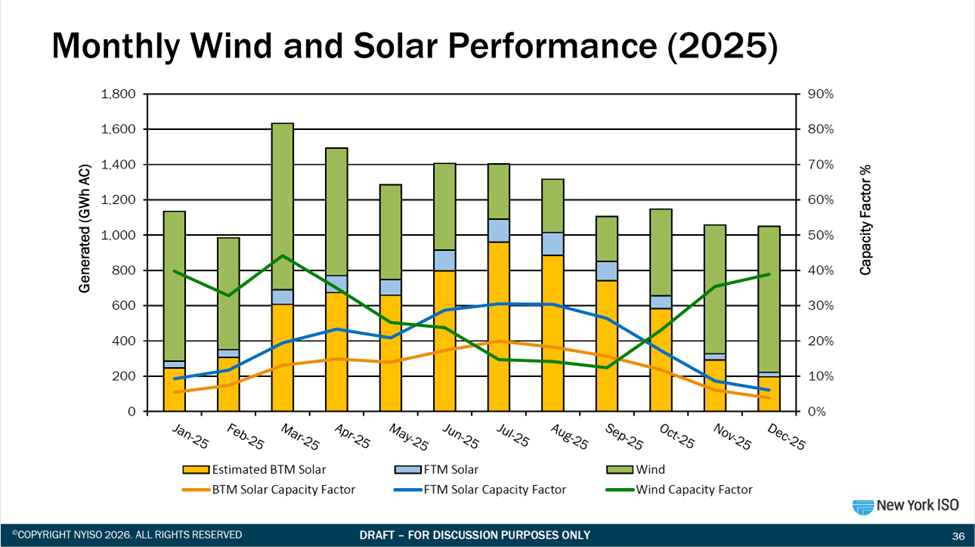
Source: NYCA Renewables 2025
NYISO grid operators match generating resources to load variations. If that process worked on a monthly time scales it would be easy and this observation would be relevant, but operators must match load constantly at minute intervals. Even the wind and solar daily performance shows the challenge of constantly meeting load. In Figure 11 the total daily renewable energy production started at 36 GWh, rose to 58 GWh but plunged to 12 GWh later in the first week. To support the “free” renewable resources, other resources must be maintained so that they can be turned on during dark doldrums when the weather does not cooperate.
Figure 11: Slide 37 from NYCA Renewables 2025
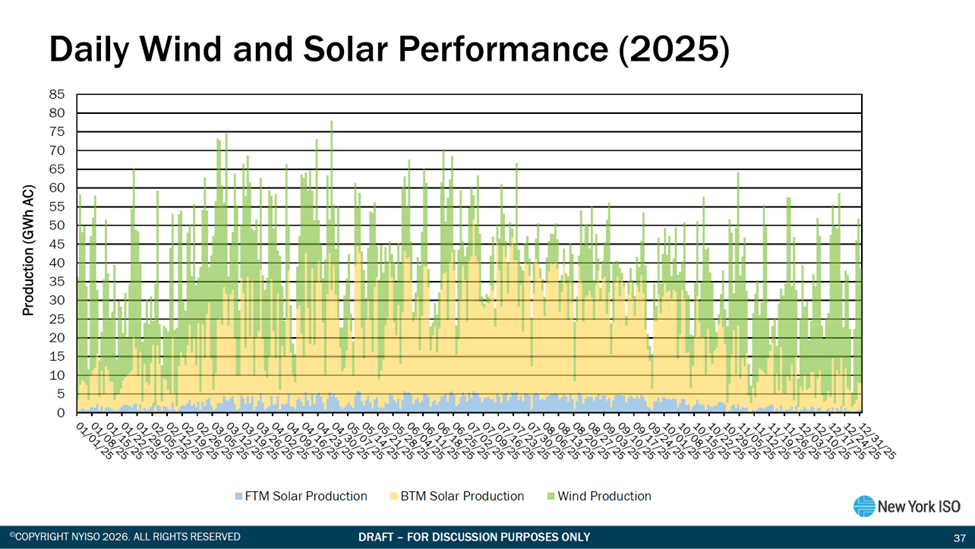
Source: NYCA Renewables 2025
On an hourly basis the challenges are greater. Figure 12 describes wind and solar performance during summer peak loads. Obviously, NYISO must deal with diurnal solar availability. Also note that wind and mostly solar appreciably reduce the generation needed from other resources for this example peak. Based on this slide I don’t think NYISO has serious “duck curve” concerns yet.
Figure 12: Slide 38 from NYCA Renewables 2025
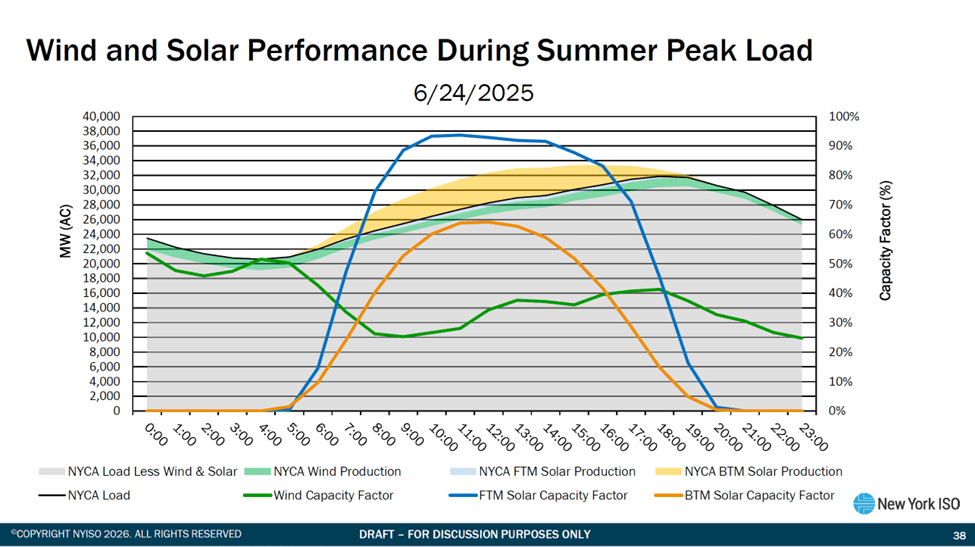
Source: NYCA Renewables 2025
Figure 13 describes wind and solar performance during a winter peak load example. Note that they used this year’s winter peak as an example. It appears that wind and solar make up a smaller proportion of the total load provided so can be relied on less in the winter.
Figure 13: Slide 39 from NYCA Renewables 2025
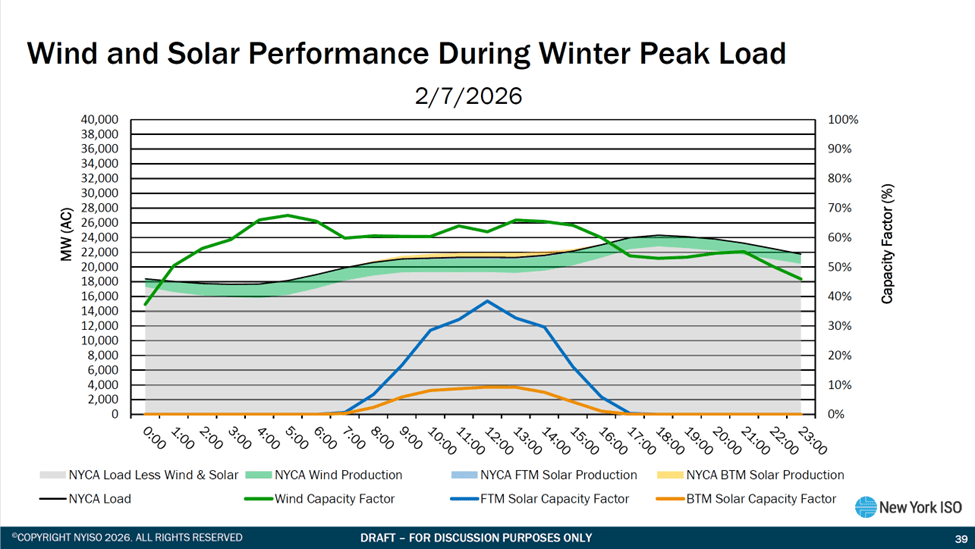
Source: NYCA Renewables 2025
NYCA Renewables 2025 includes a section describing “Load Ramps” that addresses the NYISO system load concerns related to short-term changes to the operating loads. I am not going to describe any slides from this part of the presentation because I do not understand it well enough to explain it to others. For most of my readers it is sufficient to know that there is a concern that wind and solar resources could change so quickly that operators would not be able to adjust other generating units to compensate. The results indicate that the NYISO has this under control.
Discussion
A few observations based on the data.
On March 20, 2026 Governor Hochul stated in an exclusive opinion piece in New York Empire Report that “Since I have been Governor, more than $88.7 billion has been invested in clean energy through programs that have made us an example for the rest of the nation.” I noted that the BTM 2025 target was achieved a year early. However, other goals are in trouble.
I cannot break out the renewable capacity additions since she has been Governor but the nameplate capacities in Figures 1 and 5 enable us to calculate the capacity additions since the start of the Climate Act. Table 1 shows that wind capacity has increased 876 MW, BTM solar has increased 5,114 MW and FTM solar has increased 540 MW. This suggests that something has to change but the question is whether it can be done responsibly.
Table 1: Renewable Capacity Additions (MW) since Climate Act
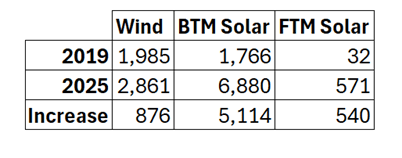
Figure 14 describes emissions free resources in 2025. The Climate Act has a 2030 “70% renewable” target as defined in Public Service Law §66‑p as “a minimum of 70 percent of the state wide electric generation secured by jurisdictional load serving entities…in 2030 be generated by renewable energy systems” (wind, solar, hydro, certain biomass, etc.) The law requires that “by the year 2040…the statewide electrical demand system will be zero emissions.” This is framed as a characteristic of the entire system, not just a percentage of MWh from specific technologies.
Figure 14: Slide 40 from NYCA Renewables 2025
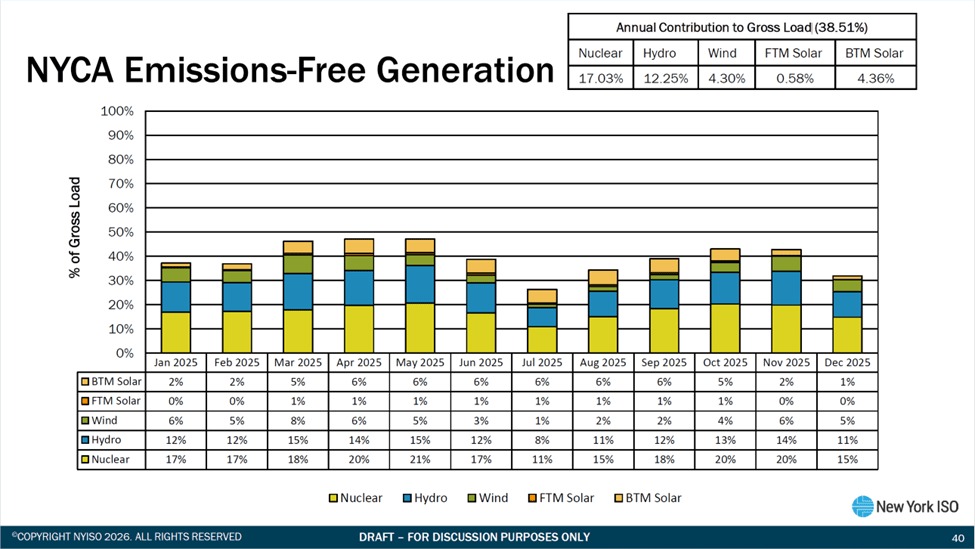
Source: NYCA Renewables 2025
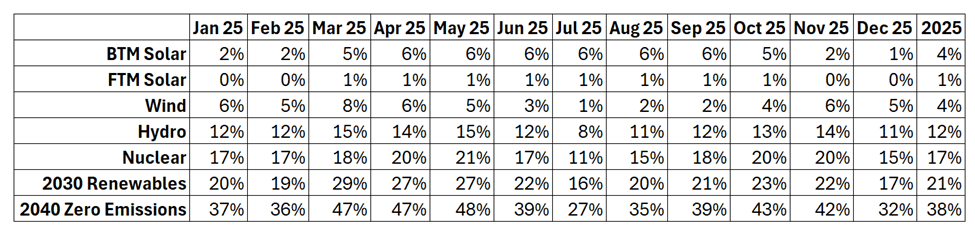
Table 2 compares the observed emissions free data to the 2030 and 2040 targets. In 2025 the sum of solar, wind and hydro contribution to gross load was only 21%, far short of 70%. Adding nuclear to the total, zero emissions are only 38% of the total gross load. Trying to achieve 100% in 15 years is not likely in my opinion.
Table 2: Percentage Contribution to Gross Load
Conclusion
Proponents of renewable energy in New York frequently point to other states and claim that New York should emulate their performance. The fact is that the location and climate of New York are not conducive to wind and solar generating resources. The NYISO summary of 2025 NYCA renewables documents this deficiency well.
