Balancing the risks and benefits of environmental initiatives
Author: rogercaiazza
I am a meteorologist (BS and MS degrees), was certified as a consulting meteorologist and have worked in the air quality industry for over 40 years. I author two blogs. Environmental staff in any industry have to be pragmatic balancing risks and benefits and (https://pragmaticenvironmentalistofnewyork.blog/) reflects that outlook. The second blog addresses the New York State Reforming the Energy Vision initiative (https://reformingtheenergyvisioninconvenienttruths.wordpress.com). Any of my comments on the web or posts on my blogs are my opinion only. In no way do they reflect the position of any of my past employers or any company I was associated with.
On July 18, 2019 former New York Governor Andrew Cuomo signed the Climate Leadership and Community Protection Act (CLCPA), which establishes targets for decreasing greenhouse gas emissions, increasing renewable electricity production, and improving energy efficiency. I have been posting articles about the feasibility of the CLCPA targets and got the following comment in response to my post CLCPA Feasibility Relative to NYSERDA Patterns and Trends: “Please provide a cross reference to the fact that CLCPA includes nuclear power as acceptable form of renewable energy”. This post provides a more complete discussion than my reply.
I have written extensively on implementation of the CLCPA because I believe the solutions proposed will adversely affect reliability and affordability, will have worse impacts on the environment than the purported effects of climate change, and cannot measurably affect global warming when implemented. The opinions expressed in this post do not reflect the position of any of my previous employers or any other company I have been associated with, these comments are mine alone.
When I started researching this comment request, I was confident that the legislation actually listed nuclear as a renewable energy system. However, when I researched it, I found out I was wrong. Subsequently I discussed this with colleagues who are more attuned to New York policy and legislative considerations than I am. As is usual with any aspect of the CLCPA whenever you start to dig into the details there are complicating nuances.
Climate Change Regulations
There are three implementing regulations for the CLCPA legislation that became effective on January 1, 2020. Article 75 – Climate Change was added to the New York Environmental Conservation Law.
For the purposes of this article the relevant regulation is § 66-p. “Establishment of a renewable energy program”. The pertinent amended language reads:
§ 66-p. Establishment of a renewable energy program.
1. As used in this section:
(a) “jurisdictional load serving entity” means any entity subject to the jurisdiction of the commission that secures energy to serve the electrical energy requirements of end-use customers in New York state;
(b) “renewable energy systems” means systems that generate electricity or thermal energy through use of the following technologies: solar thermal, photovoltaics, on land and offshore wind, hydroelectric, geothermal electric, geothermal ground source heat, tidal energy, wave energy, ocean thermal, and fuel cells which do not utilize a fossil fuel resource in the process of generating electricity.
2. No later than June thirtieth, two thousand twenty-one, the commission shall establish a program to require that:
(a) a minimum of seventy percent of the state wide electric generation secured by jurisdictional load serving entities to meet the electrical energy requirements of all end-use customers in New York state in two thousand thirty shall be generated by renewable energy systems; and
(b) that by the year two thousand forty (collectively, the “targets”) the statewide electrical demand system will be zero emissions. In establishing such program, the commission shall consider and where applicable formulate the program to address impacts of the program on safe and adequate electric service in the state under reasonably foreseeable conditions. The commission may, in designing the program, modify the obligations of jurisdictional load serving entities and/or the targets upon consideration of the factors described in this subdivision.
The renewable energy systems definition clearly excludes nuclear. My colleagues all agreed that was a deliberate choice. It also excludes renewable natural gas that is to say methane from landfills and other organic sources. That also was a deliberate design choice by the “anti-natural gas in any form” zealots who drafted the regulation.
The first electric system target in the public service law mandates 70% renewable energy by 2030. Clearly the intent was that 70% of the electric energy has to come from the defined renewable energy systems. Note that the 2040 100% Carbon-free Electricity target is for a different set of energy sources. Also note that there is a lifeline such that the Public Service Commission can modify the obligations to meet the target if there are issues with “safe and adequate electric service”.
Discussion
In my conversation with colleagues who are more conversant about environmental policy in New York, I explained that my work suggests that meeting the 2030 target is impossible with 70% solar thermal, photovoltaics, on land and offshore wind, hydroelectric, geothermal electric, geothermal ground source heat, tidal energy, wave energy, ocean thermal, and fuel cells which do not utilize a fossil fuel resource in the process of generating electricity resources. A forthcoming post will delve into the numbers but for the moment trust that assessment.
The first policy question that comes up is the rationale behind the overly ambitious 2030 target. Ultimately the decision on that target was made by a few key individuals with former Governor Cuomo at the top. The first possibility is that the authors didn’t understand the magnitude of the effort needed and inadvertently chose an impossible target for the decision makers. Given the rhetoric that meeting the “climate change challenge is only a matter of political will” it is possible that they actually believe it. The second possibility is that political optics were the primary rationale despite recognition that the targets were overly ambitious. Given that we are talking about targets that are nine years away, cynics might wonder if this was the case with the presumption that the decision makers would be out of office by then or that the voters would have forgotten who passed the legislation.
The second policy question is what happens when it becomes obvious that the targets cannot be met. This question arises on several time frames for the 2030 target. The first time it comes up is in in the current planning phase. Preliminary modeling of all advisory panel recommendations to the Climate Action Council which includes all sectors of the economy indicates the collective recommendations fail to meet the near- and long-term emission reduction targets. The integration analysis presumably has to increase the emission reduction strategies until the plan meets the targets and that comes out later this year. There is a requirement for an on-going assessment of the status of emissions reductions relative to the targets so the question can come up once the strategies are implemented. Finally, in 2031 we will know for sure whether the 70% target was achieved.
What happens when it does become obvious that the target cannot be met? The 2040 target includes the language that the PSC may “modify the obligations of jurisdictional load serving entities and/or the targets” but it is not clear to me that allows changes for the 2030 target. The politicians who put the state in this bind could argue that these are just goals but the environmental advocates and renewable energy grifters have already started flatly stating that this is the law and that it must be enforced. While there are certainly legal constraints on litigation for this, there seem to be many lawyers willing to push the envelope on legal standing when it comes to suing deep pocket fossil fuel companies for alleged impacts of climate change. As a result, I suspect that failure to meet the targets will result in litigation.
There is another aspect of this that is relevant. The CLCPA did not incorporate any funding mechanism and it is wildly optimistic to think that the targets can be met without additional funding. The last legislative session considered the Climate and Community Investment Act (CCIA) that was intended to fund many aspects of the CLCPA. Once the costs and direct consumer impacts in the CCIA were estimated by some observers (there is yet to be an estimate of costs by the state agencies) there was a groundswell of disapproval, many legislators backed off support, and the legislation did not pass. Every indication is that next legislative session this bill or something similar will be back. The environmental community and environmental justice activists are going to be pushing for passage but will have to overcome the obvious problem of costs.
Conclusion
As I will show in a future post, there is no way that New York can expect to meet the 2030 target for 70% of the electric system energy requirements powered by the defined renewable energy systems of the CLCPA. In my original assessments of feasibility, I had the mistakenly believed that nuclear power could be used to help meet the 2030 target because that was the only way the state could come close but it turns out I was wrong. Nuclear is an acceptable source for the 2040 zero emissions electric system but cannot be used for the 2030 goal. It is a sign of the times that there are activists that want to shut down the upstate nuclear units as well and that will make the 2040 target more difficult. This post clarifies the definitions and addresses possible reasons why the legislation was drafted to make that distinction. I don’t believe there is any rationale for this that puts the authors of the legislation or the politicians that approved the law in a good light: they either knew and didn’t care or didn’t bother to check feasibility.
I am not sure whether there will be consequences for this particular aspect of the abominable CLCPA. As the implementation requirements are defined and impossibility of meeting this target becomes evident, I don’t see how this can continue to be a blind spot for New Yorkers. Hopefully the public will catch on soon that the costs for this virtue-signaling action will be significant and that New York’s contribution to global warming is so small that anything we do cannot have a measurable effect on the alleged warming from GHG emissions. If that does not end the nonsensical implementation, maybe when the legal requirements to mandate use of electric vehicles or ban the use of natural gas for home heating, cooking and hot-water will initiate protests. Unfortunately, many in industry agree with me that it might take a catastrophic blackout with impacts comparable to the Texas blackout in February 2021 to finally motivate voters to demand the repeal of the CLCPA.
Note: When this was written and posted the recording was not available.The Session recordingwas posted on August 30, 2021
On July 18, 2019 New York Governor Andrew Cuomo signed the Climate Leadership and Community Protection Act (CLCPA), which establishes targets for decreasing greenhouse gas emissions, increasing renewable electricity production, and improving energy efficiency. Over the last year Advisory Panels to the Climate Action Council have developed and submitted recommendations for consideration in the Scoping Plan to achieve greenhouse gas (GHG) emissions reductions economy-wide. This is one in a series of articles about this process.
On August 2, 2021, the New York State Energy Research and Development Authority (NYSERDA) held a Reliability Planning Speaker Session to describe New York’s reliability issues to the advisory panels and Climate Action Council. All the speakers but one made the point that today’s renewable energy technology will not be adequate to mantain current reliability standards and that a “yet to be developed technology” will be needed. This post addresses the study that was the basis for the claim by Vote Solar that “integrating renewables into the grid while maintaining reliability is possible, and in fact cost effective” is fatally flawed.
I have written extensively on implementation of the CLCPA because I believe the solutions proposed will adversely affect reliability and affordability, will have worse impacts on the environment than the purported effects of climate change, and cannot measurably affect global warming when implemented. The opinions expressed in this post do not reflect the position of any of my previous employers or any other company I have been associated with, these comments are mine alone.
Background
This post is a follow up to an earlier description of the presentations made at the NYSERDA Reliability Planning Speaker Session on August 2, 2021. The first article was a detailed description of the following presentations:
New York State Reliability Council (NYSRC) – Mayer Sasson, Steve Whitley, & Roger Clayton
New York Independent System Operator (NYISO) – Zach Smith
Utility Consultation Group – Margaret Janzen (National Grid) and Ryan Hawthorne (Central Hudson)
New York State Department of Public Service (DPS) – Tammy Mitchell
Vote Solar – Stephan Roundtree
New York Department of State Utility Intervention Unit – Erin Hogan
The article included background information on the organizations as well as highlights from each presentation. I also prepared a condensed version that was edited down even further and published at Natural Gas Now.
The advisory panels who are charged with providing recommendations to the Climate Action Council and the Council itself have been working on implementation plans for the last year. During the development of the advisory panel recommendations, it was obvious that reliability was only receiving token consideration and that many of the panel and council members did not understand the issues and requirements for a reliable energy system. As a result of many comments, this briefing on the topic of electric system reliability was set up.
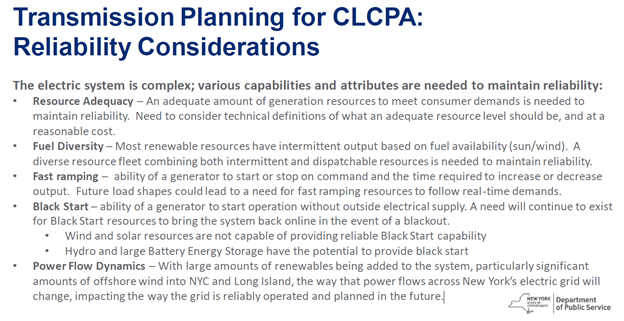
In my previous articles I concluded that there was a common warning admonition in most of the presentations: today’s renewable energy technology is insufficient to develop a reliable electric system with net-zero emissions. The NYSRC notes that “substantial clean energy and dispatchable resources, some with yet to be developed technology, over and above the capacity of all existing fossil resources that will be replaced” needs to be developed. The NYISO explicitly points out that a “large quantity of installed dispatchable energy resources is needed in a small number of hours” that “must be able to come on line quickly, and be flexible enough to meet rapid, steep ramping needs” but only implicitly points out that these are magical resources that do not exist yet for utility-scale needs. The utility consultation group explains that “technology development and diversity of clean resources are essential for long term success” but provide no details of the enormity of that task. Even the DPS makes the point that “evaluating and implementing advanced technologies to enhance the capability of the existing and future transmission and distribution system” is necessary for future reliability. The Utility Intervention Unit does not provide a comparable warning but does stress the importance of planning and the need to address new technologies. Obviously relying on as yet unproven technology to transition the electric system on the schedule of the CLCPA is a serious threat to reliability.
Late last year the report, “Why Local Solar for All Costs Less,” described the results of a new distributed energy resources (DER) planning model. According to a trade press story: the “planning model that includes what most integrated resource plans and solar cost-benefit analyses still leave out — a detailed and long-term view of the distribution system”. “Developed by industry consultants Vibrant Clean Energy (VCE), the model provides a Local Solar Roadmap rooted in a super-granular and highly mathematical view of grid planning. Power flows and resources on the distribution system are looked at in slices of 5 minutes and 3 square kilometers. The operational variables built into the model are equally detailed, encompassing multiple applications for energy storage, emerging technologies such as hydrogen, and increasing stress on the system due to climate change.” Given that Vote Solar was one of the sponsoring organizations and the use of common graphics and tables I am sure that this is the basis for the alternative view presented by Vote Solar.
The results are summarized in a slide presentation and there is an overview summary report that provide a general overview of the approach and results. The executive summary in the report explains that:
The electricity system in the United States (US) is considered to be one of the largest machines ever created. With the advent of clean and renewable technologies, a widespread evolution is occurring. The renewable technologies are lower cost than fossil thermal generation on a levelized cost basis, but their variability creates new and unique constraints and opportunities for the electricity system of the next several decades. Superimposed on the changing structure of the electricity system is a damaged climate that will continue to worsen as mankind continues to emit greenhouse gas (GHG) pollution into the atmosphere.
The first problem with the report shows up in the first paragraph of the executive summary: “renewable technologies are lower cost than fossil thermal generation on a levelized cost basis”. Levelized cost is defined as “a measure of the cost of an energy generation system over the course of its lifetime, which is calculated as the per-unit price at which energy must be generated from a specific energy source in order to break even. The levelized cost of an energy generation system (LCOE) reflects capital and operating and maintenance costs, and it serves as a useful measure for comparing the cost of, say, a solar photovoltaic plant and a natural gas-fired plant.” The problem is that comparing costs using this measure only incorporates the costs of the facility itself not the cost to provide reliable power when and where it is needed. Storage, load balancing and grid integration needs to be developed and those costs are necessary to cover for the intermittent and diffuse nature of wind and solar. Not acknowledging those costs is a common trick of renewable energy advocates when claiming lower costs.
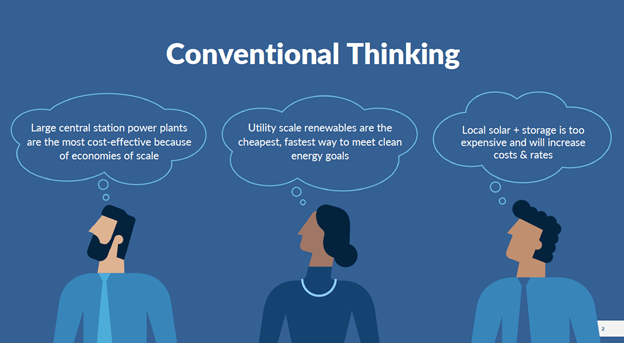
This analysis “proves” that not only are renewable energy sources the best approach but also goes on to claim that it is not necessary to rely on utility-scale wind and solar facilities. Their work supposedly proves that large additions of distributed energy resources (DER) are the best approach for the future. They describe conventional thinking as follows:
The new, smarter approach is described as follows:
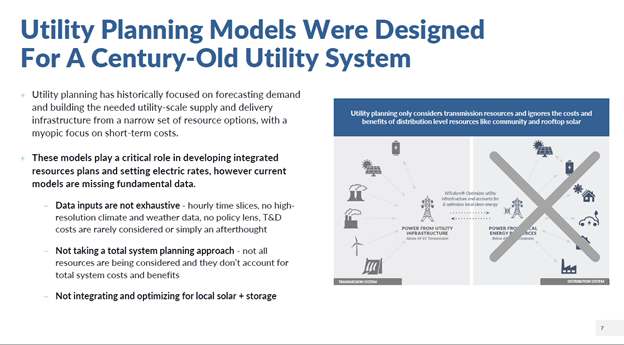
Obviously, renewables are emphasized but their grid of the future has at least ten times more local solar and storage. The basis of the claim is new and better models. The summary slide presentation goes on to argue that the new model is needed to because “utility planning models were designed for a century old utility system”.
The authors claim that “These models play a critical role in developing integrated resources plans and setting electric rates, however current models are missing fundamental data” and that one of the missing pieces is “high resolution climate and weather data”. It is not clear to me whether they don’t know or choose to ignore that current utility planning relies on multiple models. The reliability presentations described models used to explicitly address reliability issues that incorporate historical weather data. In the past it was not necessary to consider short-term (less than one hour) weather variations because the generating facilities did not fluctuate as much as wind and solar. However, the work that NYSRC and NYISO are doing now does consider those fluctuations and uses shorted term data.
The complaint that transmission and distribution costs are “rarely considered or simply an afterthought” may be true elsewhere but New York’s current reliability planning process does consider them. I also consider the claim that “they don’t account for total system costs and benefits” disingenuous for anyone that invokes the levelized cost basis to “prove” that wind and solar are cheaper than traditional generating facilities. The point of all these arguments is that a new and better model is needed.
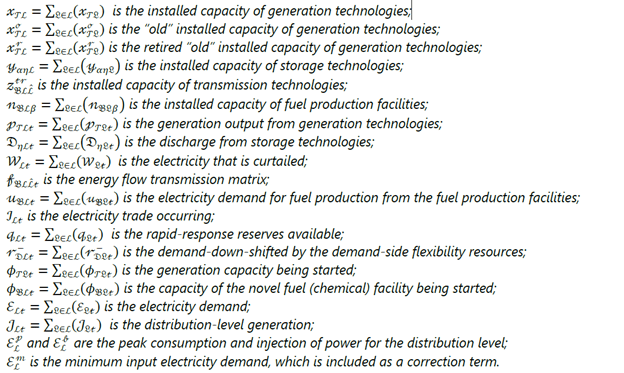
The present study demonstrates, quantifies and evaluates the potential value that distributed energy resources (DERs) could provide to the electricity system, while considering as many facets of their inclusion into a sophisticated grid modeling tool. The Weather-Informed energy Systems: for design, operations and markets planning (WIS:dom®-P) optimization software tool is utilized for the present study. A detailed technical document of the WIS:dom®-P software can be found online. The modeling software is a combined capacity expansion and production cost model that allows for simultaneous 3-kilometer, 5-minute dispatch and power flow along with multi-decade resource selection. It includes detailed representations of fossil generation, variable resources, storage, transmission and DERs. It also contains policies, mandates, and localized data, as well as engineering parameters and constraints of the electricity system and its components. Some novel features include highly granular weather inputs over the whole US, climate change-induced changes to energy infrastructure, land use and siting constraints, dynamic transmission line ratings, electrification and novel fuel production endogenously, and detailed storage dispatch algorithms.
WIS:dom®-P is described as a “state of the art, fully combined capacity expansion and production cost model , developed to process vast volumes of data”. It simultaneously “co-optimizes for: “(1) Capacity expansion requirements (generation, storage, transmission, and demand side resources); and (2) Dispatch requirements (production costs, power flow, reserves, ramping and reliability)”.
The model documentation is a great example of intimidation by equation and jargon. In order to run the model, the user defines 25 parameters ranging from “amortized capital and fixed costs for generation technologies” to “the fuel cost per unit of primary energy for generation technologies”. Each parameter covers a range of options that vary by location. Considering the fact that the model can cover the contiguous United States parameter definition is a daunting task. The model optimizes a further 21 internal variables. These are not variables in the elementary sense representing a single value. Instead, they are multi-dimensional representations of the, for example, “installed capacity of generation technologies” and “electricity demand” covering an area up to the size of the continuous United States. Each of the 46 parameters gets its own symbol as exemplified by the internal variable list below:
The mathematical formulation of the objective function is:
Don’t worry I am not going to dissect the formulation. I just want to make the point that the authors of the program are very likely on a different level of mathematical understanding than the sponsors of the solar advocacy groups who wanted this analysis. Frankly they are on a different level than me, an old retired guy who might have been able to dissect this 50 years ago but who has long since forgotten much of the mathematics behind this optimization methodology. However, I understand enough to question whether this approach adequately addresses the issues that the NYSRC, NYISO and DPS have analyzed in their work.
Ultimate Problem
The question for the reader is why the WIS:dom®-P approach provides a different answer than the other organizations that presented at the reliability speaker session. I believe that the reason is that all the others are addressing resource planning for the worst-case situation when load peaks. In the past, reliability planning focused on the resources needed for peak summer loads when energy use increases above normal load to provide extra load for air conditioning. The New York energy planners all recognize that when the CLCPA requires electrification of heating and transportation that the peak load will shift to the winter. This leads to the bigger problem that the availability of solar and wind resources during the winter peak also has to be considered when it is expected to be much lower than in the summer. I agree with the conclusion that the future worst-case will be a multi-day wind lull in the winter when solar energy availability is low and wind is also low but I am uncomfortable that analyses done to date adequately consider renewable resource availability during those periods.
I was unable to conclusively determine how worst-case meteorological conditions were addressed in the WIS:dom®-P approach. The documentation states “The model was initialized and aligned with historical data from 2018 and then the simulations evolved the electricity system across the contiguous United States (CONUS) from 2020 through 2050 in 5-year investment periods”. Elsewhere it states “Typically, seven calendar years are also simulated after a pathway solution is found. Future simulations will also include 175 years of 50-km, hourly data to determine the robustness of solutions”. It also notes that the supply and demand balance equation set includes: “the weather-driven (wind, solar, and hydro) resource potential, charge/discharge cycles of storage and demand flexibility, and changes in demand requirements throughout the entire simulation period” among other things that suggests that the model incorporates meteorological effects on resources. The formulation of the reserve margin (eq. 1.14.3) suggests that the calculations are on an annual basis:
The advantage of Eq. (1.14.3) is that it incorporates numerous years of weather data in a reduced form that is mathematically tractable. Some disadvantages persist. First, the minimum years (time step by time step) can jump around across the dataset. Secondly, the weather and demand are decoupled from each other. Finally, to understand the dynamics of conventional generation, storage and DSM, the original weather year time step data are used, which could underestimate their performance. Overall, however, it does provide a robust evaluation of the VRE contribution to planning reserve margins over a wide range of possible conditions.
This leads me to believe that the fatal flaw in the WIS:dom®-P approach is that the optimization occurs on an annual basis. In order to ensure that adequate electricity is available when needed the most during the winter wind lull, the optimization balancing has to address the specific requirements of that period. Unless the renewable resource availability constraints are addressed for the energy storage estimates during the worst-case period, the true magnitude of the resources needed to keep lights on during those conditions remains unknown. Everyone else recognized this constraint and consequently raised a common concern about current renewable technology.
Conclusion
In the previous posts I wondered if the Climate Action Council will address the issues raised by the professionals or cater to the naïve dreams of the politically chosen members of the Power Generation Advisory Panel. This analysis shows that the basis for their dreams of a “smarter” planning solution are dangerous because the supporting analysis does not address the worst case. If electric planning does not address those worst-case conditions, then the inevitable result will be a Texas style blackout that will have enormous costs and result in people freezing to death. The severe winter weather in Texas caused at least 151 deaths, property damage of $18 billion, economic damages of $86 billion to $129 billion, and $50 billion for electricity over normal prices during the storm. This is comparable to the costs of superstorm Sandy. However, the costs for one are preventable but the costs for a storm like Sandy are not.
Note: When this was written and posted the recording was not available.The Session recording was posted on August 30, 2021
On July 18, 2019 New York Governor Andrew Cuomo signed the Climate Leadership and Community Protection Act (CLCPA), which establishes targets for decreasing greenhouse gas emissions, increasing renewable electricity production, and improving energy efficiency. Over the last year Advisory Panels to the Climate Action Council have developed and submitted recommendations for consideration in the Scoping Plan to achieve greenhouse gas (GHG) emissions reductions economy-wide. On August 2, 2021, the New York State Energy Research and Development Authority (NYSERDA) held a Reliability Planning Speaker Session to describe New York’s reliability issues to the advisory panels and Climate Action Council. If reliability is a key condition for CLCPA implementation then the briefing summarized here should have been held a year earlier.
I have written extensively on implementation of the CLCPA because I believe the solutions proposed will adversely affect reliability and affordability, will have worse impacts on the environment than the purported effects of climate change, and cannot measurably affect global warming when implemented. I briefly summarized the schedule and implementation: CLCPA Summary Implementation Requirements. My posts describing and commenting on the strategies are available here. I have described the law in general, evaluated its feasibility, estimated costs, described supporting regulations, summarized some of the meetings and complained that its advocates constantly confuse weather and climate in other articles. The opinions expressed in this post do not reflect the position of any of my previous employers or any other company I have been associated with, these comments are mine alone.
Background
There is a long history of blackouts in New York State in general and New York City in particular that is a primary driver of reliability concerns in the state. After a blackout in July 2019 AMNY published a brief history of blackouts in New York City. In 1959 and 1961 surges in electrical use caused blackouts and “The outage spurred changes to better protect the city’s power grid from future blackouts”. The 1965 blackout was the first regional blackout and was caused by a transmission problem in Ontario causing a wave of disruptions in the transmission system. Over 30 million people and 80,000 square miles in Ontario, New York, Connecticut, Massachusetts, New Hampshire, New Jersey, Pennsylvania, Rhode Island, and Vermont were left without power for up to 13 hours. There was another blackout in 1977 that was limited to New York City directly related to the fact that most of the City is on islands and is a load pocket. It was caused by storms cutting off transmission into the City and in-City generation was unable to replace the load without disruptions. Without sufficient local power, protective devices turn off overloaded lines and transformers to prevent physical damage to the equipment and this led to the outages. As a result of this blackout, reliability constraints were strengthened to ensure that when storms threaten transmission into the City that sufficient in-City generation is available to prevent a re-occurrence. In 2003 there was another regional blackout caused by a computer software problem. Grid operators identified the cause and then developed procedures to prevent it from happening again. In 2012 tropical storm Sandy caused massive blackouts exacerbated by flood protection weaknesses. Since then, there have been investments to strengthen the infrastructure to prevent a reoccurrence. Reliability planning is a constant concern for the electrical system professionals who operate the system and are responsible for keeping the lights on.
The members of the Climate Action Council and the advisory panels who are charged with providing recommendations to meet the CLCPA targets were chosen because of their political connections not their energy system expertise. During the development of the advisory panel recommendations, it was obvious that reliability was only receiving token consideration and that many of the panel and council members did not understand the issues and requirements for a reliable energy system. As a result, I was one of many commenters who suggested that a briefing on the topic of electric system reliability would be appropriate. Obviously, this presentation should have been held early in the process but later is better than never.
Note:At one point I found the August 2, 2021 speaker session presentation on a NY website but it not available at this time nor is the recording of the presentation available. My downloaded copy of the presentation is available here. I recommend reading the session presentation as it gives a good overview of reliability issues facing New York in the transition to net-zero.
The session included presentations from six organizations with varying levels of reliability background, experience, and responsibilities:
New York State Reliability Council – Mayer Sasson, Steve Whitley, & Roger Clayton
New York Independent System Operator (NYISO) – Zach Smith
Utility Consultation Group – Margaret Janzen (National Grid) and Ryan Hawthorne (Central Hudson)
New York State Department of Public Service – Tammy Mitchell
Vote Solar – Stephan Roundtree
New York Department of State Utility Intervention Unit – Erin Hogan
I will address each organization and their comments below.
Reliability Council
The New York State Reliability Council (NYSRC) is a Federal Energy Regulatory Council (FERC) approved entity responsible for “the promulgation of reliability standards for New York, which are mandatory requirements for the New York Independent System Operator”. The presentation explains that one of the primary concerns of the NYSRC is the Installed Reserve Margin (IRM) which is the “minimum installed capacity margin above the estimated peak load to meet the Northeast Power Coordinating Council (NPCC) requirement that the probability of shedding load is not greater than one day in ten years”. In order to determine that value the NYSRC conducts a “complex probabilistic analysis of generation and transmission resources, and demand response”. Their presentation went on to describe in the following slide all the responsibilities of the operators who keep the system operating reliably.
The presentation explained that as the percentage of renewable resources increases operating the system must change and the planning for those changes must evolve. It summed up this section as follows: “Limited fuel diversity and over dependence on energy limited resources is a risk to reliability”.
The takeaway message of the NYSRC to the Climate Action Council was:
With the intermittency of renewables and the electrification of the economy, substantial clean energy and dispatchable resources, some with yet to be developed technology, over and above the capacity of all existing fossil resources that will be replaced, will be required to maintain reliability in the transition to meeting CLCPA requirements.
New York Independent System Operator
The NYISO Frequently Asked Questions webpage explains how the organization originated. After the Northeast Blackout of 1965, New York’s seven investor-owned utility companies established a predecessor organization, the New York Power Pool (NYPP), to address the reliability problems exposed by the blackout. In the 1990s New York’s electric system was de-regulated and the Federal Energy Regulatory Commission (FERC) recommended the formation of independent entities to manage energy transmission and the NYISO was established to replace the NYPP. Because the change to the wholesale electricity market is the reason for their existence, the NYISO unquestioningly supports market driven responses to any problem.
The NYISO manages the electric system. They have to balance the instantaneous supply of electricity between the generators and customers across the state in the de-regulated electricity market. They manage the supply of power and maintain the frequency across the state and with their connections to other operating systems. In addition, the NYISO has to plan for future changes to the system. At this time the biggest factor for change is the CLCPA.
Unfortunately, in my opinion, the NYISO is not as independent as it should be. In a recent post I explained how the Cuomo Administration has co-opted the NYISO to the point that their recommendations are couched in terms that do not adequately convey the enormity of the technical issues associated with this transition. Moreover, their faith in market solutions de-values the risks of developing those solutions in the face of the fact this has never been done before.
In this light it is not surprising that the NYISO presentation emphasized their recent Power Trends 2021: New York’s Clean Energy Grid of the Future report that describes current and emerging trends transforming the grid and electricity markets. The report describes how hourly demand patterns fluctuate diurnally and seasonally today. It goes on to explain that the CLCPA de-carbonization efforts will change the magnitude and demand plans in the future, most notably the peak load will occur in the winter instead of the summer. One NYISO analysis projected future winter energy production by resource type.
The important reliability finding of the NYISO work is that the worst-case future resource concern will be a winter-time wind lull. During those periods solar resources are low because days are short and the sun is at a low angle, and wind resources can be less than 25% of the wind capacity for seven days at a time. Consequently, there is a need for a large quantity of installed dispatchable energy resources needed for a small number of hours. They must be able to come on line quickly and be flexible enough to meet rapid and steep ramping needs. The report does not come out and emphasize the important point that there is no current utility-scale resource that meets those criteria.
Utility Consultation Group
This is “A consortium of New York’s gas and electric utilities, focused on providing expertise and perspective to the Climate Action Council and its advisory panels”. Given that most of these utilities are dependent upon rate case decisions made by representative hand picked by the Cuomo Administration there is an obvious reluctance to take a strong contrary position. Given that Cuomo has threatened to revoke a utility operating license over a disagreement in gas supply, I have no doubt that there is real concern that a difference of a fraction of percentage point in any rate case increases could easily make a difference in the stock price colors any statements by this organization.
The consortium fully supports the CLCPA goals even while noting that “customers will continue to value reliability, resiliency, and safety of the energy system during and after decarbonization”. There is the hint that technology development is necessary which may make this a bit difficult and a plea that cost effective solution are necessary. Finally, there is the obligatory shout out that environmental and economic justice need to be considered.
The presentation claims that the “Transition to a clean energy future is feasible, but must be orderly, responsible and cost effective”. Heaven forbid that they suggest the transition is anything but feasible but where in the world is there proof that it is possible much less responsible and cost effective? Given their situation they cannot say this is unlikely to work but it is disappointing that they did not respond with more concern about the potential difficulties.
New York State Department of Public Service (DPS)
DPS has oversight of utility reliability planning. This covers traditional transmission & distribution investment planning and the utilities’ obligation to “reliably serve forecasted customer loads”. There is a nuance to this that is not universally understood. This process is used to ensure adequate transmission and distribution capability to serve customers but the production of the electricity itself is not included. Instead, the wholesale market overseen by the NYISO provides the power. Note that the power producers have no similar obligation to generate electricity. The market is supposed to provide that incentive. I believe there is a common misconception that somehow if things don’t work out that the generators are covered by some sort of obligation to serve but that is not true in the same sense as the T&D utilities.
The presentation explained that DPS constantly evaluates on a real time and forward-looking basis electric system reliability based on a multitude of factors and impacts including customer demands, planned and unplanned outages, weather, regulatory requirements, interconnection requests, and state policy. It was noted that staff works with utilities on these matters but that the PSC has regulatory authority and responsibility to ensure reliability is maintained. The presentation does not explicit make the distinction between T&D reliability planning and planning for generation. Instead, it was explained that DPS staff participates actively in the NYISO planning process, NYSRC committees, and the NPCC board who do have the generation responsibilities.
In response to the CLCPA and Accelerated Renewable Growth Act, the Public Service Commission (PSC) issued orders directing the Utilities to undertake a study and to propose a planning and investment framework for local transmission and distribution investments driven by CLCPA. The Utilities filed the study and their proposals for CLCPA investment criteria on November 2, 2020. At the same time, the PSC and NYSERDA undertook two other studies. One identified “possible grid interconnection points and offshore transmission configurations and assessed onshore bulk transmission needs to reliably integrate 9,000 MW of offshore wind generation”. The second study identified “bulk transmission upgrades potentially necessary to support the State’s path to a 100% decarbonization of the electricity sector by 2040”. The Power Grid Study filed on January 19, 2021 combines all three studies.
The presentation implicitly suggests that this work addresses all the problems. It is important to note that their summary of reliability considerations makes many of the same points addressed in the NYSRC and NYISO as shown in the following slide.
Vote Solar
The purpose of this reliability presentation was to present the concerns of the organizations and professionals who are responsible for maintaining electric reliability. In a blatant example of the political machinations that underly the CLCPA and implementation of the law, Stephan Roundtree, Jr., Northeast Director of Vote Solar presented his take on reliability. Mr. Roundtree holds a B.A. in History from Boston College, a J.D. from Northeastern School of Law, and a Master’s in Environmental Policy from Vermont Law School. My point is that in addition to the fact that he is a crony capitalist representing an organization dependent upon the largesse of subsidies from laws like this, he has no apparent relevant utility-scale power system experience.
Unfortunately, not only does he have no experience he is a member of the Power Generation Advisory Panel. As such his presentation mirrors the reliability mis-understandings of many of the members of that panel. Those mis-understandings are precisely the reason that many asked for this presentation. In my opinion the reliability presentation is a year late in its attempt to provide the background information necessary for the panel to adequately do their job. A reliability presentation should have been given to the Council and the Power Generation panel at the start of the process. Admittedly it is not clear that the political appointees would have tried to understand the reliability difficulties described by those responsible organizations and people responsible for keeping the lights on. As far as I can tell their politically valuable vested interests preclude listening to inconvenient facts much less trying to reconcile them with their pre-conceived notions.
Roundtree’s first slide lays down the gauntlet: “Not a question of whether we can or should shift the grid to be 100% renewable and maintain reliability; it’s the law”. As someone with no reliability responsibilities that is easy for him to say. Sadly, because the virtue-signaling politicians that wrote the law did not include a feasibility requirement before implementation of the “best in the nation” emission reduction targets it is the law. However, if the scoping plan honestly describes the technical difficulties and costs, I cannot see how they can describe implementation of the law as feasible or affordable. The big question is then what?
Roundtree describes three key takeaways:
Reliability is paramount, particularly for vulnerable communities in climate crisis;
Integrating renewables into the grid while maintaining reliability is possible, and in fact cost effective;
Aggressive adoption of a renewables-based grid is arguably the only lawful path to decarb and equity mandates
He accepts that reliability is “paramount” as the first takeaway. He notes that “Lack of electricity service during extreme weather events impacts disadvantaged community members first and worst” and that “Interruption of electricity, combined with lack of wealth & resources, can lead to deepening poverty, housing insecurity, illness, and death”. I agree with what he says. However, I am sure he does not understand that the greatest threat to electric system reliability is ill-considered implementation of renewable resources in the manner he proposes.
In his introduction the second takeaway states that “Integrating renewables into the grid while maintaining reliability is possible, and in fact cost effective”. In the presentation the second takeaway morphed into “Repowering or perpetuating fossil generation is not necessary for reliability”. That was a majority position of the Power Generation panel but there was a minority opinion arguing that it is too soon to say whether that is possible. As proof of the feasibility of a renewable power grid he argues that “Centralized fossil-based grids are proving to be unreliable in our changing climate and cannot withstand increasingly frequent extreme weather events” and cites the Texas energy debacle last February. I don’t believe the 2021 Texas energy debacle was caused by renewable resources but it does foreshadow the difficulty replacing them when the wind isn’t blowing at night. The lesson to be learned is that Texas energy policy prioritized and subsidized unreliable energy sources (wind and solar) at the expense of reliable ones (natural gas, coal and nuclear) for decades but did not incorporate market mechanisms to ensure that the system could operate under market conditions that had occurred in the past.
He goes on to say that “modernizing the grid by adding demand flexibility, efficiency, and distributed energy resources including rooftop solar and storage but also EVs and microgrids is the solution we need to meet reliability needs of tomorrow” and that “renewables pair cost effectively with local grid modernizing infrastructure like storage and microgrid tech don’t have to pay the huge external cost of fossil”. These claims are articles of faith amongst environmental advocates perpetuated by the grifters selling renewable solutions.
The proof offered is a Rocky Mountain Institute analysis. I reviewed their work and found that they selectively choose how they want to treat resources. There are hopeful assumptions for distributed resources and battery energy storage that have no track record in utility-scale applications (hundreds of MW of capacity). There is no consideration of life-cycle resources needed for all the batteries, solar panels and wind turbines. Finally, while the treatment of the technological components necessary to provide the resources are overly optimistic in my opinion, their treatment of costs is much worse. Both current costs and expected cost expectations in the future are more aspirational than rational. Roundtree also cites an advocate analysis that is contradicted by the NYISO analyses. Frankly I believe that Roundtree’s experience and background are ill-suited for him to realize that his cited proof is anything but evidence that his approach can work to keep the lights in New York City on during the worst conditions.
In the introduction his final takeaway was another veiled threat that “aggressive adoption of a renewables-based grid is arguably the only lawful path”. This also morphed into “Local generation & storage promotes equity” in the presentation. Again, his claims are articles of faith. “Fossil pollution causes vast public health challenges which largely aren’t included in reliability vs transition discussion” is always highlighted as a religious tract but the fact that air pollution reductions from fossil pollution have led to large improvements in air quality while the purported health impacts haven’t also improve sis never addressed. The true believers also claim that “Building renewables, batteries, and microgrids in high load disadvantaged communities results in improved public health and better preparedness / functionality during grid stresses and shocks”. The first claim that green energy leads to better public health ignores the environmental and health impacts of the mining of rare earth minerals used in batteries and wind turbines. The proposed solution will not eliminate environmental and health impacts it will just move them and, arguably, make them worse elsewhere. The claim that renewables and batteries will improve functionality during grid stresses is unproven on the utility-scale. The final rationale for this takeaway states that: “Prioritizing state investment in disadvantaged community local grid infrastructure is a pathway to meet CLCPA investment equity mandate” is probably true but should not be a prime reliability concern.
New York Department of State Utility Intervention Unit
The Division of Consumer Protection’s Utility Intervention Unit (UIU) is supposed to act on behalf of the ratepayer. They represent “the interests of New York consumers before federal, state and local administrative and regulatory agencies engaged in the regulation of energy, water and telecommunication services”. According to their about webpage:
The UIU participates in the deliberations of the Public Service Commission (PSC), the New York Independent System Operator (NYISO) and the Federal Energy Regulatory Commission (FERC), as well as utility and energy-related interagency working groups, task forces and committees. The UIU analyzes filings, submits testimony and briefs, engages in settlement discussions and participates in evidentiary hearings in PSC and FERC regulatory proceedings and participates in NYISO governance.
Their presentation starts off with an interesting quote by Peter Fox Penner, Institute for Sustainable Energy: “In a nutshell our challenge is to steer clear of the technical and institutional pathway that together yield poor service, expensive power, or a failure to decarbonize quickly.” I agree that is the key challenge but question whether all of these goals are possible. Of course, that it is possible to have affordable, reliable and emissions-free electricity is the fundamental basis of the CLCPA so no state agency can question the orthodoxy of it. Nonetheless including this quote suggests that the agency representing consumer interests is aware of the problem.
The presentation goes on to show three graphic representations: the electric system of the past, the present, and what is supposed to happen in the future. Then there is a slide that makes the important point that the one constant in all three cases is that load and generation must balance. Then considerations of changes in load over time are discussed. In 2021 the question is “how are the decisions now going to impact prices in the future and adoption of electrification?”. In 2025 the status must be evaluated to see if programs have reached their targets and where they stand. In 2030 we have to ask if we reached the renewable goal. In 2035 the question is “Are there any new technologies or improvements to existing technologies?” In 2040, the question is whether the electric system has weaned itself off fossil fuels. There are strengths, weaknesses, opportunities and threats every step of the way. In their conclusion the importance of planning was stressed. I suspect that the UIU is as uncomfortable as I am that the CLCPA does not include a feasibility mandate.
Conclusion
The warning in most of the presentations was similar: it will not be enough to depend on today’s technology to develop a reliable electric system with net-zero emissions. The NYSRC notes that “substantial clean energy and dispatchable resources, some with yet to be developed technology, over and above the capacity of all existing fossil resources that will be replaced” needs to be developed. The NYISO explicitly points out that a “large quantity of installed dispatchable energy resources is needed in a small number of hours” that “must be able to come on line quickly, and be flexible enough to meet rapid, steep ramping needs” but only implicitly points out that these are magical resources that do not exist yet for utility-scale needs. The utility consultation group explains that “technology development and diversity of clean resources are essential for long term success” but provide no details of the enormity of that task. Even the DPS makes the point that “evaluating and implementing advanced technologies to enhance the capability of the existing and future transmission and distribution system” is necessary for future reliability. The Utility Intervention Unit does not provide a comparable warning but does stress the importance of planning and the need to address new technologies. None of these organizations was in a position to state the obvious that relying on as yet unproven technology to transition the electric system on the schedule of the CLCPA is a serious threat to reliability.
As further proof that the CLCPA is at its root simply political showmanship and virtue signaling, the technical session on reliability allowed an organization with a vested interest in today’s inadequate renewable technology to be included. Giving Vote Solar a chance to present the message that “integrating renewables into the grid while maintaining reliability is possible, and in fact cost effective” proves that the whole thing is politically motivated because the presenter had neither the background or experience to understand the dangers and the requirements to maintain reliability. Moreover, the speaker has no relevant responsibility but the organizations and professionals who are responsible for keeping the lights on all made the point that as the need for sufficient levels of new clean energy resources increases during the grid transformation “some of these resources rely on technologies that do not currently exist for utility scale application.”
Finally, note that problems with a similar transition are already being noted elsewhere. In August 2020, California grid operators had to impose rolling electric blackouts to maintain grid reliability standards. The basic problem was that power demand peaks as people turn on their air conditioning in the late afternoon just as the solar power supplies cut off as the sun goes down. So little power was available the California grid operator had to reduce load to prevent an uncontrolled, much wider scale blackout in the event of a problem at an operating power plant. The scale of that problem pales compared to the scale of the situation when the CLCPA requirements to electrify heating and transportation increase winter load and the elimination of fossil generation increases the dependency upon wind and solar electricity generation. In the winter at New York’s latitude the days are short and the solar panels could be covered by snow. When there is a prolonged cold snap accompanied by light winds both renewable resources will be unavailable and the only question is for how long. With respect to reliability, planning for this worst-case availability scenario has to develop a system that can prevent a future New York blackout that could result in people freezing to death in the dark unable to flee.
The ultimate question is whether the Climate Action Council will address the issues raised by the professionals or cater to the naïve dreams of the politically chosen members of the Power Generation Advisory Panel. Absent changes to the law itself I fear New York consumers will be lab rats for a politically motivated virtue signaling empty gesture that is going to cost enormous sums of money, and, in the event of a major blackout, cause much more harm than good.
Post Script: This text was drafted before Governor Cuomo resigned over sexual harassment allegations. In my opinion his actions towards his accusers were the worst kind of bullying. They are also symptomatic of his Administration’s micro-managing treatment of any dissent from any individual or organization in the state. I am sure that there are many technical professionals in the staff of many state agencies involved in the CLCPA implementation that know that you cannot have an affordable, reliable, and emissions-free electric system but have no way to speak out with those reservations lest they jeopardize their careers. They same can be said of organizations trying to provide value for their shareholders. Hopefully, the new administration will at least consider the reliability risks brought up by the NYSRC, NYISO, Utility Consultation Group, DPS and Utility Intervention Unit.
According to their website, the “Clean Energy States Alliance (CESA) is the leading US coalition of state energy organizations working together to advance the rapid expansion of clean energy technologies and bring the benefits of clean energy to all”. On August 5, 2021, they released “Energy Storage Policy Best Practices from New England: Ten Lessons from Six States” that “explores energy storage policy best practices and lessons learned from the New England states.” This post gives an overview of the report.
The report “aims to inform state policymakers and regulators seeking to expand energy storage markets”. I will address the following ten recommendations that “each state should consider as it charts its own course”:
Identify benefits of energy storage that are not priced or monetizable in existing markets; recognize and accommodate the multi-use nature of energy storage resources.
Establish a monetary value for each storage benefit and use those values when calculating cost effectiveness and setting incentive rates. Estimated value is better than no value at all.
Create incentives to support storage operations that further state policy goals. Incentivize storage use, not just storage deployment.
Set ambitious clean energy and/or emissions reduction goals and explicitly include energy storage as an eligible technology. Define how storage is expected to be deployed and operated to help meet the goals.
Incorporate energy storage into existing clean energy and efficiency programs.
Incorporate equity considerations into energy storage program design from the start, not as an afterthought. This should include significant incentive adders for qualifying participants.
Support a wide variety of storage ownership, application, and business models.
Anticipate and proactively address needed regulatory changes.
Replicate and improve on successful programs implemented in other states.
Fund demonstration projects when needed, but do not rely on grants alone to build a market.
After Superstorm Sandy struck New York City the importance of resilient power became evident to the green energy policy makers and the idea that battery storage could help was broached. The report states that their efforts began “with the idea that advanced battery storage—especially when combined with rooftop solar and other energy resources—could provide clean, resilient backup power, allowing critical facilities such as emergency shelters and health clinics to ride through future grid outages.” A frequently used example of the viability of distributed systems is a hospital in Princeton, NJ that remained on-line despite widespread grid outages due to Sandy. Unfortunately, proponents of these distributed energy approach who cite this as proof of the viability of the concept don’t mention that the hospital had a natural gas fired backup system. The presumption that coupling battery storage with renewable resources will work as well is untested in practice.
The report goes on to note that energy storage can be used to provide other energy services: “demand management, frequency regulation, grid infrastructure investment deferral, renewables integration, and load shifting.” The report claims that: “As the list of possible storage applications expanded, state storage policy would need to become more sophisticated, and state utility commissions would need to review many regulations that had been written prior to the widespread availability of advanced battery storage, which now needed to be revised to accommodate this new technology”. The ten recommendations address these points.
The first recommendation is to “Identify benefits of energy storage that are not priced or monetizable in existing markets and recognize and accommodate the multi-use nature of energy storage resources”. The example benefit given is behind-the-meter (BTM) resilient power that is the ability to support critical facilities and infrastructure during an electric grid outage. As proof they note that that is “widely recognized as having value—otherwise, there would not be a thriving market for backup generators.” The claim is that “Battery storage, when properly configured, can provide resilient power, and this is one of the storage applications that customers value most highly.” Therefore, they recommend that the states figure out some way to monetize this benefit. However, in my case while I chose to install a generator because resilient power is important to me, I wanted the system to be able to handle the multi-day outages I have experienced due to a wind storm and an ice storm. In both cases there is no way I could have installed enough rooftop solar and storage to provide power throughout those days-long outages. Resilient power needs are for the worst case, not just most of the times the power goes out. The worst case is a long duration extreme hot or cold weather situation and energy storage is a poor choice for those scenarios.
In this recommendation, the report states that “Advanced energy storage can provide a wide variety of energy services, and storage owners frequently need to “stack” multiple services (each representing a revenue stream or cost savings opportunity) in order to make storage investments economic.” It includes a highlighted section that discusses a “multi-use” resource. While it recognizes that the different services are “not necessarily” available at the same time, it goes on in Table 1 to list the ratepayer individual savings for six beneficial services then sums for the total. Clearly, this is not appropriate.
The second recommendation is to “Establish a monetary value for each storage benefit and use those values when calculating cost effectiveness and setting incentive rates. Estimated value is better than no value at all”. The paper lists values for seven non-energy benefits of distributed storage in Massachusetts.
The first claimed benefit is Avoided Power Outages – “Battery storage helps avoid outages, and all of the costs that come with outages for families, businesses, generation and distribution companies”. I agree that outages have costs for families and businesses and battery storage that can reduce or eliminate them clearly has value. However, the only way I can think that outages would affect generation companies is if there is a power plant outage and energy storage is used during the outage but the existing system has enough spare capacity to handle that concern. I cannot think how energy storage would reduce costs for a distribution company.
The second value is Higher Property Values – “Installing battery storage in buildings increases property values for storage measure participants by: 1. Increasing leasable space; 2. Increasing thermal comfort; 3. increasing marketability of leasable space, and 4. reducing energy costs”. My understanding is that energy storage systems need space so it is unclear how they would increase leasable space. The other three benefits also seem to be stretch the concept of “value”.
Next is Avoided Fines – “Increasing battery storage will result in fewer power outages and fewer
potential fines for utilities”. I have no clue how energy storage can provide this benefit. Utilities get fined when they don’t plan for enough resiliency in their system to prevent extreme weather impacts on their transmission and distribution systems. Energy storage cannot prevent power outages caused by damages to the wires.
The fourth value is Avoided Collections and Terminations – “More battery storage reduces the need for costly new power plants, thereby lowering ratepayer bills, and making it easier for ratepayers to consistently pay their bills on time. This reduces the need for utilities to initiate collections and terminations.” The ability of battery storage to reduce the need for new power plants is an article of faith amongst the advocates of this technology. However, the claims are long on rhetoric and short on quantitative analysis. If an old power plant has to be replaced it would take one heck of a lot of energy storage to provide the output of any natural gas fired turbine. Until I see their numbers then I will continue to believe that the costs of sufficient energy storage coupled with renewable resources would be far more than the costs of a new turbine.
The fifth value is Avoided Safety-Related Emergency Calls – “Increasing battery storage results in fewer power outages, which reduces the risk of emergencies and the need for utilities to make safety-related emergency calls”. In theory if a customer has a need for uninterrupted power a personal battery storage system could reduce emergency calls. However, you are back to the issue of energy storage capacity versus outage time. If I have the need for uninterrupted power, I want it available for long durations. In order to provide that with energy storage I have to purchase so much capacity for such a rare event that it cannot be cost effective relative to a generator.
The sixth value in the document is Job Creation – “More battery storage benefits society at large by creating jobs in manufacturing, research and development, engineering, and installation”. I have my doubts about this claim but don’t want to do the research necessary to refute this.
The last value in this recommendation is Less Land Used for Power Plants – “More battery storage reduces the need for peaker plants, which are more land-intensive than storage installations—benefiting society by allowing more land to be used for other purposes.” This is only true at the facility itself. However, the grand plan is to combine energy storage with power generated from wind and solar power. Ignoring the vast land use requirements for enough coupled energy storage and diffuse renewable generation is an egregious oversight as shown in the following picture from the report.
The third recommendation is to “Create incentives to support storage operations that further state policy goals. Incentivize storage use, not just storage deployment.” The report states that because
“clean energy incentives generally support broader policy goals such as energy sector decarbonization, electrification, sustainability, modernization, efficiency, resilience, and reliability” that the “energy storage incentive program should not be about ‘storage for storage’s sake,’ but should be designed to support specific policy goals”. The report notes that battery storage can “provide several different services depending on how it is used” so it suggests that “a state energy storage program must actively link the use of battery systems to applications that support specific policy objectives. However, it does not recognize that battery systems that support one policy objective cannot necessarily support all other policy objectives. For example, batteries used for energy storage when intermittent renewables are not available need to be kept charged at their maximum capacity but batteries for frequency regulation and to smooth intermittent fluctuations in supply are kept at an intermediate capacity so that they supply power and draw power as needed. Consequently, I believe the report underestimates the amount of energy storage needed.
Furthermore, there is another example of the disconnect between energy storage by itself and energy storage coupled with renewable energy to solve intermittency. Figure 4A, Misaligned Financial Signals claims that a California energy storage program to reduce emissions was set up incorrectly because “battery owners frequently discharged their batteries during low emissions periods, rather than charging when emissions were low and discharging when they were high”. Honestly, I don’t think the author understands emissions control programs or diurnal peak loads. Time of day emissions matters for conventional air pollution but does not matter for GHG emissions because GHG contribute only to a global long-term alleged problem. Diurnally, California renewable energy primarily comes from solar which peaks during the middle of the day. Figure 4A shows the batteries being charged during the day and then discharging later in the day causing the emissions to go to zero. Diurnal peak loads are usually in the late afternoon so even though there are emissions in the middle of the day the program eliminated emissions during the peak period – it worked precisely as it was supposed to if the goal of the program is to reduce nitrogen oxides for ozone attainment. The “solution” shown in Figure 4B is simply switching the charging source to wind because if it is charging in the night, it certainly is not coming from solar.
The fourth recommendation is “Set ambitious clean energy and/or emissions reduction goals and explicitly include energy storage as an eligible technology. Define how storage is expected to be deployed and operated to help meet the goals.” Regulators take ambitious goals as an article of faith believing that somehow the goals can be met because previous air pollution control programs have always met their goals. The concept that feasibility should be considered is not an element of many regulators and no politician’s thought process.
The next recommendation is “Incorporate energy storage into existing clean energy and efficiency programs.” I think this is pretty obvious so no comment.
The sixth recommendation is “Incorporate equity considerations into energy storage program design from the start, not as an afterthought. This should include significant incentive adders for qualifying participants.” The rationale for this is:
Low-income and underserved communities spend proportionally more of their income on energy costs than other segments of the population. They are also more likely to suffer from energy related environmental and health burdens; and they are hit hardest by natural disasters and the accompanying grid outages and have fewer resources with which to recover. In short, they are most in need of the cost savings, resilience, and health benefits energy storage can offer.
This is another example of limited thinking. While I do not dispute the underserved communities are disproportionally impacted by environmental impacts and extreme weather events the presumption that cost savings will accrue from clean energy are not supported by the experience of any jurisdiction that has tried it. Furthermore, if society not only subsidizes clean energy but also attempts to provide it to those who cannot afford existing energy then it only increases the costs to everyone else. Most importantly, those who may be just able to afford energy bills now but will not be able to afford them in future net-zero energy systems will be impacted by this recommendation.
The recommendation listed in the introduction as “Anticipate and proactively address needed regulatory changes” apparently morphed into the seventh recommendation in the report “Pay attention to regulatory friction points” during the documentation preparation process. The point of the recommendation is that there may be unintended consequences when new energy storage policies are adopted. The analogy used is regulatory whack-a-mole where the states will have to “spend several years fixing problems one at a time as they pop up” after they implement a new rule. In my opinion this should be addressed as part of the feasibility study that most advocates don’t think is necessary. However, the presumption that all the problems associated with converting an energy system using dispatchable energy sources that has taken decades to evolve to one utterly dependent upon intermittent energy sources in a decade or two can be anticipated is wishful thinking. Anyone in a net-zero jurisdiction will be a guinea pig for this experiment.
The eighth recommendation is “Support a wide variety of storage ownership, application, and business models”. The rationale is that energy storage can “integrate renewables and make regional grids more efficient, reduce transmission congestion, defer distribution grid investments, make variable generators dispatchable”. It is also claimed that it can “flatten demand peaks, balance microgrids, make critical infrastructure resilient, and provide ancillary services”. Not noted is that these applications are mostly theory and, especially in a de-regulated market, developing business models that work for both society and the grifters selling energy storage as the solution to anything and everything will be a challenge.
The ninth recommendation is “Replicate and improve on successful programs implemented in other states”. Obviously, there is no sense reinventing the wheel so this makes sense. However, “success” has to be defined well because it can be in the eye of the beholder.
The last recommendation is to “Fund demonstration projects when needed, but do not rely on grants alone to build a market”. As I read this document, I became more and more convinced that the author had limited electric energy system experience. He claims that “there is little need to demonstrate another utility-scale lithium-ion battery providing peak demand reduction and frequency regulation services when numerous such projects already exist in the region”. The report is illustrated with pictures and descriptions of five energy storage facilities with the largest having an 8 MWh duration and totaling 22.4 MWh. The average daily load in New England is 260,120 MWh so those facilities are inconsequential. I don’t think there is any question that in these micro grid applications that batteries can provide peak demand reduction and frequency regulation services. I question whether the author understands that the issue is a matter of scale and it is not at all clear that peak demand reduction and frequency regulation is feasible when non-dispatchable resource penetration is significant. Ultimately it is obvious that ratepayers cannot provide grants for all the energy storage projects needed to try to support the utility grid.
Conclusion
The report concludes that “With falling battery prices, increasing adoption of state clean energy and decarbonization goals, and forward-looking utilities (and ratepayers), many states have a strong foundation for success”. The report is supposed to offer “some suggestions to policymakers for building on that foundation”.
I am unconvinced that this report provides any value. The report was not proofed well because wording of the ten recommendations in each chapter do not match the description of the ten recommendations in the introductory text. I was prompted to write this article by the following quote from the introduction: “In Vermont, for example, Green Mountain Power’s residential battery program has placed battery systems in more than 3,000 homes; the utility dispatches this aggregated, distributed energy storage resource to reduce peak demand, saving ratepayers millions of dollars.” The report notes that the “Stafford Hill solar farm includes 7,700 solar panels capable of producing 2.5 megawatts (MW) of electricity, enough to power 2,000 homes. Therefore 3,000 homes are powered by 3.75 MW. I would love to see the math that produces millions of dollars of savings from shaving peaks by 3.75 MW. I just don’t think this is credible and indicates a lack of knowledge about electric systems by the author.
I believe there is a fundamental oversight not mentioning that stacking energy storage applications is problematic. A single energy storage system cannot supply all the different resources suggested (e.g., by summing the benefits of each resource in Table 1) in this report. There is another fundamental issue with the report because it considers energy storage by itself. Batteries are supposed to solve non-dispatchable renewable energy issues. Claiming that energy storage improves resilience when the coupled energy input is fragile and intermittent is at best a stretch. Finally note that there was very little in the way of caveats and cautions with respect to this unproven, at utility scale and using renewables, technology. As a result, policy makers will not get a full appreciation of the challenge of this transition.
I recently published an article describing how the New York State Energy Research and Development Authority (NYSERDA) Patterns and Trends – New York State Energy Profiles: 2003-2017 (“Patterns and Trends”) comprehensive summary of energy statistics and data could be used to assess where the state stands now relative to Climate Leadership and Community Protection Act (CLCPA). I looked at data up to 2017 to assess the status of two targets:70 percent of electricity from renewable sources by 2030 and 100 percent carbon-free electricity by 2040. Because the data in the report is three years old, I stated that it was difficult to assess feasibility using historical energy use data. This article addresses feasibility by projecting energy use requirements.
I have written extensively on implementation of the CLCPA because I believe the solutions proposed are not feasible with present technology, will adversely affect affordability and reliability, that wind and solar deployment will have worse impacts on the environment than the purported effects of climate change, and, at the end of the day, meeting the targets cannot measurably affect global warming when implemented. The opinions expressed in this post do not reflect the position of any of my previous employers or any other company I have been associated with, these comments are mine alone.
Background
For anyone interested in New York energy information the Patterns and Trends documents are a great resource. One thing that I particularly like is that when you click on a table there is a link to a spreadsheet with all the data. For space reasons the report does not list all the numbers but the underlying spreadsheet includes everything. Unfortunately, during the Cuomo Administration, the annual updates are lagging further and further behind. In January 2011, the report updated with data through the end of 2009 was published 13 months after the end of the year. The latest report available, Patterns and Trends – New York State Energy Profiles: 2003-2017 (“Patterns and Trends”) publication date was March 202,1 38 months after the end of 2017..
In the previous article I explained that Patterns and Trends data showed that in 2017 30% of the electricity generated in the state came from fossil fuels and that nuclear provided 32%. In 2017, hydro provided 18%, municipal solid waste, biomass and geothermal provided 2%, solar had yet to show any significant generation and wind provided 3%. The CLCPA defines renewable energy sources as wind, solar, biomass, geothermal, hydro and nuclear so recent trends in those sources are important to detemine feasibility of the 2030 goal.
New York Historical Energy Source Calculations
Figure 1 lists the percentage trend of the sources of electric generation in New York State (NYS) from 2001 to 2022. This section describes the methology and assumptions used to develop those data.
In order to determine the feasibility of the 70% renewable by 2030 target these data list four source categories: fossil fuels, imports, nuclear and all the other categories lumped together as CLCPA renewables. I broke out nuclear to show the impact of the retirement of Indian Point nuclear station. The CLCPA renewables categories includes biomass and municipal waste generation that I think may not be acceptable as CLCPA renewable at the end of the day but for now they are included.
The data from 2001 to 2017 is directly from Patterns and Trends. The data from 2018 to 2020 comes from a variety of sources. The total electric load used the baseline annual energy forecast from New York Independent System Operator (NYISO) Gold Book 2021 Table I-1b: Summary of NYCA Baseline Annual Energy Forecasts – GWh. The projected category values are set up to equal these load projections. The fossil category data are based on heat input data from EPA Clean Air Markets Division reported emissions data. I included a 1.05 multiplier adjustment to account for difference between historical EPA and NYISO Btu data. The NYISO Gold Book observed data for the nuclear, wind, and other generation sources was used. Hydro used the maximum value of the last ten years from Patterns and Trends. Utility scale solar was assumed to increase linearly to 5 TBtu by 2020. Imports were calculated as the sum of the maximum observed value over the last ten years from Patterns and Trends plus whatever energy was needed to balance the total electric load and sum of all other categories. In other words, it was assumed that imports made up the differences in total component loads to total energy forecast load.
It is difficult to make supportable projections but I did want to illustrate the effect of retiring the Indian Point nuclear station so I did project energy use in the best case in 2021 and 2022. The total electric load used the baseline annual energy forecast from New York Independent System Operator (NYISO) Gold Book 2021 Table I-1b: Summary of NYCA Baseline Annual Energy Forecasts – GWh. For fossil use I took the 2020 data minus the annual reductions necessary to get to zero in 2040 by straight extrapolation. Hydro used the maximum value of the last ten years from Patterns and Trends. The nuclear electric production was set to the average of the last five years of all nuclear facilities less Indian Point. Eliminating the load from Indian Point units 2 and 3 removes 15,774 GWh of CLCPA renewable energy from the NYS electric system. I assumed that waste, land-fill gas and wood are assumed to stay constant at 26 Tbtu, the rounded maximum value in last ten years. With regards to other renewables note that distributed solar is included in the NYISO total load projections. For utility-scale solar and wind I used Energy Information Administration Table 54. Electric Power Projections by Electricity Market Module Region for two New York State regions to estimate the total renewable capacity (GW) additions. I assumed future utility-scale development will be 50-50 solar and wind with a combined capacity factor of 23% to estimate total energy produced in GWh. I used Patterns and Trends data to develop a conversion factor based on recent data to estimate TBtu. As an aside note that for some reason this conversion factor has been changing the last five years contrary to all other sectors. Finally I believe that the EIA projections for future capacity development are wildly optimistic – 1640 MW are supposed to come on line in 2021.
Current New York Energy Sources
Figure 1 lists the percentage trend of the sources of electric generation in New York State (NYS) from 2001 to 2022. In 2001, nuclear provided 28% of the energy and other CLCPA renewable sources another 16% for a total of 44%. Fossil fuels provided over half the energy and imported energy made up the remaining 5%. In 2020, nuclear provided 30%, down from the high of 32%, other CLCPA renewable sources provided 24% for a total of 54% of CLCPA renewable energy, fossil was down to 32%, and imports up to 15%. I project that in 2022, the retirement of Indian Point will reduce nuclear down to 21% and that other CLCPA renewable sources will increase to 30% for a total of 51% of CLCPA renewable energy. The assumption that fossil fuel use will decrease reduces its share to 29% but increases imports to 20%.
Eight years after the projections in Figure 1, nuclear and the Climate Act renewable energy category are supposed to provide 70% of the energy to produce electricity. Those categories only comprise 51% in 2022 in my projection. Estimating the future growth of those categories is difficult but one key factor should be noted. Despite the supposed urgency of reducing fossil fuel emissions, the Cuomo Administration shut down Indian Point nuclear station which generated 165 TBtu of energy or about 12% of the total energy of the state. In order to replace that energy four times as much wind capacity as currently exists has to be developed. Until such time as the renewable resources to replace the lost nuclear are developed, fossil fueled energy or imported energy has to pick up the necessary load. In this projection it was assumed that imported energy picked up the load but it is likely that fossil will replace much of the load because of transmission constraints to New York City and Long Island.
There is another aspect to imported electricity that I cannot address. The CLCPA requires that out-of-state resource renewable attributes be defined so that there is no leakage, that is to say the emissions just move out of state and are not reduced. Unfortunately, I cannot find any information on the attributes of out of state electricity so I cannot comment on how this will affect meeting the target.
CLCPA 70 percent of electricity from renewable sources by 2030 Feasibility
Now that the status has been established we can look towards 2030. I changed my methodology to use GWhr instead of TBu to compare different sources. I based my projections on the feasibility of meeting the 2030 load requirements for wind and solar on the following assumptions. I assumed that the electricity provided by imports, hydro, geothermal, biomass and municipal waste generation all equal the average of the Patterns and Trends data for 2015 to 2017. Nuclear generation was also set at the 2015 to 2017 average less Indian Point nuclear station energy. I calculated the annual reductions needed to meet the 2040 zero fossil fuel emissions target and used the 2030 value. Using those assumptions that means that wind and solar generation have to meet the difference between the sum of those categories and the total load projected by NYISO or 37,256 GWhr.
There are two CLCPA targets for renewable development. In 2025 the target is 6,000 MW of solar and by 2035 there is a target for 9,000 MW of off-shore wind. The NYISO Gold Book projections for total load assume that all of the 2025 solar goal is behind the meter so their load forecasts incoporate the target. For utility solar by 2030 I assumed three scenarios for solar deployment up to 6,000 MW. For 2030 offshore wind I assumed three scenarios: all 9,000 MW in 2030, only the current 4,300 MW under development and a third scenario midway between those two. For on-shore wind I assumed total capacity would be 1,.5, 2, and 2.5 times the current capacity. This gives a low, medium and high range of potential wind and solar deployment.
Table 1 lists the capacity (MW), capacity factors, and projected energy (GWhr) from all the scenarios and four total scenario projections. Scenario 1 uses the low end estimates for all sources and has a deficit of 11,736 GWhr. Scenario 2 uses the mid-point estimates for all sources and has a 1,735 GWhr surplus. If al the estimates are at the high end in Scenario 3 there is a surplus of 15,205 GWhr. My personal best guess (Scenario 4) is mid point for utility solar and on-shore wind but the low estimate for off-shore wind because the entire infrastructure to develop off-shore wind has to be built first. That scenario has a deficit of 6,500 GWhr.
I believe that a major problem with meeting the target is that permitting and construction will slow the deployment of solar and on-shore wind. I reviewed wind and solar project applications for New York’s Article 10 permitting process to get an idea of the magnitude of development for the bracketing scenarios . Based on the solar applications between 19,000 and 56,000 acres and between 6 and 18 million solar panels will be needed for the solar scenarios. The wind applications suggest that between 15 and 25 projects with 60 turbines at each site and that between 900 and 1,500 3.3 MW turbines will be needed for the on-shore wind scenarios. The off-shore wind project information is too scanty at this point to develop similar information. This many projects with such extensive scopes inevitably fail to meet schedules.
Conclusion
While the results shown suggest that meeting the 2030 target can be met in two out of four scenarios there is a big issue with the approach used. Replacing fossil and Indian Point annual energy output with intermittent wind and solar energy outut is not a one for one energy substitution. While a wind turbine can provide a certain amount of energy during a year, it is not dispatchable. Because the total annual load is based on the sum of varying loads over hours, days and seasons, much more intermittent wind and solar capacity is needed to replace the dispatchable capacity that produced historical energy and maintain a reliable system that provides electricity whenever and wherever it is needed. The real test of feasibility is to determine the amount of solar and wind necessary to meet the worst case situation – a wintertime wind lull when both wind and solar generate minimal levels of power. Therefore do not believe any claims for feasibility that are based only on annual energy output.
I want to re-iterate the point that these data do illustrate one hypocritical aspect of the CLCPA and New York energy policy. The CLCPA includes nuclear generation in the definition of acceptable “renewable” sources of electricity. The CLCPA is supposed to protect New Yorkers from the existential threat of climate change but New York energy policy retired nearly 2,000 MW of acceptable renewable power when Indian Point was retired. If the threat of climate change is so pressing how can that be justified? The replacement of the annual power produced by Indian Point will consume all of the off-shore wind currently under development so at a minimum it makes meeting the CLCPA targets that much more difficult.
I have written extensively on implementation of the CLCPA because I believe the solutions proposed are not feasible with present technology, will adversely affect affordability and reliability, that wind and solar deployment will have worse impacts on the environment than the purported effects of climate change, and, at the end of the day, meeting the targets cannot measurably affect global warming when implemented. The opinions expressed in this post do not reflect the position of any of my previous employers or any other company I have been associated with, these comments are mine alone.
Background
For anyone interested in New York energy information the Patterns and Trends documents are a great resource. One thing that I particularly like is that when you click on a table there is a link to a spreadsheet with all the data. For space reasons the report does not list all the numbers but the underlying spreadsheet includes everything. Unfortunately, during the Cuomo Administration, the annual updates are lagging further and further behind. In January 2011, the report updated with data through the end of 2009 was published 13 months after the end of the year. The latest report available, Patterns and Trends – New York State Energy Profiles: 2003-2017 (“Patterns and Trends”) publication date is March 2021 38 months after the end of the year. I believe that these delays are due to reviews of the data by the Cuomo administration.
New York Historical Energy Sources
Patterns and Trends Section 3: New York State Energy Consumption provides data that can be used to describe the historical trends of electrical energy sources. This section presents data on primary and net energy consumption in New York State by sector and fuel type from 2003 through 2017 in the document but provides data in many cases back to 1990 the base year for the CLCPA. Primary consumption of energy is shown by fuel type in physical units, such as tons, cubic feet, gigawatt-hours (GWh), barrels, and trillion Btu (TBtu). Total primary energy consumption by sector, including residential, commercial, industrial, transportation, and electric generation but we will only consider the electric generation sector in this analysis. This Patterns and Trends section also includes information on other fuels, including wood, municipal waste, solar, and geothermal energy. Electricity generation reported does not include generator station use.
Figure 1 lists the historical trend (%) of the sources of electric generation in New York State (NYS) from 1990 to 2017 using data from Table 3-4b in Patterns and Trends. The data shown combine all the fossil fuel sources into one category, list the data from each of the other categories, and combine the CLCPA renewable sources into a category. The CLCPA defines renewable energy sources as wind, solar, biomass, geothermal, hydro and nuclear. In 1990 NYS obtained 59% of its electricity from fossil fuels, 38% from CLCPA renewables and imported 3% from out of state. Note that nuclear and hydro accounted for 36% of the renewables, municipal waste, biomass and geothermal under the other category provided 1% but there was no wind and solar electricity generation.
Since 1990 there has been an uneven trend of decreasing fossil fuel use down to 30% in 2017. Net imports has increased to 16%. Since 2001 nuclear generation has provided around 30% and in 2017 provided 32%. Hydro has provided between 15 and 18% since 2001. Biomass and geothermal has stayed at 2% since 2008. Solar had yet to show any significant generation and wind provided 3%. The good news is that fossil is only 70% but the bad news is that imported electricity does not all meet the CLCPA renewable definition so we cannot fully assess the status of energy use relative to the CLCPA targets.
Conclusion
The Patterns and Trends document is a valuable resource for NYS energy analyses. Unfortunately, there is a significant reporting lag so the latest available data is three years old. In order to better address feasibility more recent data are necessary. I will follow this article with a feasibility post with that information.
On July 25, 2021 the Syracuse Post Standard reprinted an opinion piece from the Washington Post “We need to stop fiddling while the world burns” that described the World Weather Attribution analysis of the recent record-breaking heat wave in the Pacific Northwest. In order to justify the need for massive transformations of the energy system such as New York’s Climate Leadership and Community Protection Act stories like this that claim that the heat wave would have been “virtually impossible without human-based climate change” receive much publicity. However, upon close examination the claims are hype and exaggeration that do not prove the need to “stop fiddling”. The fact is that the reason for the heat wave is mostly extreme weather caused by natural variability with a little bit of climate change thrown in.
The difference between weather and climate is constantly mistaken by CLCPA advocates and the July 22 Climate Action Council meeting presentation included a slide that prominently highlighted the Pacific NW heatwave. This has become such a frequent mis-representation that I have a page that references my evaluations of climatic effects that turned out to be weather events and other similar analyses by other authors.
In this instance there is no need for me to do an evaluation of how climate change affected this extreme weather event. Dr. Cliff Mass is a meteorology professor at the University of Washington whose has spent his career developing an understanding of the weather and climate of the Pacific NW. In addition, he is currently doing research running high resolution, state-of-the-science regional climate models of the region. I do not believe that there is anyone more qualified to address this event and its relationship to climate change.
In the first post, Dr. Mass described the heat wave as follows:
The maximum temperatures during the heatwave were as high as 30-40 degrees Fahrenheit above normal. Seattle had a high of 108F, 35F above the normal high of 73F. Quilluyte on the Washington Coast zoomed to 109F compared to a normal high of 65 (44F above normal). Throughout the region, all-time temperature records were broken, representing the hottest day on record at many locations.
He believes that the “Pacific Northwest is warming and human emission of greenhouse gases is probably the origin of much of it” but goes on to explain the specific reasons for the record setting temperatures. He showed how a persistent high-pressure ridge developed that brought warm air to the area. The already warm air became “supercharged” because the wind flows caused downslope winds which compress the atmosphere markedly increasing the temperatures. In both cases the exact conditions needed to cause the high impacts had to align at the same time. It was a very rare and extreme weather event. Dr. Mass believes that climate change has increased temperatures in the area 1 to 2 F so that effect is added to the observed temperatures. As a result, he believes that climate change is only responsible for that amount of the observed 30-40 degrees observed above normal.
The World Weather Attribution analysis of the heat wave claimed that “Based on observations and modeling, the occurrence of a heatwave with maximum temperatures as observed in the area was virtually impossible without human-caused climate change”. In the second post, Dr. Mass states:
This claim is not supported in the document or by the rigorous science, and, in fact, the material in the attribution report contradicts this assertion. I will provide substantial evidence that the heatwave attribution report, which has not been submitted for peer-review, is profoundly flawed, with serious technical and interpretative errors.
Dr. Mass points out that their rationale that global warming was the main factor was riddled with contradictions that show no evidence that their conclusion was true. In his technical explanation of the flaws in the report he examined local data trends and climate model results. Dr. Mass evaluated local trends of daily high temperatures and found that their analysis was incorrect. They used a climate model that was not refined enough to capture the factors that affect local weather conditions and improperly used an inaccurate emissions estimate. Finally, he showed that their evaluation was inconsistent with their conclusion. He sums up: “If anything, much of the material in the report is highly suggestive of a random, black swan event that is slightly enhanced by greenhouse gas warming”. Exactly Dr. Mass’ conclusion.
In his final article he explains “why their basic framing and approach is problematic, leading readers (and most of the media) to incorrect conclusions” by way of two examples. He describes a physically meaningful interpretation with an example where the essential event would have happened without any effect from global warming. He notes that this is “a good example of the golden rule of climate attribution: the more unusual and extreme the event, the greater the proportion of the event is due to natural variability rather than global warming”. In contrast the World Weather Attribution analysis focuses only on the headline interpretation. They ignore the physical situation and actual impacts and the fact that natural variability is dominating the situation. Instead, they only look at the event itself. In this case they note that temperatures were up to 40 F higher than normal and say this would not have happened without global warming. That is true but it ignores the fact that global warming was only responsible for 2 F and 38 F would have been a record-setting heat wave. This miscommunication leads people to think that global warming was the primary driver rather than natural variability.
He concludes this article with the following:
Many of the climate attribution studies are resulting in headlines that are deceptive and result in people coming to incorrect conclusions about the relative roles of global warming and natural variability in current extreme weather. Scary headlines and apocalyptic attribution studies needlessly provoke fear. Furthermore, incorrect and hyped information results in poor decision-making.
……………………….
We need to worry about climate change and take steps in both mitigation (reduce greenhouse gas emissions) and adaptation. But hype and exaggeration of its impacts only undermine the potential for effective action.
I don’t agree with all of his projections for the future because I don’t trust climate models based on my model verification work that found it was possible to get the right answer for the wrong reason. As a result, I believe it is better to emphasize adaptation over mitigation because the effects of natural variability on extreme weather have devastating impacts which a more resilient society can handle better. However, we agree that hype and exaggeration of the causes of extreme weather undermine the most effective policies to reduce extreme weather impacts.
The hype and exaggeration matters to New Yorkers because the politicians who passed New York’s Climate Act based their rationale for mitigating greenhouse gas emissions on the misinterpretation of similar extreme weather events driven primarily by natural variability as evidence that climate change is affecting us now. As a result, the law’s emission reduction targets will squander state resources that would be better spent on making society more resilient to extreme weather rather than using today’s inefficient, expensive and untested renewable energy “solutions”.
I wanted to mark the occasion of this, my 300th post, with a bit of retrospective since I started posting on this blog on January 11, 2017.
I am a retired electric utility meteorologist with over 40 years-experience analyzing the effects of meteorology on environmental impacts. Over that time, I have dealt with a wide range of environmental issues and researched many relevant topics to New York’s environmental and energy sectors. As part of that work, I had to document the results and potential impacts of many topics that I felt were important. When I retired, I decided to write about some topics that I felt were not receiving much attention and started blogging.
There is a massive industry associated with environmental causes that produce many opportunities for articles critical of the environmentalist narrative. Coupled with New York State’s Climate Leadership and Community Protection Act (CLCPA) it seems that every day there is something that I want to write about. In addition, the current state of New York politics precludes meaningful criticisms from industry so I can say things that companies cannot. Nonetheless I am always careful to note that the opinions expressed in my blog articles do not reflect the position of any of my previous employers or any other company I have been associated with, the comments are mine alone.
The goal in my blog is to describe environmental issues from a pragmatic viewpoint. Pragmatic environmentalism is all about balancing the risks and benefits of both sides of issues. Unfortunately, public perception is too often driven by scary one-sided stories that have to be rebutted by getting into details. I have tried to show the complicated “other” side of environmental issues that gets overlooked during policy discussions too often. My background as a scientist and my earlier responsibilities to provide technical comments on new or revised regulations means that I tend to get bogged down in technical details that are, too be kind, pretty wonky. I have tried to tone down the technical aspects but have not been entirely successful.
Although my posts cover a wide range of topics that interest me there are two primary topics covered. Most of my articles (109) have addressed the CLCPA implementation process. I truly believe that this “solution” will be far worse than the impacts of the problem they are trying to address and that does not consider the enormous costs. I have also written 36 articles on the Regional Greenhouse Gas Initiative (RGGI). This greenhouse gas control program is frequently described as a success but I have not been able to resist pointing out the flaws in that belief.
The final question I have asked myself is whether my obsession with this blog has been a success and to me success is having people read the blog. According to the WordPress statistics, the views of the blog have been steadily increasing and there have been over 16,500 visitors. There is an option for people to like a post and those have been going up. Comments have been a bit of a disappointment especially because many of the comments are simply approvals of references to previous posts. There are 53 people who follow the blog too.
So where are the people coming from to find the blog. Very early on Judith Curry included this blog on her blogroll and a large percentage of the visitors visited since then. Tom Shepstone started reposting my articles at his Natural Gas Now blog starting 12/28/18 and he has spread my message in nearly 100 reposts. My thanks to both of them for bringing visitors.
I have done some self-promotion as well. I have also done blog posts for Judith’s site and Watts Up With That and there usually is a flurry of visitors after those posts. Francis Menton posted blog articles on my articles about the CLCPA implementation process and both were re-printed on Watts Up With That. The comments on my work in those posts dwarf the responses on the blog itself and I am sure the total views were larger too. Most gratifying is the occasional contact from people whose work I respect offering advice, encouragement, and praise. I have also heard that there are industry people who follow the blog.
The blog statistics note the number of people who visit based on internet searches. Unfortunately, I don’t know what they are searching for. I suspect it is a source of frustration to the state that when searching for specific CLCPA items my posts generally turn up. Most popular article by far is one on the proposed rebuilding of Interstate 81 through Syracuse and I would love to know how nearly 3,000 people found it.
In the future, I plan to develop a simple summary of the issues with the CLCPA that I want to publicize as much as possible. The layman’s version of that document will be backed up by plenty of technical documentation from the blog. I am also trying to provide references to the work of others who agree with my concerns relative to the “solutions” for the existential climate crisis.
In conclusion this has been a rewarding experience for me. I devoutly believe that it is important to keep busy during retirement and this blog keeps me busy. Just when I get discouraged and think about quitting, some insane proposal or article comes up that provides more than enough incentive to keep writing. My thanks to everyone who has read my work.
On July 18, 2019 New York Governor Andrew Cuomo signed the Climate Leadership and Community Protection Act (CLCPA), which establishes targets for decreasing greenhouse gas emissions, increasing renewable electricity production, and improving energy efficiency. Since the law was enacted the process of developing strategies to meet those targets has been underway. My posts describing and commenting on the strategies are all available here. In order to meet the emission reduction targets for the transportation sector, electric vehicles are a necessary component. This post comments on the New York State Energy Research & Development Authority (NYSERDA) recent email giving four reasons you should consider an electric vehicle.
I have written extensively on implementation of the CLCPA closely because I believe the solutions proposed will adversely affect reliability and affordability, will have worse impacts on the environment than the purported effects of climate change, and cannot measurably affect global warming when implemented. I briefly summarized the schedule and implementation CLCPA Summary Implementation Requirements. I have described the law in general, evaluated its feasibility, estimated costs, described supporting regulations, summarized some of the meetings and complained that its advocates constantly confuse weather and climate in other articles. The opinions expressed in this post do not reflect the position of any of my previous employers or any other company I have been associated with, these comments are mine alone.
Background
I recently wrote a post on a similar NYSERDA email about heat pumps and the Energy Efficiency & Housing Advisory Panel scoping plan recommendations to the Climate Action Council. I noted that in the panel presentation the first mitigation strategy is an initiative to modify building codes and standards for new construction, including additions and alterations, to require solar photo-voltaic (PV) panels on “feasible” areas, grid-interactive electrical appliances, energy storage readiness, electric readiness for all appliance and electric vehicle readiness. An all-electric home must use electricity for heating and heat pumps are the proposed solution. My post showed that the NYSERDA email titled “Myth Buster: The Heat Pump Edition” was propaganda.
Propaganda is defined as material disseminated by the advocates of a doctrine or cause. There are many propaganda techniques including “card stacking”. This technique is a feature of the CLCPA:
It involves the deliberate omission of certain facts to fool the target audience. The term card stacking originates from gambling and occurs when players try to stack decks in their favor. A similar ideology is used by companies to make their products appear better than they actually are.
On May 10, 2021 the Transportation Advisory Panel presented their strategies to the Climate Action Council. An outline of their recommendations is also available. As shown in the following slide from the recommendations the first mitigation strategy initiative is to transition to 100% zero-emission light duty vehicle sales.
The recommended mitigation strategy overview noted that a potential risk or barrier to success was “Lack of consumer awareness/interest and consumer concerns about technology & charging/fueling”. The strategy suggests a “Coordinated and cooperative marketing campaign with industry partners” as a possible mitigant.
I think garnering support for this initiative is a major challenge for proponents. Clearly a marketing campaign is necessary to dupe the public into this ill-advised strategy. As shown below, I believe the rationale for purchasing an electric vehicle in their marketing campaign is pretty weak and certainly not enough to make me consider getting one.
Four Reasons to Consider an Electric Vehicle
The following is the text from a NYSERDA email titled “Considering an electric vehicle (EV)? Here are four reasons you should”. It also is available in a weblink.
There’s no denying that over the past several years the demand for electric vehicles (EV) has increased. In New York State, driving electric is a great opportunity for vehicle owners to make a positive environmental impact, lowering their carbon footprint while helping the State reach its ambitious clean energy and climate action goals.
Transportation accounts for 42% of New York State’s greenhouse gas emissions, meaning that every EV that replaces a gas-powered vehicle will help make a difference.
Making the switch to an electric vehicle is a big decision. The more knowledge you have, the more informed your choices will be. If you’re still on the fence about making the switch, here are four additional things to consider:
1: Electric vehicles will save you time and money.
Compared to gasoline-powered cars, EVs are more energy efficient and cost about 50 to 70% less to operate per mile. EV motors don’t need oil changes, you’ll be making fewer visits for regular maintenance and repairs. And since your car will run on electricity, not gas, you won’t need to make trips to the gas station.
2: Electric vehicles are clean, quiet, and fun to drive
There is no loud engine, but electric vehicles deliver fast acceleration and surprising pick up that make them exceptionally fun to drive. EVs also boast a variety of different technological advantages, including the ability to preheat your car without garage emissions, or to turn up the bass on your speakers without engine distortions.
3: There are tax credits and rebates available to help you purchase your EV.
With an electric car charger provided by your vehicle’s manufacturer, you can simply plug into a standard home outlet to charge your car. You can also upgrade your home to a Level 2 charger, which requires an electrician to install but increases the speed of charging up to 10x compared to a standard outlet. And if you need to charge your EV while you’re out and about, rest easy: there are thousands of available charging stations throughout the State that are easy to find through mobile apps and through the NYSERDA website.
4: There are tax credits and rebates that can be put toward purchasing an EV.
Use the Drive Clean Rebate to take up to $2,000 off the price of an electric car at the time of purchase. You can also combine that rebate with the existing federal tax credit for electric cars, which provides up to $7,500 for the purchase of a new electric car.
Discussion
I will address the propaganda in the components of the NYSERDA email below. My comments will rely heavily on Dr. Jay Lehr’s excellent overview of the many reasons that electric vehicles will never replace the internal combustion engine.
NYSERDA claims that electric vehicles will save you time and money because they are “more energy efficient and cost about 50 to 70% less to operate per mile” than gasoline powered vehicles. This ignores the fact that electric vehicles are significantly more expensive than comparable internal combustion automobiles. There also are buried assumptions about the costs of electricity relative to gasoline that can be used to game the answers to provide this rationale. Another claim is that “since your car will run on electricity, not gas, you won’t need to make trips to the gas station”. What happens when you want to take a trip that exceeds the battery range is ignored. A gasoline powered car can re-fuel in a matter of minutes whereas an electric vehicle charger takes hours if you can find a charging station that is not being used. Lehr also points out that the cost of battery replacement and lack of a used car market should also be considered when comparing costs.
Electric vehicle proponents love to claim that they are clean, quiet, and fun to drive. Although electric vehicles to have lower emissions the life-cycle emissions and supply chain implications of the batteries needed need to considered for this claim. NYSERDA claims that “electric vehicles deliver fast acceleration and surprising pick up that make them exceptionally fun to drive”. Reality is that most people use their vehicles as a tool and having fun is a low priority. The email goes on to claim that they “boast a variety of different technological advantages, including the ability to preheat your car without garage emissions, or to turn up the bass on your speakers without engine distortions”. The first claim about garage emissions suggests this was written by someone who has a garage. Based on my neighborhood more than half the cars are not stored in a garage in the winter. The final claim is absurd. Who in the world decides to buy a car based on being able to turn up their bass speakers?
One of reasons that electric vehicle ownership is more expensive is the desirability of a charging system that can provide a full charge in a short time. The third component notes that you can choose between the electric car charger provided by your vehicle’s manufacturer that uses a standard home outlet to or upgrade your home to a Level 2 charger, “which requires an electrician to install but increases the speed of charging up to 10x compared to a standard outlet”. Another notable observation in my neighborhood is the number of vehicles per home. Most have at least two and anyone with adult children living at home has more. Of course, the concern about where to charge at home in my suburb pales in comparison to any city where car owners have to park on the street. NYSERDA goes on to claim that “if you need to charge your EV while you’re out and about, rest easy: there are thousands of available charging stations throughout the State that are easy to find through mobile apps and through the NYSERDA website”. I believe it is fair to say that European electric vehicle implementation is ahead of New York so the “horror trip” of a retired German couple who needed 26 hours to make a 765 Km or 475 mile trip in an electric vehicle makes me leery of this NYSERDA claim.
Finally, NYSERDA notes that you can use the Drive Clean Rebate to take “up to $2,000 off the price of an electric car at the time of purchase” and that you can also combine that rebate with the existing federal tax credit for electric cars, which provides up to $7,500 for the purchase of a new electric car. There are around 9.4 million standard vehicles registered in New York. If every one of those vehicles were to be replaced, this subsidyt would cost $18.9 billion so I have to wonder if this money will be available for everyone.
Conclusion
When I explain the CLCPA implementation strategies most people do not grasp that this abstract concept is going to have big impacts on personal choice and affordability. Moreover, as details on the plans are fleshed out it is becoming increasingly obvious that there are serious environmental consequences that are being ignored in the process.
In my opinion the majority of New Yorkers will object to electric vehicles primarily because of personal choice. In my case I rely on my personal vehicles as a tool to my way of life and I expect that my concerns are similar to many others. I do not choose my vehicles based on whether it is fun to drive. Several times a year I use my car to take a trip beyond the range of current electric vehicles. While I try to avoid driving in bad winter weather there are times it cannot be avoided and a car that might lose power quickly if I get marooned is a danger to me and my family. While I could afford an electric vehicle, I see no reason to pay more for a vehicle that might be an interesting toy but has flaws for my personal use.
The fact is that purchasing a new vehicle, much less a more expensive electric vehicle, is beyond the means of many people. Worse is that there are other costs involved with widespread electric vehicle use. Dr. Lehr notes that “On most suburban streets the electrical infrastructure would be unable to carry more than three houses with a single Tesla. For half the homes on your block to have electric vehicles, the system would be wildly overloaded.” As a result, the suburban electric distribution system will have to be upgraded and everyone will have to pay for those costs. Experience elsewhere shows that, for example, upgrade costs to the electric system for the United Kingdom are enormous and will increase costs for everyone. Therefore, electric vehicles are toys for the rich that will be subsidized by the poor.
Among the environmental consequences not included in the CLCPA implementation process are the impacts of exotic materials needed for the transition. A recent report by the International Energy Agency included a comparison of the minerals needed for electric vehicles as opposed to conventional cars. Assuming that a million cars are sold per year in New York in 2035 when the mandate to sell only electric vehicles are sold in New York that means that an additional 34,505 tons of copper, 8,904 tons of lithium, 43.409 tons of nickel, 15, 583 tons of manganese, 14,470 tons of cobalt, and 70,122 tons of graphite will be needed each year. If all other jurisdictions enact similar mandates the amount of rare earth minerals required will be enormous. The newly released book “Clean Energy Exploitations” by Ron Stein and Todd Royal explains how the development needed to provide these materials will exploit the most vulnerable people while destroying their environment.
I conclude that NYSERDA’s rationale for purchasing an electric vehicle is out of touch with the public. I think this strategy is ill-advised due to its hidden environmental impacts and cost shifting from higher-income drivers to lower-income consumers. I hope that when the public becomes aware of these impacts that there will be sufficient push-back to drop the electric vehicle mandates.
Update 7/27/21: Immediately after publishing this I found another summary of the problems of EV deployment that is worth reading. “Electrifying parts of our transportation system may result in incremental reductions in greenhouse gas emissions,” Robert Bryce argues. “But a look at history, as well as an analysis of the supply-chain issues involved in manufacturing EVs, the resource intensity of batteries, and the increasingly fragile state of our electric grid – which is being destabilized by bad policy at the state and national levels – shows that a headlong drive to convert our transportation systems to run on ‘green’ electricity could cost taxpayers untold billions of dollars, increase greenhouse gas emissions, be bad for societal resilience, make the U.S. more dependent on commodity markets dominated by China, make us less able to respond to extreme weather events or attacks on our infrastructure, and impose regressive taxes on low and middle-income Americans in the form of higher electricity prices.”
On July 18, 2019 New York Governor Andrew Cuomo signed the Climate Leadership and Community Protection Act (CLCPA), which establishes targets for decreasing greenhouse gas emissions, increasing renewable electricity production, and improving energy efficiency. I have commented on the advisory panel implementation recommendations presented to the Climate Action Council this year. This post describes the first Climate Justice Working Group presentation to the Climate Action Council. Their presentation provided an overview of their expectations and specific comments on two of the advisory panel recommendations. There is a recording available of the meeting here.
Section 75-0111 of the CLCPA mandates that the Department of Environmental Conservation establish a Climate Justice Working Group. I provided background information on the requirements and the membership in an earlier post. The post also includes documentation describing the education and affiliation of the members of the working group.
According to a New York State Department of Environmental Conservation (DEC) bulletin dated May 10, 2021, the Advisory Panels to the Climate Action Council have all submitted recommendations for consideration in the Scoping Plan to achieve greenhouse gas (GHG) emissions reductions economy-wide. My posts describing and commenting on the strategies are all available here.
I think there is a controversy regarding the scope of this working group’s charge. The CLCPA states that each advisory panel is required to coordinate with the climate justice working group while developing their enabling strategies. There also are requirements that the draft and final scoping plan have to be developed in consultation with the climate justice advisory group. I interpret that to be a consulting role but it is apparent that this working group believes that they have the responsibility to be the final arbiter whether the advisory panel enabling strategy recommendations adequately address climate justice. As noted in my previous post, there is little technical expertise on this panel to support that role. More importantly, their vision excludes any consideration of feasibility or competing interests.
Climate Justice Framework
My words cannot fully capture the tenor and content of the presentation by Elizabeth Yeampierre, the Executive Director of UPROSE. It would be worth your while to listen to her seven-minute lecture to the Climate Action Council starting at 8:00 in the meeting recording. I say lecture because my impression was that she believes that the climate justice working group has a mission that is not open to compromise, that the solutions have to come from the communities because they are most impacted, and those solutions have to not only address climate change but also co-pollutants. Unfortunately, the basis for this climate justice framework is technically flawed and does not recognize that there is no zero-risk way to provide reliable, abundant, and affordable energy.
The rationale for the climate justice framework is that climate change is truly an existential threat. According to Yeampierre, the next Intergovernmental Panel on Climate Change report is going show that there are thresholds for climate breakdown that will doom humanity because humans cannot evolve or develop new ecosystems to handle drastic climate shifts. However, humans have adapted their ecosystem to live across an incredible range of temperatures. At the cold end of the spectrum the humans in the remote village of Oymyakon in eastern Siberia have adapted to an ecosystem where the record low temperature is -96 OF degrees below zero Fahrenheit and the record high is 94.3 OF. The average monthly temperature in January is -51.5 OF and in July is 58.8 OF a range of 110 Fahrenheit degrees. At the hottest extreme, Mecca, Saudi Arabia has had a record high temperature of 121.6 OF and record low of 51.6 OF. The average monthly temperature in January is 75 OF and in July is 96 OF. The 2.4 million residents of Mecca have adapted their ecosystem to live in a city whose annual average temperature is 87.3 OF. I rate this claim as bogus.
Yeampierre goes on to point out that we need to act now because of the recent heat waves in the Pacific Northwest. I believe that the definitive take down of that claim has been prepared by University of Washington meteorologist Dr. Cliff Mass. The weather and climate of that region is his particular specialty and he explains that the “specific ingredients that led to the heatwave include a high-amplitude ridge of high pressure and an approaching low-pressure area that “supercharged” the warming” and showed that “global warming only contributed a small about (1-2F) of the 30-40F heatwave and that proposed global warming amplification mechanisms (e.g., droughts, enhanced ridging/high pressure) cannot explain the severe heat event”. Again, her rationale for drastic action has no basis in fact.
In my opinion, the following justice lens diagram describes the Green New Deal which not only calls for public policy to address climate change but to also achieve other social goals and resource efficiency. The diagram shows the plan to move from today’s “extractive” economy to a future “living” economy. While I could certainly do a post just on this diagram, I will only summarize it below for the context of the Climate Justice Working Group.
On the left side of the diagram is today’s extractive economy where work’s purpose is exploitation. The worldview is consumerism and colonial mindset. Resources are to be extracted – “dig, burn, dump”. Governance is militarism.
The right side of the diagram describes the living economy where work and cooperation produce ecological and social well-being. According to this, resources have to be regenerated, the worldview is caring and sacredness, and governance is by “deep” democracy.
The center of the diagram describes the plan to convert to the living economy. Solutions that are “visionary and oppositional” will stop the bad and build the new. If we “starve and stop” to “divest from their power” we can “feed and grow” to “invest in our power” through a values filter. This filter moves capital by shifting economic control to communities, democratizing wealth and the workplace, advancing ecological restoration, driving racial justice and social equity, making most production and consumption locally based and retaining and restoring cultures and traditions. All this occurs when the rules are changed to “draw down money and power”.
I really don’t think that the majority of the politicians that voted for the CLCPA considered that the law to mitigate greenhouse gases to address climate change was also a mandate to move to a socialist utopia as described in this diagram. I am certain that the majority of the voters would not endorse this plan. The real question is how far is the Cuomo Administration going to go down this path to appease the environmental justice demographic but not alienate the rest of society.
In Yeampierre’s naïve view of the energy sector front line communities must defend lands and rivers from mines, power plants, mega-projects and industrial agriculture by expanding agro-ecology and transformative economies while building community-controlled energy and food systems. This post is only going to address energy systems which she believes should be dominated by renewables like wind and solar. The reality is that in order to convert to wind and solar the extractive impact on lands and rivers will be enormous because the rare earth metals required for those technologies require extensive mining. Because wind and solar are diffuse, vast tracts of land will be blanketed with turbines and panels. When those turbines and panels reach the end of their useful life they will have to be decommissioned and the materials disposed in landfills. My point is that when looked at holistically the probable impact of renewable energy on communities will be larger but, for the urban environmental justice activists the impacts will be moved from their communities elsewhere out of sight and out of mind.
The urban environmental justice activists most hypocritical position regards health impacts. Yeampierre advocates for a zero-risk approach to air pollution. It is not enough to meet (with the exception of ozone in New York) the National Ambient Air Quality Standards (NAAQS) that have protected the health and welfare in the United States for decades. The fact that the concentrations of all the air pollutants have dropped dramatically since the Clean Air Act is irrelevant because there still are elevated levels in disadvantaged communities relative to elsewhere even if those levels are less than the air quality standards. The activists argue that, for example, power plants in urban areas have to be replaced by renewable energy and energy storage based on epidemiological statistics that claim excess health impacts from air pollution amongst other confounding factors. That position is hypocritical because the extraction of the rare earth metals necessary for energy storage and renewable energy is done almost exclusively overseas where the health and environment protections are much weaker and labor protections nearly non-existent. As a result, there are real health and welfare impacts directly attributable to their solution as opposed to the statistical artifacts that support their supposed problem.
There also is hypocrisy associated with their description of the extractive economy. The unfortunate fact is that child labor is involved in the African mining industry. It is sad and telling about their objectives that the Climate Justice Working Group has not called for New York renewable energy and energy storage facilities to require that their mineral suppliers are certified by the Responsible Mineral Initiative or something similar.
Working Group Observations on Enabling Initiatives
The working group summarized their observations and general impressions “mainly on the Transportation Advisory Panel recommendations”. Abigail McHugh-Grifa, the Executive Director of the Rochester People’s Climate Coalition, presented the overview (starting at 14:45 in the meeting recording). She holds a Ph.D. in Music Education, but “decided to give up her career in music to dedicate herself to climate work”. She exemplifies my concern that the members of this working group lack the background and education to provide meaningful comments on technical issues.
She explained that the working group decided to present comments on the enabling initiative recommendations from two panels, transportation and housing & energy efficiency, because they represent opposite ends of the spectrum in terms of how well the panels incorporated environmental justice priorities. In other words, transportation did not address the pre-conceived notions of a “climate just” transportation system but the housing and energy efficiency checked all the boxes for their demands.
I annotated the slide used in her presentation with my italicized comments below:
Recognize that goals/benchmarks/accountability is essential
The recommendations need clear guidance on how benefits/investments will be defined, measured, tracked, and shared over the long term
Scoping plan must ensure data is available to accurately measure the success of implementing the CLCPA
I agree with this comment.
Better scrutinize every action for justice
Some of the recommendations presented false market-based solutions
The EJ community has historically been opposed to market-based solutions because they believe that they don’t prevent localized areas of high pollution. In the case of greenhouse gas emissions that is not a relevant concern so their problem is associated with co-pollutants. The EJ community’s air pollution goal is zero risk, i.e., zero emissions.
Provide greater clarity, reasoning, and purpose
Some goals such as the doubling of municipal-sponsored public transportation appear arbitrary without an analysis on the basis of the target
None of the enabling initiatives included any substantive documentation. As a result, I agree that more detail is needed to justify the enabling initiative recommendations.
Policies with significant implications like a feebate deserve more than a ‘handwave’. It sounds like ‘free money’. How does it actually work in practice?
I agree with this comment.
Provide explanation of how the social cost of carbon was incorporated
As far as I can tell the social cost of carbon has not been incorporated yet. It is another one of those pesky details that should be in the as yet unreleased documentation.
Edit jargon to plain speak, and remove vague, squishy language and strive to provide key details
In my opinion, the presentations by this working group exemplified vague jargon and a lack of details. Moreover, oftentimes understanding a technical topic requires knowledge of the jargon as detailed in a following section.
Fill in the gap of connectivity between regions of the state that rely on public transportation by prioritizing high speed rail and long-range bus service
I don’t think the state can afford high speed rail and I am sure that the effect on travel in the only corridor (New York – Albany – Buffalo) where it might be feasible would not provide any meaningful reduction in GHG emissions.
Refine transit-oriented development strategy to elevate its estimated GHG reduction impact by 2050 from medium to high by placing the most emphasis on vehicle mile travel reduction.
Transit-oriented development refers to mixed use (residential, commercial and business) development along public transit lines to reduce the need for personal vehicles. Theory is fine but in practical terms I don’t see this as meaningful solution away from New York City.
Deemphasize vehicle electrification as the topmost solution as it fails to address single occupancy vehicle associated issues. This hinders our ability to address the root cause of runaway transportation emissions, and its related link to systemic issues such as racism and poverty
Apparently, the environmental justice advocates have issues with single occupancy vehicles. In the suburbs and in rural areas single occupancy vehicles are a necessity. In order to convince those residents that there is a link to systemic racism and poverty issues there has to be a dialogue with the opportunity to challenge some of the presumptions but that approach was explicitly rejected by Yeampierre in her overview of climate justice.
The McHugh-Grifa presentation also used the transportation presentation as examples of some of the points made for the bullet points above. One of her concerns was that the transportation panel recommendation outline presentation was filled with jargon and vague or squishy language and gave some examples. For example, in slide 20, component for delivery, “make ready costs for support facilities”, she complained that “I have been doing this work for a while and I just don’t understand what that means”. Apparently in her background in music education, she never got around to the obvious issue that if you electrify public transit buses, the transit garages aka support facilities have to be set up to recharge the batteries and service entirely different bus components. In my conversations with an expert in this field he has pointed out many nuances and complications to this challenge that he has said that even the state’s bus electrification alleged experts don’t understand. While I agree that the outline doesn’t do an adequate job providing documentation for the recommendations, I also have to point out that the presentation was never intended to educate members of the public who have no background in this sector simply because of space limitations.
It got worse. She complained of three problematic themes in the transportation recommendations that were not clear enough. The first theme was that the recommendations only focused on “encouraging and incentivizing” behaviors rather than “concrete and enforceable policy change that would advance the systemic transformation of our transportation system that the climate crisis demands”. In the context of single occupant vehicle use that translates to a vehicle mile traveled policy limit which I believe will bring out yellow vest protests the instant it is proposed. The second theme was the need for clear metrics coupled with enforcement mechanisms as exemplified by the apparent failure of the transportation sector recommendations to meet the expected reductions targets. I suspect that the transportation panel had some concerns that the reality of the changes to the transportation system needed relative to what is politically palatable led to the lack of specific enforcement mechanisms. The last theme concerned public engagement. Recall that a key premise of the climate justice framework is that decisions should be made by the communities. Absent any technical expertise that is a recipe for disaster.
Just when I thought it could not get any more absurd, McHugh-Grifa complained that the transportation recommendations did not consider the potential effect of climate refugees. She said that:
As climate conditions worsen, we in our region anticipate that we will see an increase in climate migrants and refugees that move to our area from other parts of the states and countries. There is no indication that the transportation panel has taken these kinds of population shifts into account or is considering how the transportation needs of any given region may change over the coming decades
I agree that climate refugees will be a problem in New York but it will not be because of people moving into the state. Instead, if these draconian policies come to pass, there will be a mass exodus out of state.
Response to Transportation Advisory Panel Recommendations
Transportation is a key climate justice concern. However, I think that in general the working group and for that matter the transportation advisory panel vision for transportation is out of touch with the reality of transportation in the suburbs and rural areas. For example, McHugh-Grifa stated that doubling the service would still be inadequate. That brings up the question just how much of an improvement to service would be necessary to entice people away from their personal cars. For example, I cannot conceive of any scenario where I would use public transit to go grocery shopping. As disappointing as it may be for public transit advocates, the fact is that outside of New York City housing has evolved around the use of automobiles. Changing that dynamic would require massive transformation of the rest of the state’s infrastructure.
The specific response to the transportation recommendations was presented by Eddie Bautista, Executive Director of the NYC Environmental Justice Alliance, who has a B.A. from N.Y.U. and an M.S. in City and Regional Planning from Pratt Institute. His presentation starts at 28:20 in the meeting recording.
Bautista claims that environmental and climate justices groups across the county are opposed to emissions trading programs like cap and trade. He consistently refers to a single study that claims that these programs not only don’t reduce hot spots but they exacerbate them. The paper “Carbon trading, co-pollutants, and environmental equity: Evidence from California’s cap-and-trade program (2011-2015)” appears to be consistent with his claims. Note, however, that a subsequent study that looked at a longer comparison period that “emissions from sources subject to the cap declined 10% between the program’s launch in 2013 and 2018”. Because GHG emissions are a function of weather and economic conditions there is large annual emissions variability which I believe accounts for the differences between these analyses. Moreover, the complaint that cap-and-trade programs do not eliminate pollution hot spots demonstrates a fundamental misunderstanding of air pollution control strategies. Cap and trade programs are designed to address regional pollution problems like acid rain, ozone and global warming. For those regional pollutants, concentrations are only a concern over large areas and impacts are not localized. The Clean Air Act established air quality limits to address air pollution hotspots and every source has been evaluated to determine if it affects compliance with those limits. With the exception of ozone, New York meets all those air quality limits. Because ozone is a secondary pollutant, emissions from neighborhood power plants cannot create localized hot spots. As noted with respect to Yeampierre’s presentation, it appears that the only environmental justice acceptable level for air pollution is zero.
I annotated the slide used in his presentation with my italicized comments below:
Transportation Climate Initiative (TCI) flaws
Best available evidence shows cap and trade systems do not eliminate air pollution hotspots, and often exacerbate them
This is a fundamental misunderstanding of air pollution control strategies as described in detail above.
Like RGGI, funds generated by TCI are vulnerable to budgetary raids by the Executive and Legislature
I agree with this comment
Reforms to cap and trade are unlikely to remedy pollution disparities given the program’s inability to surgically reduce mobile source emissions which are more complex to regulate than stationary sources
Because cap and trade programs were not specifically designed to address local impacts from any sources this is true.
The inherent design flaws of cap and trade result in environmental racism
My impression is that environmental racism refers to any disproportionate impact and that the only acceptable solution is no impact whatsoever.
The inadequate involvement of EJ groups in the policy process reflects a profound failure of democracy, and bolsters the case for abandoning sector specific carbon pricing policies for a comprehensive carbon fee like that in the CCIA.
New York agencies did an extensive outreach process relative to involvement in the Transportation Climate Initiative. I attended several of their meetings and environmental justice advocates were always in attendance and, frankly, it seemed that the majority of attendees were from that segment of society at least at one of the meetings. I think this is a harsh and unwarranted criticism of the Transportation Climate Initiative stakeholder process.
Denial of Home Occupant Justice
Protect low and middle income renters by amending the provision on new market rate housing within Transit Oriented Development that is currently limited to home ownership to include renting and rent to own options
No comment – way down in the weeds
Clean Fuels Standard Concerns
Allowing high carbon fuel producers to meet their credit obligations by paying clean producers for their energy is a weak way to enforce the standard -as it lets them offset instead of eliminate their emissions -which by itself won’t guarantee that emission reductions and investments in overburdened communities occur at the necessary speed and scale required by the CLCPA
The Transportation Climate Initiative was not designed to meet New York CLCPA net zero societal GHG reduction targets. Instead, they were looking at moderate reductions and this offset option was part of that strategy. The real question is whether this initiative has value as part of the CLCPA control strategy because these points are valid.
Clean air necessitates an ‘electrify everything’ approach.
No comment, see below
Allowing vehicles to combust lower carbon liquid fuels that still emit criteria pollutants won’t eliminate air pollution hotspots
This comment is correct
The second slide had two topics. Bautista covered the electrify everything that moves topic and at 38:50 of the meeting recording, McHugh-Grifa discussed the hone in on equitable vehicle miles traveled reductions and the extra support for communities facing barriers topics. She concluded that we need systemic change so we “respectfully request the transportation panel give it another go, ideally with more input from EJ groups or at least more commitment to incorporate the feedback from EJ groups that they have already received”.
Electrify Everything that Moves
Adopt ZEV for medium and heavy-duty vehicles and carve out explicit targets for trucks and bus conversion that prioritize diesel emission reduction in air pollution overburdened communities
As noted previously, widescale implementation of electric vehicles has severe environmental consequences elsewhere
As important, advocates for electric vehicles ignore all the downsides that make this technology a non-starter for many.
Mandate rapid phase in of the conversion of the state’s fleet to ZEVs
While it may be easy to mandate that the state fleet to convert, the question becomes where is the money going to come from.
Rapidly expand policies to encourage uptake of EVs –like incentives and enhancement/expansion of charging infrastructure
When I attended the TCI stakeholder meetings at least one speaker extolled the virtues of electric cars. Based on my reading I believe that you can make the case for one as the second car in the family which could be used most of the time. The problem is that there are many instances where an EV does not make sense, e.g., the occasional long trip where in route charging would be necessary.
Hone in on Equitable VMT Reduction
Establish a New York State-supported Equitable (Fair & Affordable) Transit-Oriented Development (E-TOD) effort via the Regional Economic Development Councils or through a New York Statewide E-TOD Program.
Include at least 20% affordable housing minimum for all new TOD
Amend Municipal Home Rule Law to explicitly allow fees on new development to offset public transportation service costs
Require at least 50% of transportation sector climate monies to be spent on non-car programs
As noted before, I don’t think TOD is a viable alternative outside of the NYC metropolitan area so this strategy has limited value
Extra Support for Communities Facing Barriers
Within the Consolidated Funding Application (CFA) of the Regional Economic Development Councils, mandate prospective developers and employers to identify how their prospective projects (and related NYS funding requests) consider public transportation options for low-income workers.
Incentivize hiring of disadvantaged workers in transit manufacturing by enabling companies to get a credit for setting aside a certain proportion of their workforce for hiring them
No comment
Response to Energy Efficiency (EE) and Housing Recommendations
The Climate Justice Working Group made the point that this panel’s presentation was done better than the transportation panel and that they handled the climate justice considerations better. The response to the EE and Housing recommendations was presented by Rahwa Ghirmatzion, Executive Director of PUSH Buffalo who studied English literature and economics at University of Buffalo starting at 40:48 in the meeting recording. Because this article is already too long and because I don’t take exception to much of their comments on this panel’s recommendations my review will be much shorter.
Ghirmatzion made a good point that the recommendations did not acknowledge New York’s energy affordability goal that households should not be paying more than 6% of their income on energy costs. The point was also made that the baseline for state goals should be made available with a system to track progress relative to those goals. I agree completely.
Her presentation discussed the need to support the transition to electric heating/cooling/cooking quickly. The working group is convinced that people in disadvantaged communities want a “safety net style guarantee of renewable energy to every household”. I have a hard time reconciling those initiatives that I believe will markedly increase energy costs with EJ advocacy support for them. Given that there have been programs available for years where consumers can sign up for wind and solar power supply programs but participation has been abysmal, I believe that most ratepayers really only care how much it costs. How can the advocates push for programs that will increase costs?
In the second slide of the response to the EE and Housing panel, Ghirmatzion recommended additional actions. Of particular note was the suggestion to calculate costs and benefits holistically with considerations of the health impacts associated with poor indoor air quality and insufficient thermal comfort as well as the cumulative cost burden related to housing, energy, transportation, and healthcare. Those are very good points. There has been very little information on costs provided to date and total costs are the key. One final point regarding the suggestion to tweak energy efficiency programs. Energy efficiency has been part of New York energy programs for decades. I have doubts that there is much more that can be done and have yet to see an evaluation of effectiveness relative to the goals.
Because of the length of this post, I am not going to discuss the questions and answers session starting at 48:00 in the meeting recording.
However, I have to mention Yeampierre’s response to the question at 1:35:44 about replicable solutions that could be expanded to further climate justice goals. Her response at 1:36:49 illustrates my concern about lack of expertise leading to wasted time and effort related to the approach of advocacy panels setting policy. She argues that current projects that use the industrial waterfront have been successful and suggests that using the waterfront as a delivery hub could be appropriate. She suggested that this could be a way to connect to economically depressed farmers upstate by way of refrigerated barges to the waterfront to distribute healthy food. This is a non-starter. There is a reason that barges are used for bulk commodities that do not have delivery time constraints – they are slow. Healthy food is fresh food and the range of suppliers within even a day of the New York City waterfront is so small that they could not possibly supply any meaningful fraction of the needs of the City.
Conclusion
I don’t think anyone disagrees with the concept that disproportionate environmental impacts on disadvantaged communities are a bad thing and should be addressed. Unfortunately, the Climate Justice Working Group approach to this is fatally flawed. On one hand their overview of climate justice did not include the concept of compromise so their comments on the panel recommendations were not constructive criticisms, they were demands for change. Their criticism of the lack of detail in the recommendations is warranted but I don’t think the background and education of the working group is sophisticated enough to understand the nuances and unintended consequences of all the panel recommendations anyway. On the other hand, their apparent goal is elimination of all environmental impacts to disadvantaged communities. The reality of environmental regulation is that trade-offs and compromises are necessary because zero-risk policies are impossible to implement. More importantly, pushing for minimal risks in one location means that risks are increased elsewhere as I explained relative to the rare earth metals used for energy storage.
In my opinion, the Climate Justice Working Group’s rationales and recommendations are driven more by special interests and emotion than fact. The summary article on the Pacific NW heatwave by Dr. Mass included a section on the politicization and miscommunication of science that was evident in this presentation. I entirely endorse some of the comments he made:
“Hyping global warming puts unrealistic and unnecessary fear into the hearts of our fellow citizens.”
“Global warming is an issue we can deal with, but only if truthful, factual, and science-based information is provided to decision-makers and the nation’s citizens.”
Politicians have “put political agendas ahead of truth and we are all the worst for it”.
In this instance I am willing to give the environmental justice advocates a pass on science accuracy especially given that the CLCPA and the state spokesmen have consistently hyped unrealistic global warming fears. The bigger concern is the attitude of the Climate Justice Working Group vis-à-vis to any modification of their demands. Because some of those demands are based on scientific mis-understandings and ignore worse unintended consequences it is not in the best interest of society as a whole, as compared to their narrow constituency, to implement all of their demands.
Contrary to their belief the CLCPA says their role is to consult with the advisory panels and Climate Action Council not be the final arbiter of the enabling strategies of the scoping plan. My impression is that they have adopted a “take it or leave it” position regarding their recommendations. It will be interesting to see if the Climate Action Council adopts a scoping plan that addresses the science or bows to the emotion-based approach of the Climate Justice Working Group.