

Richard Ellenbogen has a proven record implementing carbon reduction programs at his own manufacturing business in Westchester County. His factory has reduced its electric utility load by 80% while reducing its carbon footprint by 30% – 40% below that of the downstate system. This post describes his recent report: “An Economic Justification for Installing Rooftop Solar Arrays in The Con Ed Service Area – Even Without The Investment Tax Credit” (“Economic Justification”).
Richard Ellenbogen has been speaking to NY State policy makers and regulators since 2019 regarding the deficiencies inherent in NY State Energy policy. I have previously published other articles by Ellenbogen. He has no financial interest in any solar fabrication or installation company, so has no monetary interest in the results.
Caveat: I acknowledge that the following article includes section plagiarized from the Economic Justification document.
Overview
Richard Ellenbogen is President of Allied Converters, a plastic packaging converter that manufactures flexible plastic bags, sheets, rolls, and related film products, primarily for food and gift packaging markets. Allied installed one of the first commercial solar arrays in the downstate region in 2007 with a 50-Kilowatt (KW) DC rated array being activated on September 29, 2007. When the system was installed, he added monitoring and data collection systems so that he has 18 years of operational data.
Based on that information he has prepared a comprehensive Economic Justification showing how installing rooftop solar arrays on medium and large buildings operated in New York City and Long Island will be cost effective, even after the recent cancellation of the investment tax credit for solar arrays. He shows that “Returns on Investment (ROI) comparable to the 10% – 12% ROI promised by Bernie Madoff are achievable, except it is legal.” He explains that the justification works for customers in downstate New York because the rate increases
have been so egregious over the past 18 years.
The analysis is based on a few assumptions. The analysis assumes a $3.00 per watt installed cost for the array, minimal shading of the solar array, and the ability to use all the energy within the location where it is generated or have solar net metering so retail cost is applied to all electric energy generated. The calculations also are based upon no government monetary support for the installation beyond solar net metering and a tax rate of 30% to calculate depreciation of the asset. However, the numbers show that the installations will be cost effective even for entities that cannot depreciate the assets.
The document includes a twelve page economic justification description and four appendices.
Appendix 1 provides the depreciation schedule for a $150,000 solar array for a business with a 30% tax rate. Appendix 2 explains Line Loss. Appendix 3 – documents the 2008 Allied Converter Solar Net Metering Tariff Petition for a Declaratory Ruling on the administration of solar net metering provisions at locations where multiple (hybrid) energy efficient generation technologies are installed. Finally, Appendix 4 provides the data for Figure 8
Allied Solar Array
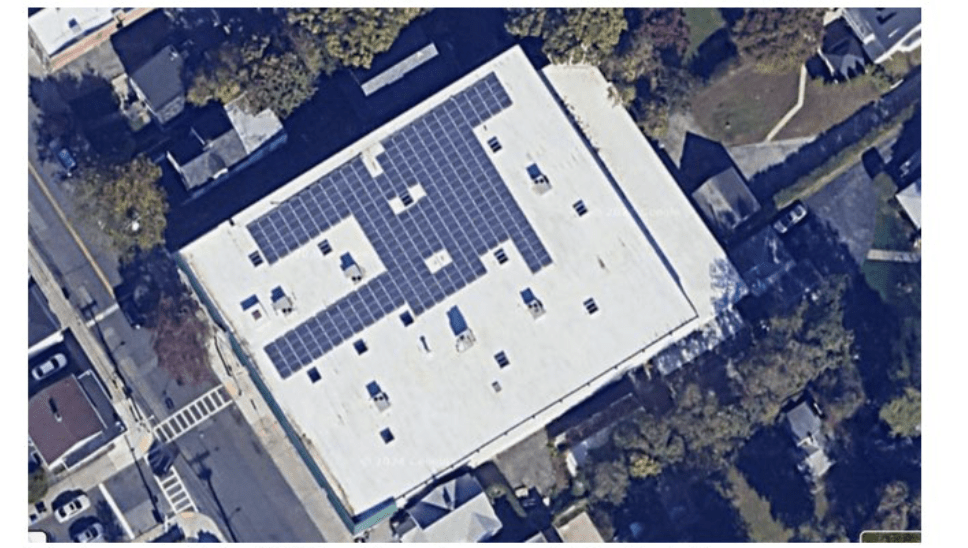
Allied Converters is in New Rochelle, NY in the Consolidate Edison (Con Ed) service area, about 17 miles from Times Square. It is a 55,000 square foot building with a 23,000 Square foot upper roof. Allied installed a 50 KW DC rated array in 2007 (Figure 1). Ellenbogen explains:
When the solar array was installed, the cost ($10/watt) made the total array cost $500,000 before rebates and tax credits. NYSERDA (NY State Energy Research and Development Authority) rebates at that time were very generous as were Federal and State Tax Credits. If they hadn’t been, no one would have installed an array and NYSERDA wanted data on the arrays. 18 years ago, NYSERDA actually did cutting edge energy research, as its name implies, and did not do science devoid energy proselytizing. The net cost of arrays installed on commercial facilities can be depreciated, after subtracting the tax credits and rebates. The depreciated cost of the 50 KW array at the factory was approximately $180,000.
Figure 1: Allied Factory and Solar Array
As a business owner Ellenbogen recognized that installing the array was not a good business decision but as an engineer he was curious about capability of the technology. Under normal circumstances, the investment would not have been a positive investment until this year 18 years after it was installed. However, Ellenbogen took advantage of a Washington D.C. Solar Renewable Energy Credit (SREC) program for out of District solar arrays. He applied as soon as the offer opened and became one of five out of District arrays with access to the SREC payments. Even though this source of income is no longer available the situation has changed. Array costs have decreased by 70% and utility costs per KWh in the Con Ed service area have increased by 66% since 2007 from 14.9 cents to 24.75 cents for commercial entities.
The analysis described below is based on data recorded since the installation of the array. This is not a theoretical assessment because it uses data that reflects weather conditions and maintenance issues.
Responsible Solar Development
I am publicizing this report because I think it represents responsible solar development. Ellenbogen describes several advantages of this type of development. Rooftop solar arrays on medium and large buildings use the energy where it is generated which eliminates line loss. Line loss occurs because wires are not perfect conductors. As is the case with many aspects of the energy transition, line loss becomes more of a problem when energy is needed most because when wire gets hotter the resistance that causes line loss increases. Appendix 2 in the Economic Justification explains line loss in detail. He points out that summer peak loads occur when temperatures are highest making on-site generation more advantageous.
He describes three other advantages. There is no need to build additional transmission infrastructure. Medium and large buildings can use all the power produced so there is no need for storage to provide usable energy. Finally, using rooftops means that there is no loss of farmland or environmentally sensitive land for solar development.
I would add another advantage. In areas with a lot of solar generation, output at peak times is frequently large enough that it stresses grid operations, can force renewable curtailment at midday, and complicates economics for dispatchable plants needed when solar is unavailable. These installations will typically not cause negative net-metering impacts because they use the power generated and displace load from the grid.
Array Degradation and Utility Costs
Ellenbogen’s justification is based on his observed solar array data and utility costs. I found the solar array data interesting:
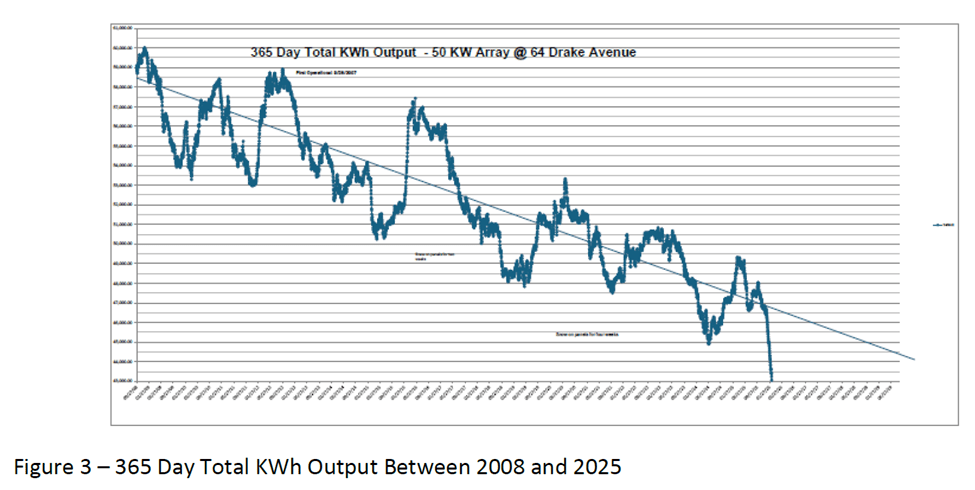
It is well known that solar arrays lose their effectiveness as they age. During its first year of operation in 2008, the array produced 60,000 KWh. This past year, 18 years after it was installed, the annual output has dropped to 46,500 KWh. That is an average decrease of 1.5% per year, or 760 KWh/year. The graph in Figure 3 shows the 365-day output over time. It starts in September 2008, 365 days after the array was turned on. Each data point is the sum of the prior 365 days of solar output. The steep vertical lines are either snow on the array, a period of high cloud cover (falling), or the effect of normal array operation a year later with no snow or cloud cover (rising).
Ellenbogen provides detailed utility cost information. In brief, he notes:
Just the opposite of falling solar array output has been the increase in utility costs over the same period. Commercial utility bills have two components. There is a “Demand” charge that reflects the maximum Kilowatt Usage over two 15-minute periods during the billing month. Then there is a “Usage” charge that is based upon how many Kilowatt-Hours (KWh) are used in a given month. Many of the surcharges are based upon KWh usage also. Because solar arrays are intermittent, they do not affect the demand charge. They only reduce the KWh usage. In 2009, subtracting the demand charge from the total electric bill yielded a KWh cost of $0,149 per KWh, including surcharges and related taxes. Doing the same calculation in 2025 resulted in a per KWh cost of $0.2475. That is an average increase in the KWh cost of 3% annually each year for the past 17 years. Because the array output is dropping by 1.5% annually and the utility rates are increasing by 3% annually, the dollar energy savings per year from the array’s output is actually increasing.
Solar Array Cost Justification
I am not going to discuss the details of the economic justification. I don’t have the appropriate economic background to provide any insight, but the numbers seem to speak for themselves. I will note that he mentions that his original intent was only to demonstrate the analysis for taxable corporations but later determined that the utility rate increases have been so high that the deploying solar arrays will be “cost effective for anyone in the downstate area that can use the full energy output of their solar array or benefit from solar net metering and can install the array for $3.00/watt.”
Discussion
Ellenbogen found that “Over a period of 28 years, a 13% annual return on investment is possible in the Con Ed Service Area from installing rooftop solar and if energy costs increase as they have for the past five years, higher returns than that will be likely. “ His analysis assumed no Investment Tax Credit and no government financial assistance of any kind beyond solar net metering.
There are couple of implications of this conclusion. I am not a fan of solar net metering because of its negative effects on the grid and the fact that ratepayers who do not have their own arrays subsidize the resources necessary to keep the grid operating. Buildings with sufficient load will typically not cause negative net-metering impacts because they use the power generated. They save money by displacing the energy that they would have had to purchase from the utility equivalent to the net-metering price.
The second implication is that it is no longer necessary to provide installation subsidies in Downstate New York. Ellenbogen’s justification is based on actual data. The calculations err on the conservative side based upon a higher rate of array degradation than is likely to occur with a new array. The results clearly show that “without government assistance of any kind, those that can install a rooftop solar array under conditions near those used for the model will see a significant annual return on investment.” I must emphasize the point that this works for “conditions near those used for the model”. I can assure you that solar availability is significantly better than anywhere Upstate that is influenced by lake-effect clouds and snow. I doubt that same cost-effectiveness results in the lake-effect cloud belt.
Ellenbogen makes the case for solar deployment as investments. He explains:
Past performance is no guarantee of future results; however NY State policy makers have proven to be reliably bad in this regard which will likely guarantee the higher utility rates. As a comparison, the S&P has returned 10% – 10.5% over the past 30 years and the Dow Jones has had an ROI of between 9.3% and 10.4% over that time frame. NY State’s predictability at implementing policies that will increase energy costs makes the solar arrays a more risk-free investment than the financial markets for anyone that has a shade free roof.
Conclusion
On one hand rooftop solar proponents could be encouraged that the Economic Justification demonstrates a strong case for deploying rooftop solar on large Downstate roofs that are not shaded. This helps the electric grid because these installations will shave peak loads because these facilities will require last energy. On the other hand, the primary driver of cost effectiveness is what I think are unsustainable electric rates now and increasing in the future. Ellenbogen’s concludes: “The models should also be a warning to state policy makers to show how their regulations are driving utility rates to a point where they will be entirely unaffordable within two decades.”
