According to the Climate Leadership and Community Protection Act (Climate Plan) the Scoping Plan will “achieve the State’s bold clean energy and climate agenda” and meet a “net-zero” goal of greenhouse gas emissions by 2050. At the November 30, 2021 meeting (recording here), Climate Action Council feedback on the draft Scoping Plan was discussed. A previous post documented the unresolved issues that need to be reconciled before the draft Plan can be released. Because it was so long, this article discusses the controversial unresolved issues and makes some observations on the status of the implementation process.
I have written extensively on implementation of the Climate Act because I believe the ambitions for a zero-emissions economy outstrip available technology such that it will adversely affect reliability and affordability, risk safety, affect lifestyles, will have worse impacts on the environment than the purported effects of climate change in New York, and cannot measurably affect global warming when implemented. The opinions expressed in this post do not reflect the position of any of my previous employers or any other company I have been associated with, these comments are mine alone.
Background
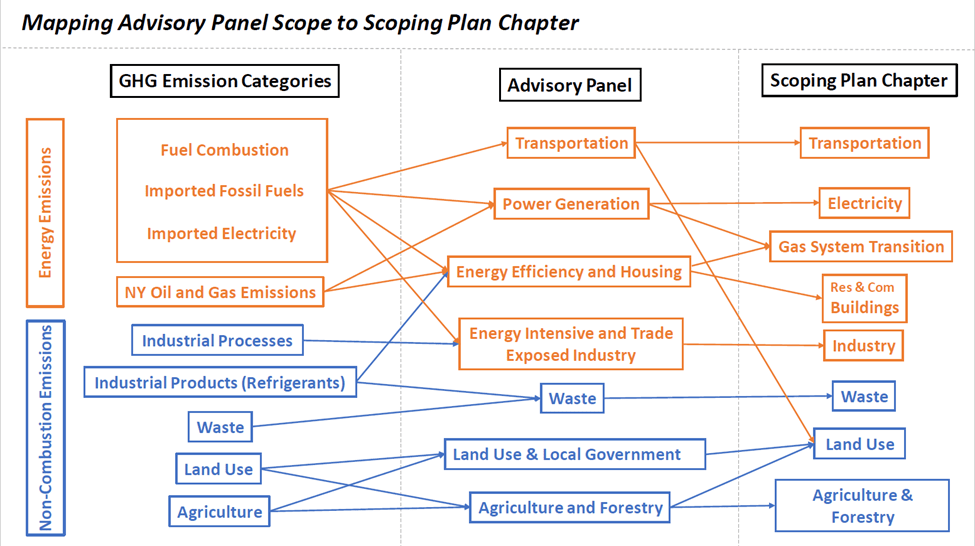
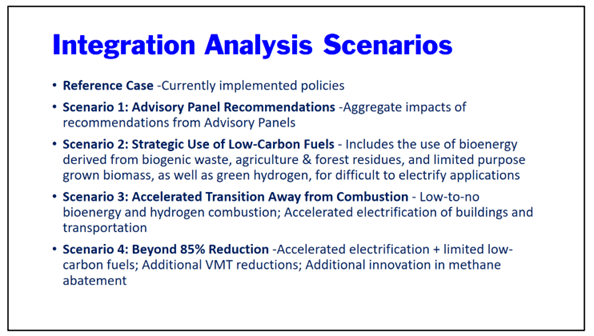
The Climate Action Council is responsible for preparing the Scoping Plan. Starting in the fall of 2020 seven advisory panels developed recommended strategies to meet the targets that were presented to the Climate Action Council in the spring of 2021. Those recommendations were translated into specific policy options in an integration analysis by the New York State Energy Research and Development Authority (NYSERDA) and its consultants. An overview of the results of this integration analysis were presented to the Climate Action Council at the two October meetings and has since been updated. A draft scoping plan has been prepared and distributed to the Climate Action Council but not to the public.
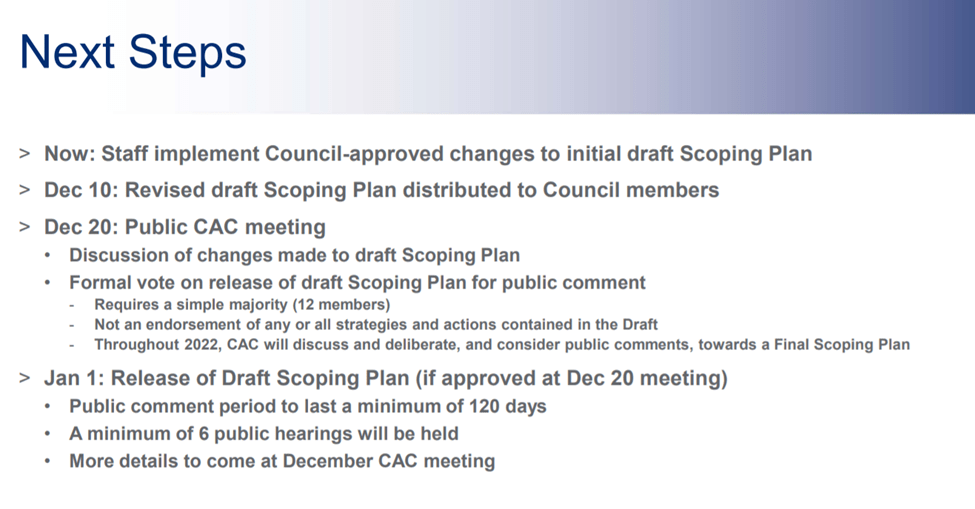
The November 30, 2021 meeting presentation included the following slide describing the next steps. Staff has implemented Council-approved changes to initial draft Scoping Plan but there still are unresolved issues. In fact, they had to schedule another meeting to reconcile remaining issues so that the revised draft Scoping Plan can be distributed to Council members by December 10. There is another meeting scheduled for December 20 when there will be a formal vote on the release of draft Scoping Plan for public comment. The plan is to release the Draft Scoping Plan on January 1 if it is approved at the last December meeting.
Note that the slide makes the point that the vote will pass based on a simple majority. They emphasize the point that the vote is “Not an endorsement of any or all strategies and actions contained in the Draft”. I am troubled by the last point that “Throughout 2022, CAC will discuss and deliberate, and consider public comments, towards a Final Scoping Plan” because that could mean that they will be changing the scoping plan outside the purview of the public participation process. This post discusses the unresolved issues in the scoping plan draft that I thought were controversial.

Council Membership
It is important to know the makeup of the Council to understand the feedback. There are 22 members on the Climate Action Council. Twelve members are agency heads. The remaining are non-agency “experts”, two appointed by the governor, three each appointed by majority leaders of the Assembly and Senate and one each appointed by the minority leaders of the Assembly and Senate. Importantly, all but three are “chiefs” with high-ranking titles which presumably means that in order to provide any meaningful responses they have to rely on their staff to provide synopses of the material presented to the Council so that they can make comments and keep up with their other responsibilities. There are only three “indians” who I expect would have to provide comments based entirely on their own work.
The ultimate purpose of the Scoping Plan is to guide the energy sector’s future consistent with the targets of the Climate Act. Of the 22 members of the Council only 8 come from energy sector organizations or have backgrounds in the energy sector. Four of the energy sector members are agency heads, two others represent renewable energy organizations, one an organization that represents both renewable and traditional energy organizations which leaves only one from the traditional energy sector. Donna DeCarolis is the President of National Fuel Gas and is the only member outside of state agencies that has any responsibility to keeping energy available to customers and who has no ties to the zero-emissions agenda. On the other hand, there are four appointees and one agency head that are primarily interested in environmental interests. One of these members also represents environmental justice interests. Therefore, it is irrefutable that the Council decisions will be biased.
Council Commenting Problems
In addition to the biases of the reviewers, there simply was not a lot of time available for them to give any detailed feedback. The draft Scoping Plan was sent to the Council members in November and they were asked to provide comments on what was described as an over 300-page document in time so that staff putting together the document could respond before the 11/30 meeting. Clearly that is insufficient time for a thorough review and considered responses from staff.
Another issue is who is doing the review. I cannot help but wonder whether any of the agency heads and leaders of organizations had the time to read the draft scoping plan at all. I suspect they may have assigned their staff to review the document. Furthermore, with respect to the 12 State agency I doubt that they would submit any critical comments.
Importantly, given that the Scoping Plan is primarily about the energy system I submit that most commenters are not qualified for this responsibility. I have always maintained that the Climate Act put the cart before the horse by passing legislation with specific targets without doing a detailed engineering analysis how it might work, whether the technology is available for it to work, and how much it could cost. It is unreasonable to think that any of the 22 members of the Council could provide meaningful input about the feasibility of the Scoping Plan scenarios in the timeframe they had for review given their backgrounds. Consequently, it is not clear why the Council should exclude anything from the draft scoping plan or consider choosing a recommended scenario. There is another over-arching problem with this process. Last summer I described how the precautionary principle is driving the Climate Act based on the work of David Zaruk, an EU risk and science communications specialist, and author of the Risk Monger blog. In a recent post, part of a series on the Western leadership’s response to the COVID-19 crisis, he described the current state of policy leadership that is apropos to the content of the issues raised:
“The world of governance has evolved in the last two decades, redefining its tools and responsibilities to focus more on administration and being functionary (and less on leadership and being visionary). I have written on how this evolution towards policy-making based on more public engagement, participation and consultation has actually led to a decline in dialogue and empowerment. What is even more disturbing is how this nanny state approach, where our authorities promise a population they will be kept 100% safe in a zero-risk biosphere, has created a docilian population completely unable and unprepared to protect themselves.”
Zaruk explained that managing policy has become more about managing public expectations with consultations and citizen panels driving decisions and that describes the Advisory Panels that provided recommendations to the Climate Action Council. He says now we have “millennial militants preaching purpose from the policy pulpit, listening to a closed group of activists and virtue signaling sustainability ideologues in narrowly restricted consultation channels”. I later wrote an article that predicted this would be the likely outcome for panel recommendations. That is exactly what happened with the advisory panels. Too many recommendations were based on ideology and not reality. Unfortunately, some of the more vocal members on the Council are also preaching purpose from their policy pulpit and issues raised reflect that dynamic.
Discussion
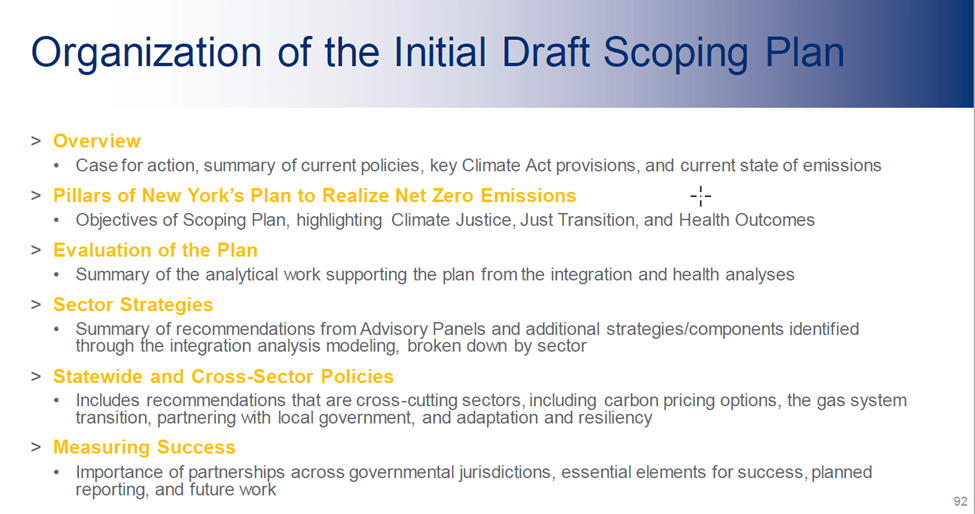
This discussion of the unresolved issues will focus only on those issues where there are apparent differences of opinion amongst the Council membership. If I did not think there was any controversy I did not discuss the material presented. The presentation for the meeting provides an excellent summary of the contents of the Scoping Plan because there is an overview in each chapter. For the sake of time, speakers skipped the overview and talked about the feedback for key points to incorporate that they thought were not controversial and described the unresolved issues. In my opinion there were many instances when the key points to incorporate were plenty controversial but that discussion will have to wait until another time.
General Feedback
At 1:13:38 of the video recording, general feedback contentious unresolved issues were discussed. The first issue raised was that the Climate Justice Working Group (CJWG) input on implementation strategy recommendations (including rejection of certain recommendations and the need for more robust plans/efforts in transportation and waste) were not integrated well enough in the draft. Staff authors did not think it was appropriate for them to take items out of consideration so they asked the Council to decide about the recommendations. Eventually I will have to address the CJWG input process in more detail but that will be a long post. In brief, my concerns about virtue signaling ideologues with no relevant energy sector expertise making policy are much greater for this group than any other Climate Act group or panel. They simply do not accept that concerns for energy reliability and affordability have to be balanced against their expectations. There are Council members that agree with that premise and I believe they made these comments. However, the recommendations to reject any policies and go even further for other policies are inappropriate simply because there are constraints and concerns that deserve to be addressed with public input beyond the Climate Act echo chamber. It will be interesting to see if the Council votes to accept these recommendations.

At 1:14:34 of the video recording the second issue raised was a request for an analysis on energy affordability and impacts to consumer pricing as part of the scoping plan scenarios. Sarah Osgood stated that the who pays aspect goes beyond the scope of the plan document and will be something that is addressed as part of the implementation process. During the discussion of this topic, it became apparent that the State has not refined their analysis enough to be able to provide this information at this time. In my opinion cost is a primary feasibility aspect and both industry representatives argued that it was necessary. I think it is bad enough that the Climate Act itself picked targets without the benefit of a feasibility study but now claiming that the scoping plan will not include those costs either is inappropriate.
There also were comments (1:15:21 of the video recording) in support of or rejecting specific strategies or actions (e.g., hydrogen, carbon tax) that staff thought appropriate to keep in at this time. The response stating that this “Requires additional Council discussion to develop a consensus position” portends contentious arguments. As described above, those arguments will not be based on fundamental understandings of the feasibility and consequences of, e.g., hydrogen or carbon tax, but on the uninformed emotions of Council members. In my opinion the scoping document should leave all the alternatives in and recommend which one was preferred. It will be interesting and telling how the Governor’s delegation (a majority of 14 appointed in one way or another by the Governor so whatever she wants she gets) decides to resolve these types of issues.
Gas System Transition
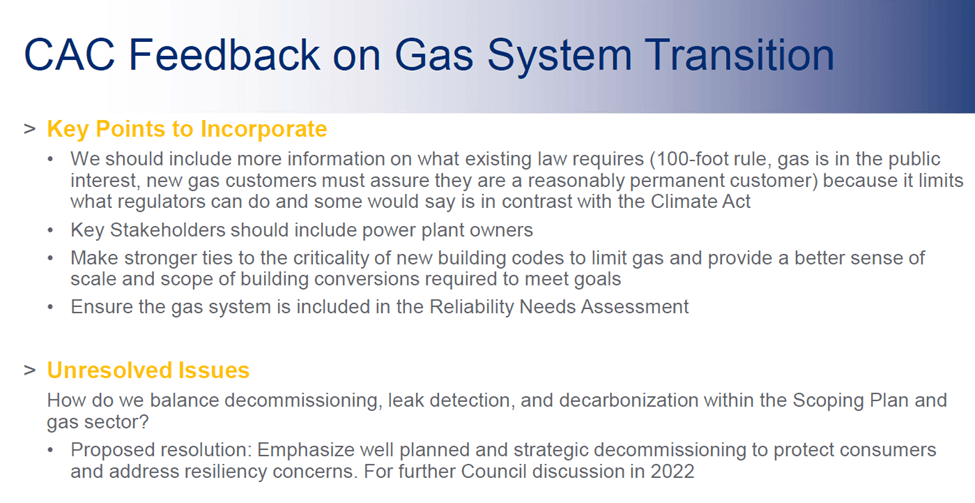
The gas transition system chapter is contentious (1:17:09 of the video recording):. It is included in a separate chapter because it is controversial and because it covers multiple areas of the energy system. The key points to incorporate at 1:19:21 of the video recording illustrate the depth of issues. The one unresolved issue was “How do we balance decommissioning, leak detection, and decarbonization within the Scoping Plan and gas sector?” This issue is the best example of particular individuals driving New York policy based on their personal ideologies.
It is important for anyone outside of the Climate Act echo chamber to understand that anything to do with natural gas in the Climate Act is based on the out-sized contribution of Dr. Robert Howarth. He not only helped draft the Climate Act but also now is a vocal member of the Climate Action Council. Most members of the Council have elevated his status to sainthood and unquestioningly accept whatever he says as gospel and this deference is also apparent in State agency documents. However, his views are not universally accepted. For example, the Climate Act requires New York to account for upstream emissions from fossil fuel used in the state because Howarth has claimed in a 2020 paper that “Some evidence indicates that shale-gas development in North America may have contributed one-third of the total global increase in methane emissions from all sources over the past decade (Howarth 2019).” This paper and other similar papers claim that “methane emissions can contribute significantly to the GHG footprint of natural gas, including shale gas” and form the rationale of the Climate Act vilification of natural gas.
Despite the Climate Act mandate to provide a “detailed explanation of any changes in methodology or analysis, adjustments made to prior estimates, as needed, and any other information necessary to establish a scientifically credible account of change” any contradictory information has been ignored. For example, there is a high quality, long-term monitoring network that measures methane (Lan et al., 2019) over the period when Pennsylvania shale-gas production increased tremendously. According to the plain language summary for the report:
In the past decade, natural gas production in the United States has increased by ~46%. Methane emissions associated with oil and natural gas productions have raised concerns since methane is a potent greenhouse gas with the second largest influence on global warming. Recent studies show conflicting results regarding whether methane emissions from oil and gas operations have been increased in the United States. Based on long‐term and well‐calibrated measurements, we find that (i) there is no large increase of total methane emissions in the United States in the past decade; (ii) there is a modest increase in oil and gas methane emissions, but this increase is much lower than some previous studies suggest; and (iii) the assumption of a time‐constant relationship between methane and ethane emissions has resulted in major overestimation of an oil and gas emissions trend in some previous studies.
The fact that the relevant high quality, long-term monitoring network does not show a trend consistent with the work of Howarth is a fatal flaw in Howarth’s claims. In addition, those measurements unequivocally support another contradictory analysis by Lewan that concludes his ideas, perspectives, and calculations on methane emissions from shale gas are invalid. The bottom line is that the whole basis of the State’s irrational war on natural gas is based on the flawed analyses of one biased individual.
Electricity
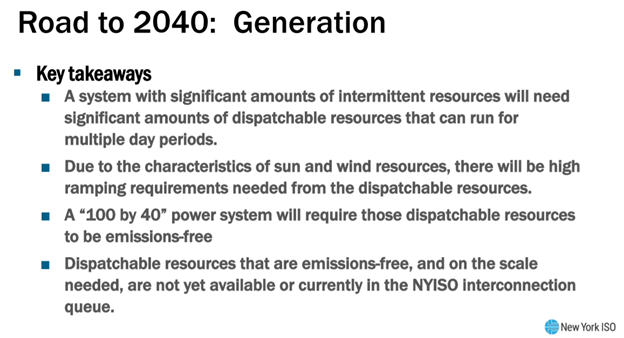
The unresolved issues discussion for the electricity chapter (1:23:42) noted that were four unresolved issues. The first, that the treatment of nuclear facilities in the draft was not sufficient, is not controversial. All the other topics will be discussed further in 2022 because they are controversial. The treatment of hydrogen, a mandate that renewable gas be used in non-distributed, non-combustion end uses only, and consideration of dual-fuel heating solutions that combine gas and electric heating sources as a possible solution to mitigate winter peak demand impacts are controversial and related. Hydrogen is a place-holder technology for the zero-emissions firm dispatch resource but it was not my impression that it had to be a non-combustion source. Renewable natural gas has been proposed as an alternative source for power and home heating but that is not good enough for some on the Council.

I don’t believe that many of the Council members understand all the myriad issues associated with hydrogen and the implications associated with such an untested technology relative to reliability. For example, Peter Iwanowicz, currently with Environmental Advocates of New York, is a vocal supporter of non-combustion solutions. As far as I can tell there is nothing in his education that suggests that he understands the energy system and his experience seems limited to advocacy organizations and environmental agency positions outside of the energy sector. Consequently, I doubt that he understands the problem trying to address the need for zero-emissions firm capacity resources using hydrogen. That he wants to limit the use of hydrogen to non-combustion electricity generation (fuel cells) is terrifying inasmuch as there is a chance that it could become state policy. It is a magical solution unworthy of any consideration for a reliable electric system in the time frame of the Climate Act.
The renewable natural gas and dual-fuel heating solution are opposed by the ideologues that believe methane in any form is unacceptable. They only hear what they want to hear and disregard anything that does not match that position. I do not think their position can be reconciled with the need for a resilient energy system because making everything electric forces reliance on a single source of energy that can be shutdown by weather, such as an ice storm.
Buildings Chapter
Three unresolved issues were discussed (1:30:24 of the video recording) in the buildings chapter. The first asked why there was no discussion of a dual-fuel path, using hybrid heating systems and existing gas infrastructure, comparable to the NYC pathways study. This is similar to the dual-fuel electricity issue discussed above. Staff stated that there isn’t time to do this now and suggested that the Council discuss this next year. One of the issues with this problem is that the anti-natural gas authors of the Climate Act deliberately gamed the emissions accounting conventions to prevent the use of methane from any source. Because all emissions have to be reduced, the result is that they need hydrogen for uses where combustion is necessary such as “transportation, industrial purposes, and electricity reliability”. In my opinion the special interest authors snuck this requirement in either deliberating ignoring the impacts or unaware of the challenges introduced with them. The dupes who voted for the Climate Act had no idea of the consequences so now we are stuck with them. The Climate Act’s failure to develop a rational, feasible plan is a recipe for reliability crises.
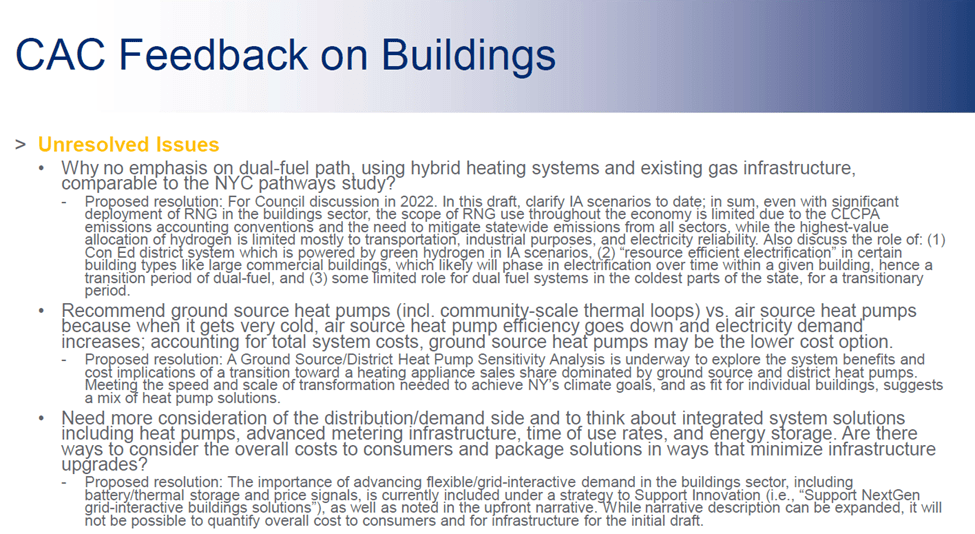
Another unresolved issue is a recommendation to use more ground source heat pumps. Apparently even the commenters get the point that reliance on air source heat pumps that do not work when the temperature gets really cold is a bad idea so the “solution” is to use more ground-source heat pumps. In a world where costs don’t matter that might be a solution but the impact to New York State would certainly be increased costs. Staff proposed to respond with a ground source/district heat pump sensitivity analysis to “explore the system benefits and cost implications of a transition toward a heating appliance sales share dominated by ground source and district heat pumps.”
One of the big issues with the electric system is the problem that electric loads will certainly go up when everything is electrified. The ideologues subscribe to a “smart-planning” solution that includes heat pumps, advanced metering infrastructure, time of use rates, and energy storage. This wasn’t particularly controversial but it is another indicator that Council members don’t understand that there are technological limits to what can be done. The public surely has no idea that not only will their homes have to be completely electrified but their appliances will be monitored and controlled by big brother.
Transportation Chapter
The unresolved transportation issue discussion started at 1:37:05. There was one unresolved where there were opposing views in the comments. There is debate over the inclusion of low carbon fuels for hard-to-electrify vehicles and equipment, including renewable diesel and hydrogen. The question proposed to the Council was whether two options for the use of low carbon fuels should be included in the Scoping Plan for public comment or whether the Council should discuss this in 2022 after getting public comment. In my opinion this should be included in the Scoping Plan. If it is not included then when can the public provide input?

Local Government
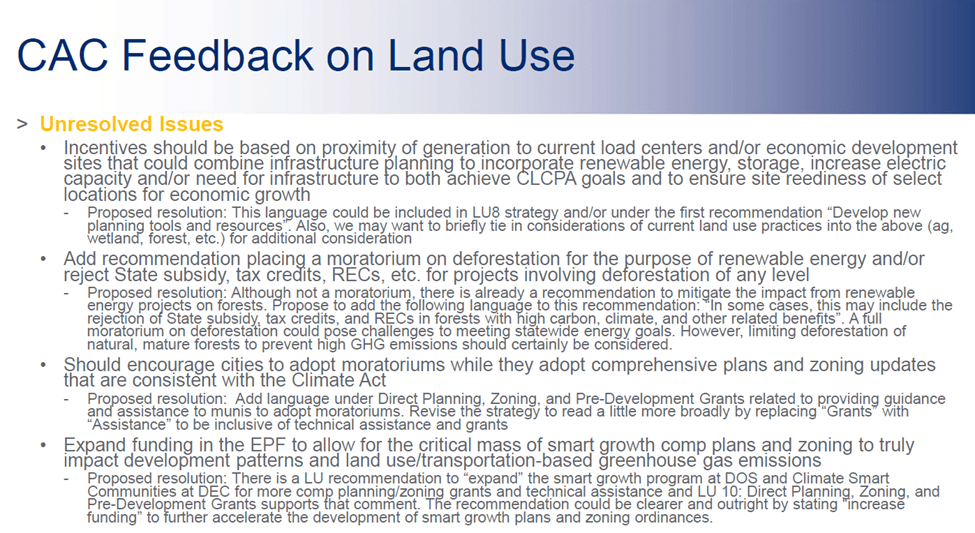
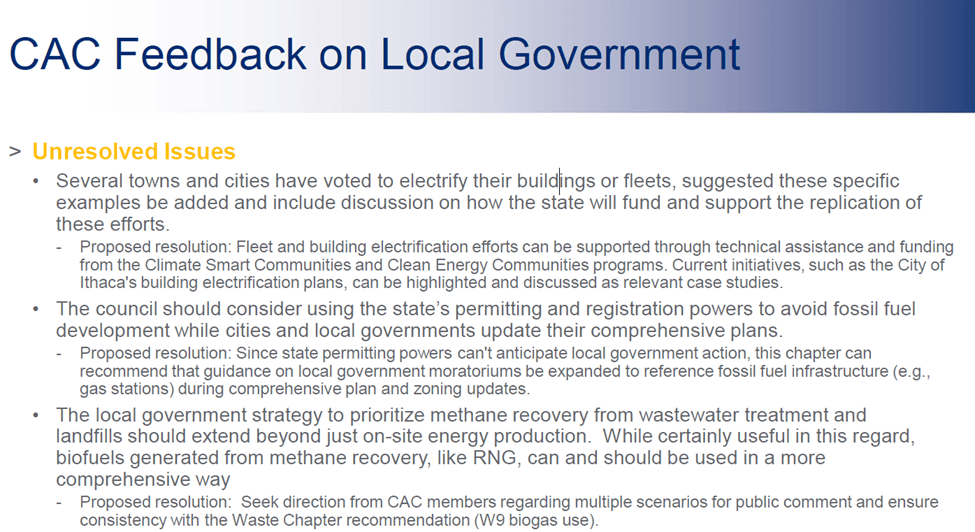
There were three unresolved local government issues (2:01:50) but only the last two were controversial. The first controversial issue is that the Council should consider using the state’s permitting and registration powers to avoid fossil fuel development while cities and local governments update their comprehensive plans. The response stated that “state permitting powers can’t anticipate local government action, this chapter can recommend that guidance on local government moratoriums be expanded to reference fossil fuel infrastructure (e.g., gas stations) during comprehensive plan and zoning updates.” There is a definite vibe from the Council that because the law says that emission reductions are necessary that it is necessary to stop all new fossil fuel infrastructure now. I am not sure whether someone on the Council has raised this as problematic but I am sure the general public would question it. Finally, and continuing with the theme that methane is evil, was a comment that local government strategy should not only prioritize methane recovery from wastewater treatment and landfills but extend beyond just on-site energy production. The response was to seek direction from the Council regarding multiple scenarios for public comment.
Waste Chapter
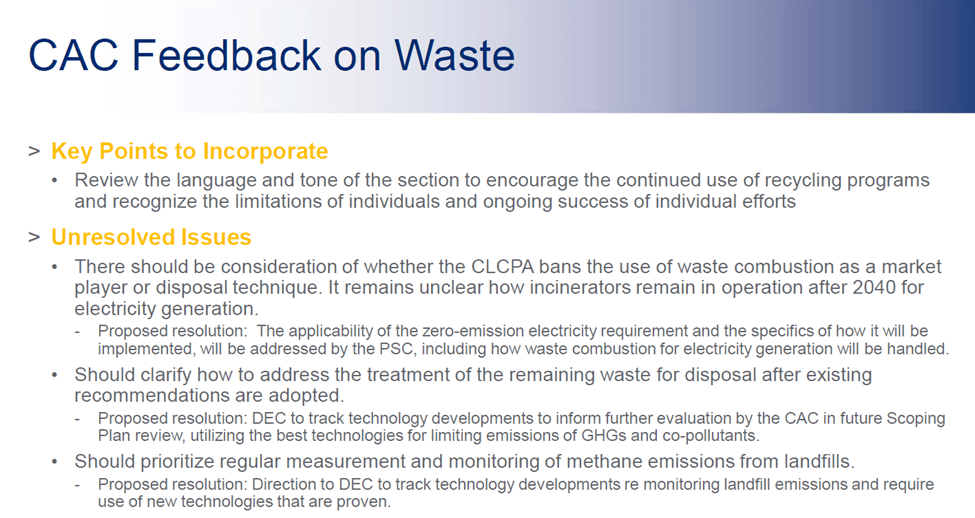
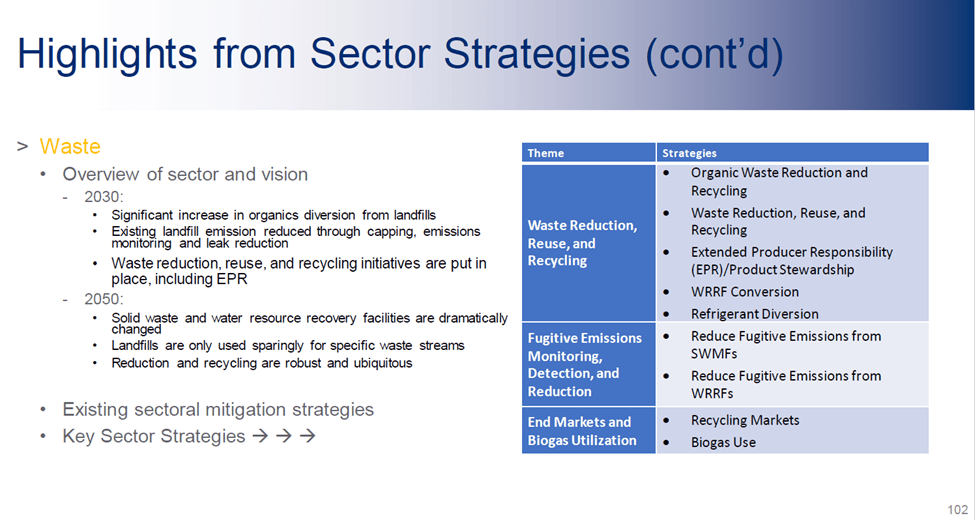
There was one unresolved controversial waste chapter issues (2:05:38 of the video recording). The controversial issue was whether the Climate Act bans the use of waste combustion as a market player or disposal technique. The controversy is whether the 2040 zero-emission electricity requirement bars the use of incineration as a waste management option if the incinerator also produces electricity. The Staff response stated that the applicability of the zero-emission electricity requirement and the specifics of how it will be implemented, will be addressed by the PSC, including how waste combustion for electricity generation will be handled. In my opinion it is wishful thinking to believe that the waste stream will be reduced so much that incineration won’t be necessary. If there is a need to incinerate then not using the electricity seems counter-productive.

Climate Justice Chapter
There were two unresolved issues but only the second was semi-controversial (2:10:30). That comment said that the draft should include “a specific discussion on gender and climate and the need to include a gender lens for women, femmes and girls on the front line of the climate crisis”. Staff asked the Council to discuss this topic and provide guidance. I think was labeled as unresolved only because it came up so late in the process that it was not discussed. However, I also believe that there is a concern whether this is in fact a problem in New York.
I believe this comment came from Raya Salter a lawyer representing environmental justice interests on the Council. I also think that she raised the problem because of a COP 26 United Nations Climate Change conference session stating that women bear the brunt of the climate crisis. During the call she commented in the chat window that it should not be controversial and the Council ultimately agreed. However, in my opinion while it is understandable that this is a global concern the UN description of the problem suggests that this may not be a relevant problem in New York. For example, one of the pictures illustrating the UN webpage reference above shows women carrying their latest rice crop on bicycles in Vietnam. In New York one of the strategies for emissions reduction is “active transportation” that encourages the use of bicycles. I cannot help but wonder if the Vietnamese ladies would prefer to have a fossil-fueled truck so they could stop using active transportation. More importantly the UN concern is for those ladies who spend their days trying to survive in the open, totally at the mercy of weather. That is not the case in New York.

Conclusion
The Climate Action Council is supposed to develop a plan to “achieve the State’s bold clean energy and climate agenda”. Based on the issues discussed at this meeting I think there are several dynamics at play, none of which are in the best interest of most New Yorkers.
The underlying premise of the authors of the Climate Act and dupes who voted for it was that transitioning the New York energy system to net-zero by 2050 was only a matter of political will. As a result, the targets were chosen without doing a detailed engineering analysis to determine how it might work, whether the technology is available for it to work, and how much it could cost. Now it is a law and some members of the Council frequently point out that zero-emissions are mandated, period. Whether they don’t understand that could prove to be impossible, don’t want to understand the technological limitations, or are so invested in their personal agenda that they don’t care despite understanding the risks I don’t know, but it is not an appropriate dynamic for keeping the lights on.
The second dynamic is the underlying war on natural gas. Despite all the many benefits of natural gas, the law and some of the most vocal members of the Council vilify its use. There is no benign way to make electricity and safely provide energy for today’s society. If there were options to natural gas that could ensure reliability, maintain affordability, and not have their own set of environmental impacts likely comparable to the use of natural gas, then the irrational war might be in the best interests of New York but, as any unbiased evaluations of all the impacts and risks shows, no such options exist.
The Climate Justice Working Group (CJWG) presents another dynamic. The Climate Act’s clean energy and climate agenda is not limited to simply transitioning the energy sector to meet the net-zero target. Equity and environmental justice concerns are also significant aspects of the law. While there is no question that those are appropriate goals, the problem is that the advocates on the CJWG and the Council appear to be place addressing those goals before the need for a reliable and affordable energy system. I don’t think that mis-placed emphasis will work out well.
The Scoping Plan will be used to inform the Energy Plan that governs the New York energy system. It is becoming apparent that the Scoping Plan alone won’t be able to adequately guide the energy sector’s future to meet the targets of the Climate Act because it appears that it won’t address technological and affordability feasibility. The Hochul Administration has the Council votes to do whatever they want so the decision how this will be resolved is at the Governor’s discretion. A friend describes the current situation well: these morons are apparently fully at ease with the equivalent of jumping out of a perfectly good airplane without a parachute assuming that the concept of a parachute will be developed, proven technically and economically feasible, and delivered to the imbecile that jumped out of the airplane in time to provide a soft landing.