

I have calculated how much solar and wind power might be available based on meteorological data for several scenarios. I discovered another complication that I had not previously included in my analyses that is the subject of this post. In particular, the effect of snow cover on solar output.
Background
I have analyzed the potential solar generation output that can be expected from facilities in New York based on incoming solar radiation. In comments that I submitted on the New York Department of Public Services resource adequacy proceeding I prepared a white paper that provides an initial estimate of the likely energy storage component requirement based on historical meteorological data and developed an example of potential problems with air source heat pumps. Based on that work, my primary concern is that New York State has not done a feasibility study to determine whether the solar and wind resources in the winter are sufficient to provide enough power when the heating sector is electrified.
Obviously if solar panels are covered with snow the generation output will be reduced but I had never quantified the impact. The New York State Energy and Research Development Authority (NYSERDA) has an integrated data system that provides operational data on Distributed Energy Resources installed in New York. During the research for a previous post on this system I downloaded solar output data for the Howland Solar project in Sandy Creek, NY for the winter of 2020 and found data that could be used to estimate the effect of snow cover.
The following graph shows solar output data for the Howland Solar project in Sandy Creek, NY for the winter of 2020. This site is located east of Lake Ontario in the heart of its lake-effect snow belt.
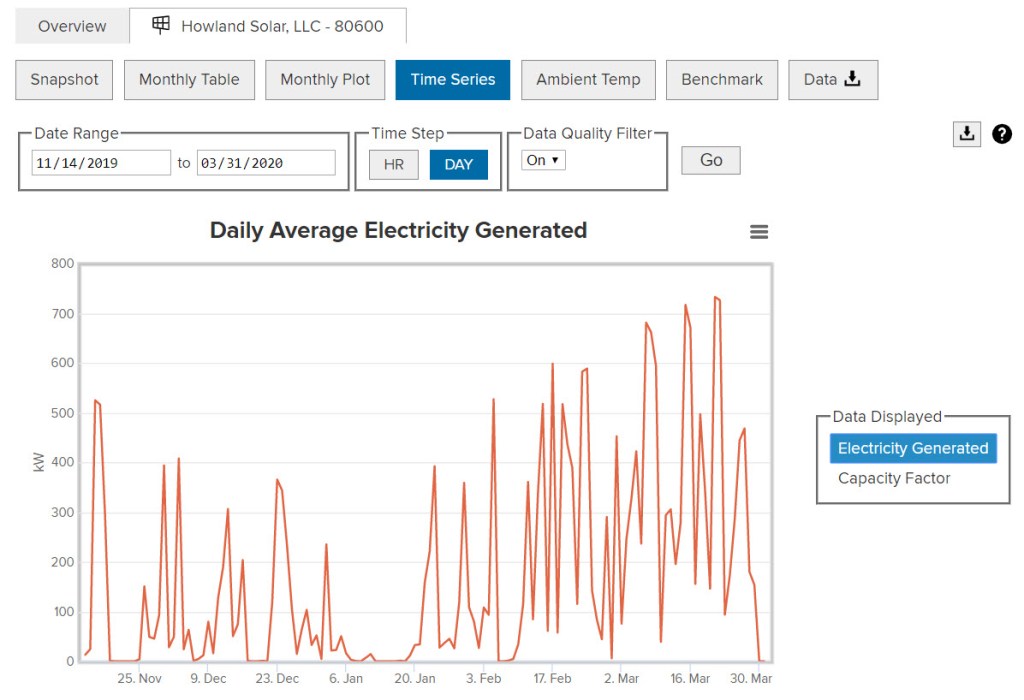
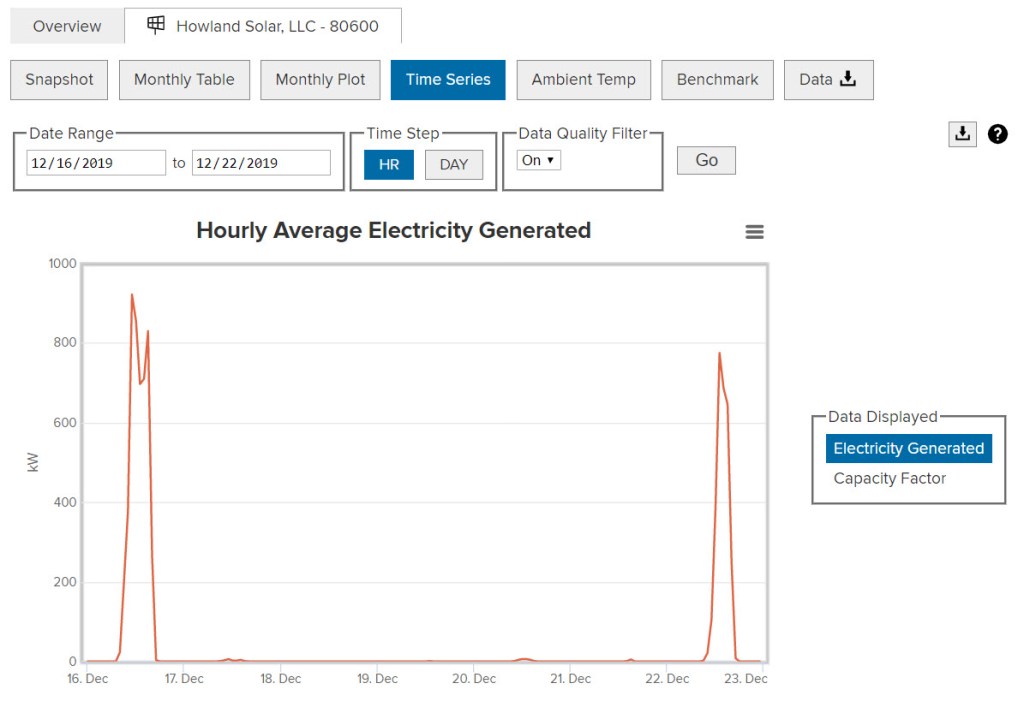
The thing that caught my eye were four periods when the daily average electricity generated was zero. In this analysis I will focus on the period near December 23. As shown in the next graph data from 16 December through 22 December indicate there was zero solar generation on five consecutive days.
The NYS mesonet has a monitoring station located close to this solar facility at Belleville. The following 7-day meteogram for this site shows that there was a snowstorm during this period. Note that the time scale in these graphs is for UTC time so they differ from the local time by five hours.

Although it is hard to see, the gold trace in the upper left graph is solar insolation. That graph also lists temperature which was below freezing throughout the period. The dark green line in the lower left graph is cumulative precipitation. On the graph it starts between 16/23 and 17/23 but because of the UTC times the onset was much closer to the start of December 17. Note that at the time when the total precipitation increased the most that the sonic wind speed and gusts (black and blue) in the upper right graph also peaked and that the wind direction was WNW as shown in the lower right graph. Those conditions are the classic signature of a lake-effect snow event.
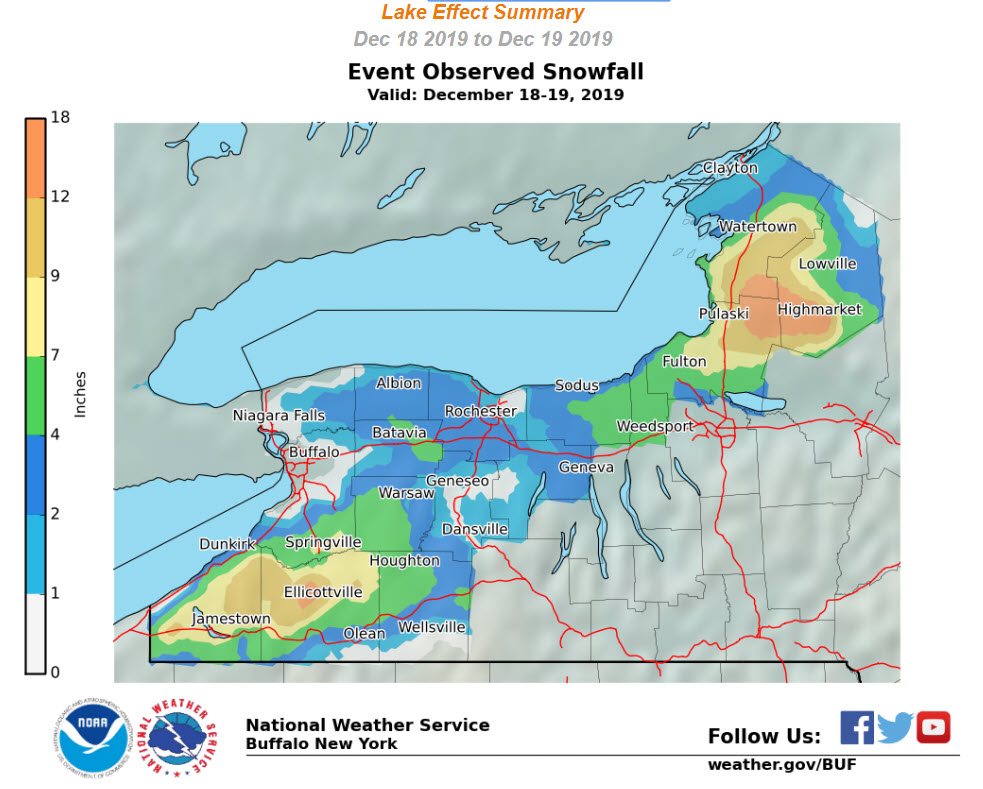
The Buffalo National Weather Service office archives lake-effect snowfall maps for all big events. The map for this period confirms that this was a lake-effect event. The solar facility and the mesonet station are located just north of Pulaski at the eastern end of Lake Ontario squarely in the area that got at least 7″ of snowfall.
The Problem
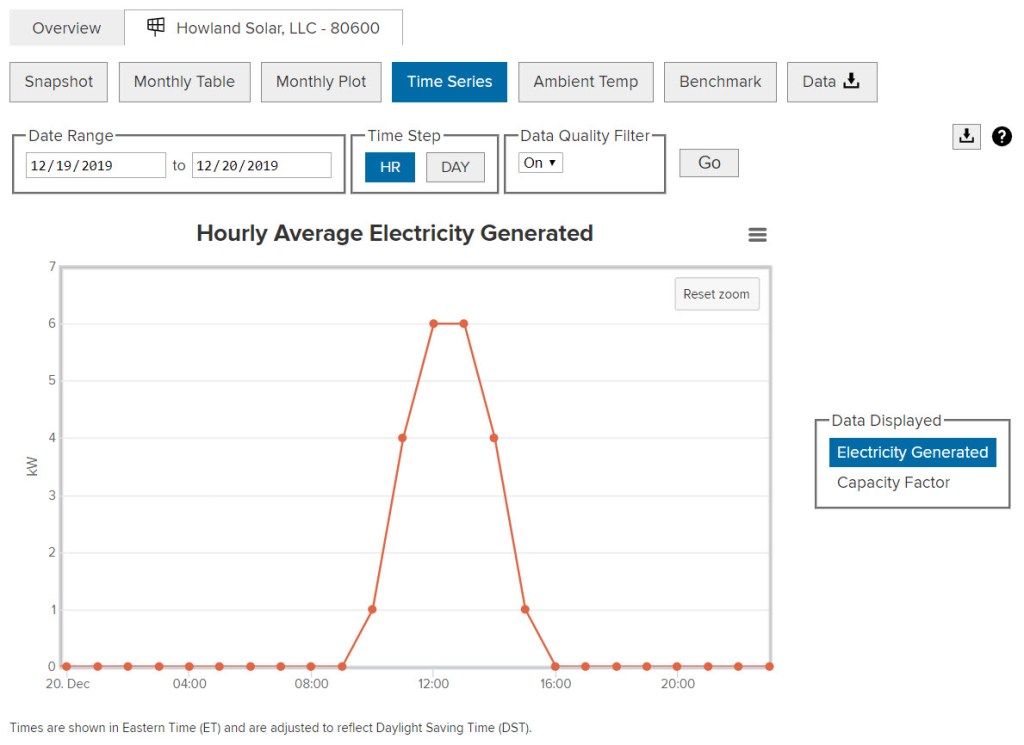
The following temperature and solar radiation meteogram graph for 20 December shows the solar radiation more clearly than in the seven day. I have not found a better daily solar insolation curve to date. There is no indication (squiggles on the curve) of any variation of intensity other than diurnal sun angle. There could not have been a single cloud that day. The key point is that the temperature struggled to get up to 10 degrees F that day so there would have been high energy demand for heating at the same time .

So how much electric generation did the Howland solar installation provide to the grid that day? There were two hours of 1 kW, two hours of 4kW and two hours of 6 kW for a daily total output of 22 kWh. I checked my usage for that period and I used a total of 766 kWh for a daily average just under the total output of this facility. Importantly I do not use electricity for heating, cooking or hot water.
Conclusion
Clearly, it is not enough to just look at meteorological conditions to determine the potential worst case for solar power generation output. Intuitively it is obvious that snow will cover solar panels and the output will be reduced. This post demonstrates that for a 7” snowfall one solar facility output went to zero for four consecutive days. I expect that any solar facility with a similar panel configuration located inside the seven-inch contour of the lake effect snow summary map would be similarly affected.
Weather maps for December 17-19 2019 show one typical winter storm scenario for New York. On 17 December the first snow falls when a storm system goes up the coast. When this happens snowfall is widespread but higher closer to the coast.
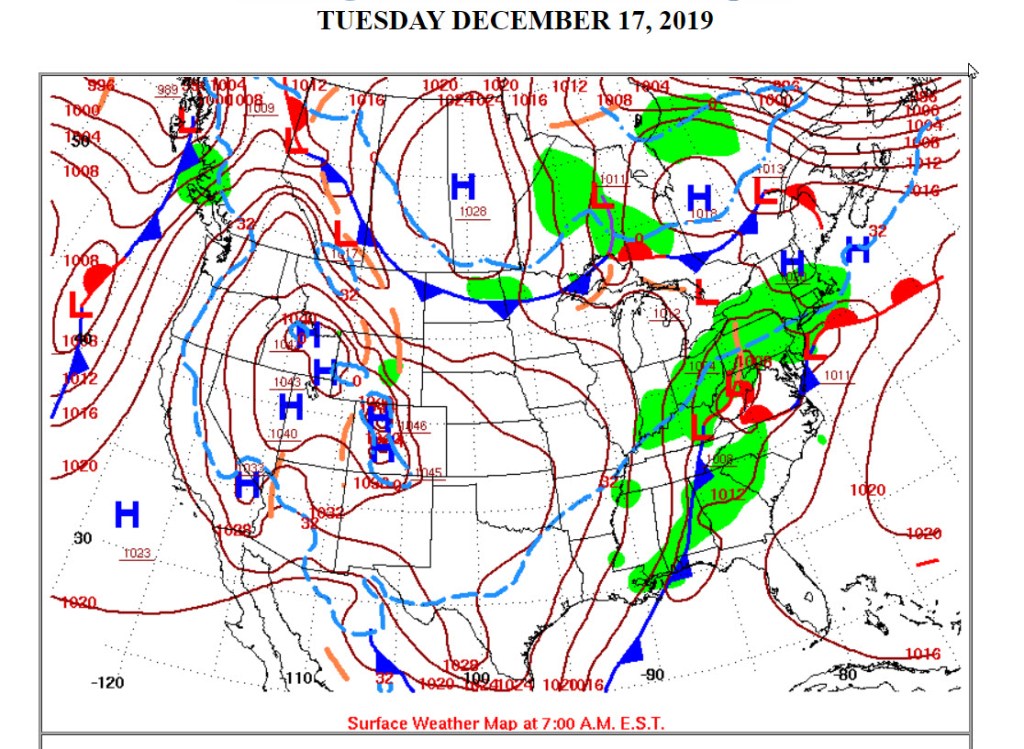
On 18 December the storm system heads off to the north and east and as it does it draws colder air down from the north. Oftentimes like in this period, lake effect snow bands develop with smaller areal extent but more snowfall.

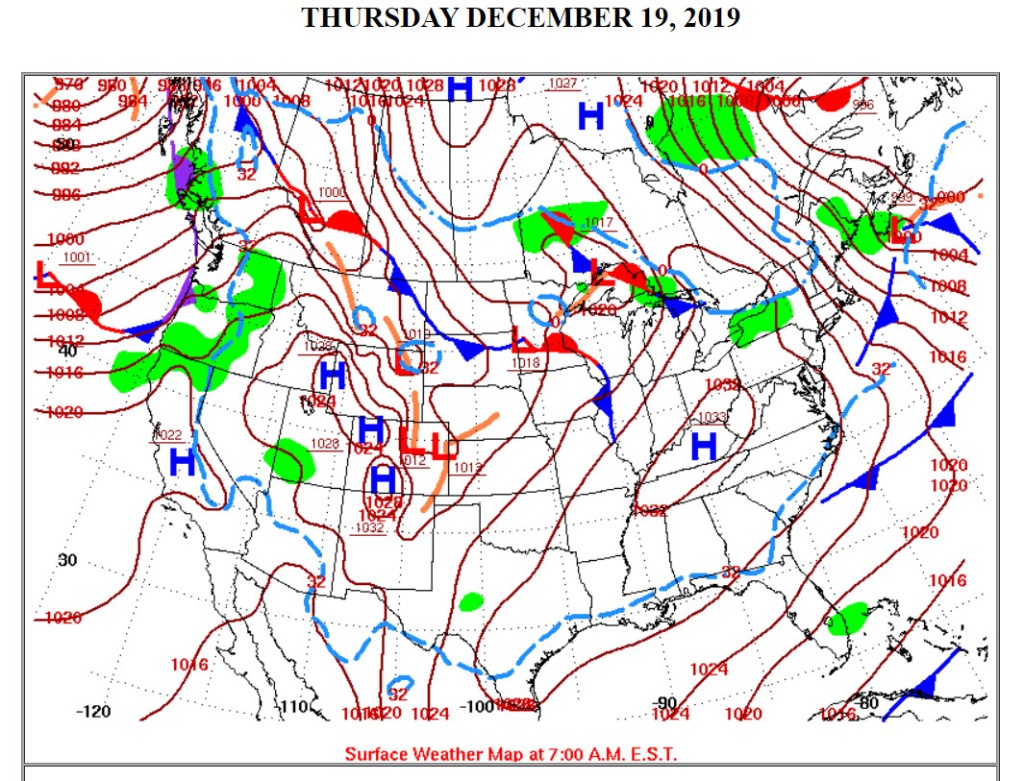
Finally, the cold air settles in behind the storm and lake-effect event, albeit not shown well in the 19 December map.
The future energy system ramification of this is important. As shown here snow cover can eliminate solar generation output. It is important to consider what will happen when there is a really big snowstorm that blankets New York with 7” of snow, followed by a lake-effect event that covers the usual lake effect areas with even more, and ends with a really cold day caused by a high pressure system. Now you are talking about no solar output and reduced wind output at the same time electric loads will be high due to heating electrification. The data shown here suggest that the no solar output situation can last for days.
Until such time that New York State shows that they have a plan to address this worst-case situation I believe we could end up with people freezing to death in the dark.

Thanks for the post Roger. It seems the internet is still unhappy with me as I could not like the post.
I shoveled a lot of lake effect snow back in the 1960’s. The freeze thaw cycles played havoc with my ability to clear the apron of the driveway of the ice the use to build up.
A Wallmart in update New York appears to have abandoned their PV system- https://der.nyserda.ny.gov/reports/view/performance/?project=156
A similar sized PV project, 494 kW, at a Macy’s is still operational-
https://der.nyserda.ny.gov/reports/view/performance/?project=212
A rather large PV project at Houghton College also shows very poor performance in the winter months-
https://der.nyserda.ny.gov/reports/view/performance/?project=247
LikeLiked by 1 person