

At the January 19, 2021 Climate Action Council meeting there was a discussion of New York’s value of carbon guidance document and it has become clear that the Council intends to use the value of carbon to claim that the costs imposed on New Yorkers are “cost-effective”. The problem is that they will be comparing real costs today against contrived value-driven estimates of speculative impacts occurring in the far future elsewhere. This extensive post provides context for their numbers that maximize the costs and addresses explanations of the value of carbon guidance provided at the meeting.
On July 18, 2019 New York Governor Andrew Cuomo signed the Climate Leadership and Community Protection Act (CLCPA), which establishes targets for decreasing greenhouse gas emissions, increasing renewable electricity production, and improving energy efficiency. It was described as the most ambitious and comprehensive climate and clean energy legislation in the country when Cuomo signed the legislation.
I have summarized the CLCPA Summary Implementation Requirements and written extensively on implementation of the CLCPA closely because its implementation affects my future as a New Yorker. I have described the law in general, evaluated its feasibility, estimated costs, described supporting regulations, listed the scoping plan strategies, summarized some of the meetings and complained that its advocates constantly confuse weather and climate. The opinions expressed in this post do not reflect the position of any of my previous employers or any other company I have been associated with, these comments are mine alone.
In this post I tried to simplify the discussion as much as possible but still ended up with a post that was too long. In order to address this, I rearranged the order of the sections. I provide background information first followed by a synopsis that presents the key findings and conclusions. If you want to learn where the numbers come from a simplified description of the methodology used to calculate the key findings comes next. Finally, I present a more detailed description of the CO2 societal cost analysis to provide even more details for anyone interested. Because I have not figured out how to format tables and show them in the text each table has a link to a formatted version. Stay tuned for an even simpler version if this one gets too wonky.
Background
The CLCPA requires that the Department of Environmental Conservation (DEC), in consultation with the New York State Energy Research and Development Authority (NYSERDA), establish a value of carbon for use by State agencies. This value of carbon represents the present-day value of projected future net damages from emitting a ton of CO2 today. A draft document was issued for comments in October 2020 and in December the Value of Carbon Guidance (“Guidance”), an appendix with values for carbon dioxide, methane, and nitrous oxide, and a supporting memo were released for use by State agencies along with recommended guidelines for the use of these and other values by State entities.
I followed the development of this guidance throughout the process and if you want to get into the weeds then check out my previous posts. I described the background of the value of carbon after the initial stakeholder webinar, documented the comments I submitted on the draft document, and described the DEC response to my comments. Be forewarned however, these posts are wonky. In this post I attempted to show how differences in purported reduction benefits vary as a function of different assumptions.
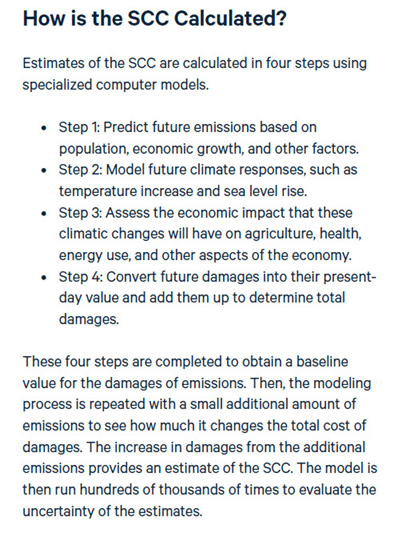
The Guidance has prepared estimates, in dollars, of the economic damages that would result from emitting one additional ton of greenhouse gases into the atmosphere to justify the costs of mitigating strategies. Resources for the Future (RFF) prepared an overview summary of the process used to calculate these values and described how the values are used in policy analysis. Note that Guidance supporting memo was prepared by the New York State Energy Research & Development Authority (NYSERDA) and RFF and includes much of the same information. The Guidance recommends using the damages approach to valuing carbon. RFF refers to the value of carbon using that approach as the Social Cost of Carbon (SCC) and I will use the value of carbon and SCC interchangeably in this post. According to RFF:
The point of this post is that there many choices that affect the value of the SCC. The emissions, climate response and economic calculations are based on research and expertise from many different fields, such as climate science, demography, and economics. While proponents of this approach give the impression that the input presumptions are based on the “science”, the reality is that assumptions made by model developers play as much of a role as “science” on the results. Inevitably the assumption decisions are subject to value judgements and the biases of the researchers. RFF also notes that “the modeling must incorporate information that is inherently uncertain, such as projections of future economic growth.”
The Guidance document makes a recommendation for the value of the SCC to use: “The Department specifically recommends that State entities provide an assessment using a central value that is estimated at the 2 percent discount rate as the primary value for decision-making, while also reporting the impacts at 1 and 3 percent to provide a comprehensive analysis.” For CO2 this translates into a 2020 value of carbon dioxide of $53-421 per ton, with a central value of $125 per ton. The full set of values for 2020-2050 is provided in the separate Appendix tables.
Synopsis
All evidence suggests that the Climate Action Council responsible for developing a plan to implement the law intends to use the monetary benefits derived by multiplying the values of carbon in the Guidance document and the observed emissions to claim that the costs of their strategies to reduce emissions are outweighed by those benefits. The problem is that they will be comparing real costs today against contrived value-driven estimates of speculative impacts occurring in the far future elsewhere as I show in this post. Table 1 lists the monetary benefits for seven assumption scenarios that result in a benefits range of $668 billion to 12.6 $billion.
Table 1: Alternative New York 1990 Value of GHG Reduction Benefits ($millions)
| 1) CLCPA Value of Carbon Guidance 2% Discount & GWP-20 |
| CO2 | CH4 | N2O | PFCs | HFCs | SF6 | NF3 | Total |
| $33,100 | $373,317 | $260,758 | $113 | $6 | $501 | $0 | $667,795 |
2) CLCPA Value of Carbon Guidance 2% Discount Rate & GWP-100
| CO2 | CH4 | N2O | PFCs | HFCs | SF6 | NF3 | Total |
| $33,100 | $111,113 | $294,751 | $170 | $3 | $653 | $0 | $439,789 |
| 3) IWG 3% Discount Rate Using GWP-100 |
| CO2 | CH4 | N2O | PFCs | HFCs | SF6 | NF3 | Total |
| $14,034 | $60,988 | $125,764 | $72 | $1 | $277 | $0 | $201,136 |
| 4) Dayaratna 300 year horizon, 3% Discount Rate Using GWP-100 |
| CO2 | CH4 | N2O | PFCs | HFCs | SF6 | NF3 | Total |
| $10,007 | $33,592 | $89,109 | $51 | $1 | $197 | $0 | $132,957 |
| 5) Dayaratna 150 year horizon, 3% Discount Rate Using GWP-100 (-14.3%) |
| CO2 | CH4 | N2O | PFCs | HFCs | SF6 | NF3 | Total |
| $12,025 | $52,257 | $107,759 | $62 | $1 | $237 | $0 | $172,342 |
| 6) Dayaratna empirical ECS, 150 year horizon, 3% Discount Rate Using GWP-100 (-48%) |
| CO2 | CH4 | N2O | PFCs | HFCs | SF6 | NF3 | Total |
| $6,256 | $27,187 | $56,061 | $32 | $0 | $123 | $0 | $89,660 |
| 7) Domestic benefits, empirical ECS, 150 yr horizon, 3% Rate Using GWP-100 (-86%) |
| CO2 | CH4 | N2O | PFCs | HFCs | SF6 | NF3 | Total |
| $876 | $3,806 | $7,849 | $4 | $0 | $17 | $0 | $12,552 |
Section 1 lists the benefits (2020 social cost times 1990 emissions for each greenhouse gas. One example of narrative-driven value judgement is the global warming potential (GWP) time horizon. This parameter weighs the radiative forcing of a gas against that of carbon dioxide over a specified time frame. Most jurisdictions use a 100-year GWP time horizon but the CLCPA law mandates the use of the 20-year GWP. As a result, methane reductions associated with natural gas are valued three times higher as shown in Section 2.
The biggest driver of social costs from greenhouse gases is the discount value which is used to estimate how much money invested today would be worth in the future so that we can link today’s costs to the future. It is accepted that there is no consensus or uniform scientific basis for the selection of a discount rate. The CLCPA implementation process claims to follow the “science” but it appears that is only when it is consistent with their narrative to maximize the benefits of reductions. For example, the Obama Administration Integrated Working Group (IWG) chose a central value 3% and only published results down to 2.5% but New York chose to use 2% as the central value which results in social costs over two times larger (Section 3).
In order to consider the effect of other parameters, I calculated social benefits values based on different assumptions derived from testimony before the U.S. House of Representatives Subcommittee on Environment Committee on Oversight and Reform by Kevin D. Dayaratna. Section 4 lists his estimated benefits using the same assumptions as the IWG. I calculated the % reduction between Section 4 and each of the different assumptions and applied the resulting percentage reductions cumulatively to the Section 3 benefits.
Part of the argument for using a lower discount rate is that it helps protect our children and grandchildren but the Guidance calculates future net damages out 300 years, many generations away. Moreover, it is an act of extreme hubris to claim that any projection of how the world will operate in 100 years, much less 300 years, should be used to guide current actions simply because no one could have imagined the technology available in today’s society one hundred years ago. If the economic impacts are only considered out 150 years the social costs are reduced 14%. (Section 3 benefits times (1- 14%))
The entire rationale for the CLCPA is that there is a climate emergency threat to society because of climate change due to greenhouse gas emissions. The process does not recognize that the climate models used to predict this future are not without shortcomings. One way to minimize modeling uncertainty is to use historical data to estimate climate sensitivity to greenhouse gases and, as shown here, that can reduce impacts 48%.
New York chose to calculate world-wide benefits of reductions because climate change is a global problem. It is a fact that climate change impacts will be felt most by countries that are too poor to be resilient. However, I believe that anyone having trouble paying energy bills today would be hard pressed to accept the higher costs imposed by the CLCPA if they know that their descendants will derive little benefit from today’s sacrifices. Considering only benefits that would accrue to the United States from reductions instead of global benefits reduces the value of carbon 86%.
To sum up, greenhouse gas emission reductions under the CLCPA using the recommended assumptions are supposed to provide benefits of $668 billion. Using the Obama Administration recommended assumptions the benefits go down to $201 billion. At the extreme end of value and scientific judgements the benefits are as low as $12.5 billion.
Ultimately, the value of carbon methodology relies on a complex causal chain from carbon dioxide emissions to social impacts that are alleged to result from those emissions. Richard Tol testified that these connections are “long, complex and contingent on human decisions that are at least partly unrelated to climate policy. The social cost of carbon is, at least in part, also the social cost of underinvestment in infectious disease, the social cost of institutional failure in coastal countries, and so on.” The fact is that this process focuses exclusively on negative externalities and completely ignores the benefits of fossil fuels. I believe these facts make this a contrived process.
One final point. After all these machinations, the social cost values chosen when applied to the 1990 baseline emissions indicate that reducing those emissions will result in $668 billion in benefits. The Climate Action Council is charged with developing an implementation plan that should include costs. What happens if those costs are greater than these benefits?
Greenhouse Gas Reduction Benefits Estimates
This section describes the methodology used to calculate the values shown in Table 1.
The Climate Action Council plans to multiply the values of CO2 in the Guidance document by CO2 emissions to come up with “benefits”. Table 2, NY Social Cost of CO2 Value of Reductions ($millions), lists the recommended 2020 values for CO2, the DEC Part 496 CLCPA baseline emissions, and the total benefits for completely eliminating 1990 emissions (multiplies the Guidance values by the emissions). It shows how differences in the assumptions changes the potential benefit costs for CO2 for three different discount rates. In the absence of a recent estimate of New York CO2 emissions I used the DEC official baseline 1990 value of 264.8 million metric tons of CO2 to estimate the potential benefits. Using the 2020 value of carbon dioxide of $53-421 per ton, with a central value of $125 per ton and the 1990 emissions the benefits of eliminating those emissions ranges between $111.5 billion and $14.0 billion with a central value of $33.1 billion.
Table 2: Recommended NY Social Cost of CO2 Value of Reductions ($millions)
| 2020 Value of Greenhouse Gas Reductions |
| Discount | CO2 | CH4 | N2O | PFCs | HFCs | SF6 | NF3 |
| 1% | $421 | $6,578 | $140,766 | $421 | $421 | $421 | $421 |
| 2% | $125 | $2,782 | $44,727 | $125 | $125 | $125 | $125 |
| 3% | $53 | $1,527 | $19,084 | $53 | $53 | $53 | $53 |
| 1990 Statewide Greenhouse Gas Emissions (million metric tonnes) |
| GWP | CO2 | CH4 | N2O | PFCs | HFCs | SF6 | NF3 |
| GWP20 | 264.8 | 134.19 | 5.83 | 0.9 | 0.05 | 4.01 | 0 |
| GWP100 | 264.8 | 39.94 | 6.59 | 1.36 | 0.02 | 5.22 | 0 |
| Recommended Value of Carbon Benefits (millions) |
| Discount | CO2 | CH4 | N2O | PFCs | HFCs | SF6 | NF3 | Total |
| 2% | $33,100 | $373,317 | $260,758 | $113 | $6 | $501 | $0 | $667,795 |
The first, and arguably, the biggest judgement that has to be made when the values are developed is the economic discount rate. According to the Guidance document “Discounting is a common and useful aspect of economic analyses that allows for the balancing of present versus future value and it has been widely discussed in the literature, particularly in its application to the federal social cost of carbon. However, the selection of the discount rate has a large effect on the estimate of the value of carbon, and there is no consensus or uniform scientific basis for the selection of a discount rate.” I emphasized the key point that there is no consensus for selecting the discount rate chosen. The discount price chosen boils down to value judgements on the part of the State and the model developers.
During the January 19, 2021 Climate Action Council meeting, Jared Snyder, New York Department of Environmental Conservation Deputy Commissioner for Air Resources, Climate Change, & Energy, described the NY Value of Carbon Guidance and talked about the discount rate choices. I tried to transcribe his comments but did edit out superfluous wording. He stated that: “We proposed central values of 2 or 2.5% for public comment. The Obama Administration did use 3% but a number of economists have indicated their views that 3% is somewhat too high and recommended looking at and establishing a value of carbon based on lower values.” A key point is that the Integrated Working Group did a more thorough analysis of the discount rates and chose a central value that was not even proposed for comment. The Guidance 2% value is $72 more per ton and results in increased benefits of over $19 billion compared to the IWG 3% value. In my opinion the Guidance did not adequately justify their choice to deviate from the IWG expert analysis.
Snyder went on to say that based on information from various economists, “we moved towards the 2% range based on a view that impacts that occur significantly in the future that impact our children, grandchildren and the like, are still important and we did not want to discount those too much.” He concluded “Informed by the economists and that value judgement we decided that 2% is an appropriate value”. Snyder states that the discount rate values “impacts in the future versus impacts now”. An alternative explanation is that the discount rate is used to estimate how much money invested today would be worth in the future so that we can link today’s costs to the future. Snyder’s response is disingenuous because while it may be appropriate to value impacts today similar to impacts tomorrow for our children and grandchildren, the SCC valuation process considers impacts out to 2300. According to the internet there are 25.2 years in a generation which means that benefits are being calculated for twelve generations, not exactly our children and grand-children.
There are two other aspects of the CLCPA law that directly affect the social costs. In addition to CO2, the CLCPA mandates that other greenhouse gases should also be addressed: methane (CH4), nitrous oxide (N2O), hydrofluorocarbons, perfluorocarbons, sulfur hexafluoride (SF6). According to the Guidance document, Global Warming Potential (GWP) weighs the radiative forcing of a gas against that of carbon dioxide over a specified time frame. Contrary to every other jurisdiction the CLCPA mandates that the specified time frame is 20 years, while everyone else uses 100 years. EPA notes in Understanding Global Warming Potentials that the ”20-year GWP prioritizes gases with shorter lifetimes, because it does not consider impacts that happen more than 20 years after the emissions occur”.
In order to consider the impacts of other greenhouse gases relative to CO2, the concept of equivalency is used. Carbon dioxide equivalence is “a simple way to normalize all these greenhouse gases and other climate influences in standard units based on the radiative forcing of a unit of carbon dioxide over a specified timeframe (generally set at 100 years)”. The Guidance document found sufficient information to develop social cost values for methane and nitrous oxides so those numbers are used directly. The CO2 equivalents are used in the subsequent analysis for hydrofluorocarbons, perfluorocarbons, sulfur hexafluoride (SF6), and nitrogen trifluoride (NF3), which was included in the Part 496 inventory despite the fact that the numbers are listed as zeros.
Table 3 lists the values of carbon that New York included in the Guidance document, GWP-20 and GWP-100 for 1%, 2% and 3% discount rates. The recommended central value benefits are $668 billion and the range of benefits goes from $201 billion to $1.86 trillion for all the greenhouse gases in the CLCPA. Note that methane benefits are more than half of the total and an order of magnitude greater than the CO2 benefits. Using the 20-year GWP increases the benefits three times the 100-year GWP benefits. Nitrous oxide benefits are over seven times greater than carbon dioxide benefits.
| Table 3: NY Social Cost of CO2 Value of Reductions ($millions) | |||
| CLCPA Social Cost Requirements – Value of Carbon Guidance Recommendations |
| 2020 Value of Greenhouse Gas Reductions |
| Discount | CO2 | CH4 | N2O | PFCs | HFCs | SF6 | NF3 |
| 1% | $421 | $6,578 | $140,766 | $421 | $421 | $421 | $421 |
| 2% | $125 | $2,782 | $44,727 | $125 | $125 | $125 | $125 |
| 3% | $53 | $1,527 | $19,084 | $53 | $53 | $53 | $53 |
| 1990 Statewide Greenhouse Gas Emissions (million metric tonnes) |
| GWP | CO2 | CH4 | N2O | PFCs | HFCs | SF6 | NF3 |
| GWP20 | 264.8 | 134.19 | 5.83 | 0.9 | 0.05 | 4.01 | 0 |
| GWP100 | 264.8 | 39.94 | 6.59 | 1.36 | 0.02 | 5.22 | 0 |
| D.R. | GWP | CO2 | CH4 | N2O | PFCs | HFCs | SF6 | NF3 | Total |
| 1% | GWP20 | $111,481 | $882,702 | $820,666 | $379 | $21 | $1,688 | $0 | $1,816,937 |
| 2% | GWP20 | $33,100 | $373,317 | $260,758 | $113 | $6 | $501 | $0 | $667,795 |
| 3% | GWP20 | $14,034 | $204,908 | $111,260 | $48 | $3 | $213 | $0 | $330,465 |
| 1% | GWP100 | $111,481 | $262,725 | $927,648 | $573 | $8 | $2,198 | $0 | $1,304,633 |
| 2% | GWP100 | $33,100 | $111,113 | $294,751 | $170 | $3 | $653 | $0 | $439,789 |
| 3% | GWP100 | $14,034 | $60,988 | $125,764 | $72 | $1 | $277 | $0 | $201,136 |
Table 1, Alternative New York 1990 Value of GHG Reduction Benefits ($millions), lists seven scenarios that compare the reduction benefits as a function of different assumptions and value judgements. The first section, CLCPA Value of Carbon Guidance 2% Discount & GWP-20, reproduces the recommended benefits from Table 2. The second section, CLCPA Value of Carbon Guidance 2% Discount Rate & GWP-100, compares the differences in benefits when using the 100-year GWP commonly used. Total benefits drop from $668 billion to $440 billion. Using the IWG approach, 3% discount rate and 100-year GWP, the total benefits drop to $201 billion. The only values I have for the IWG approach are for CO2. To calculate the remaining gases, I made the crude assumption that their social costs would be proportional to the change in social costs of CO2 using values from the second section.
In the remaining analyses I calculate social benefits values based on different assumptions derived from testimony before the U.S. House of Representatives Subcommittee on Environment Committee on Oversight and Reform on September 24, 2020, by Kevin D. Dayaratna. He used one of the primary integrated assessment models (DICE) used by the IWG to calculate SC-CO2 to calculate the social costs for different scenarios. My derived values are rough estimates and I applied the reductions in each analysis to accumulate the impacts. In order to refine the numbers, it is necessary to run multiple models thousands of times and that is way beyond my capabilities.
In the section of Table 1 labeled Dayaratna 300 year horizon, 3% Discount Rate Using GWP-100 (-70%) I list the his values for comparison to the IWG values in the third section. There is the same issue for the other gases as described for the IWG section and I applied the same approach.
Recall that Snyder justified the 2% discount rate “based on a view that impacts that occur significantly in the future that impact our children, grandchildren and the like, are still important and we did not want to discount those too much.” Note however, that the economic modeling calculates cost impacts 300 years out. But because the impacts of climate change will become more evident further in the future the benefits of reductions today will be much more of a factor closer to 2300. Dayaratna estimated the effect of the time horizon calculating the social costs out 150 years instead of the 300-year time horizon and found that assumption reduces societal benefits by 14%.
The effect of greenhouse gases on climate is a fundamental driver of the impacts and is another factor affecting the social cost estimates. Equilibrium climate sensitivity (ECS) is the expected change in temperature when the atmospheric CO2 concentration doubles. The IWG analysis depended upon outdated, model-derived ECS values. In his testimony before the Environment Committee on Oversight and Reform on September 24, 2020, Dayaratna also estimated the effect of the ECS on the SC-CO2. In section 6, he used an ECS estimate based on observed data and found that the benefits would be reduced 48%.
Snyder’s presentation also noted that the benefits were calculated on a global basis because it is a global problem. This is another value judgement and the public should be aware of the effect on the benefit values. In 2017, President Trump signed Executive Order 13783 and Federal projects used social cost estimates based on the same approach as the IWG but differed in two aspects: the only damages that were considered were those in the United States and different values were used to convert to present costs. A recent GAO report show that changing just those two variables results in very different damage estimates. I estimate that would reduce benefits another 86%.
By using different value judgements and a different ECS value the $668 billion in societal benefits from greenhouse gas reductions under the CLCPA are reduced to $12.5 billion in benefits.
CO2 Methodology
For the summary analysis I considered all the greenhouse gases but that necessitates the crude assumption that their social costs would be proportional to the change in social costs of CO2. This section provides a more-detailed description of my CO2 calculation methodology and the discussion of value of carbon cost effectiveness at the January 19, 2021 Climate Action Council meeting. I suggest that this section is best used as a stand-alone reference to the previous text.
The Climate Action Council plans to multiply the values of carbon in the Guidance document by the greenhouse gas emissions to come up with “benefits”. Table 4, NY Climate Social Cost of CO2 Value of Reductions ($millions), shows how differences in the assumptions changes the negative externality costs for CO2. In the absence of a recent estimate of New York CO2 emissions I will use the DEC official baseline 1990 value of 264.8 million metric tons of CO2 to estimate the potential benefits. The benefits are simply the 1990 emissions multiplied by the values of CO2.
| Table 4: NY Social Cost of CO2 Value of Reductions ($millions) | ||||
| DEC Value of Carbon Guidance | ||||
| 1990 NY CO2 Emissions (million metric tonnes) |
| 264.8 | Per DEC Part 496 | |
| Discount | Value | Benefit of Reductions |
| 1% | $421 | $111,481 |
| 2% | $125 | $33,100 |
| 3% | $53 | $14,034 |
According to the Guidance document “Discounting is a common and useful aspect of economic analyses that allows for the balancing of present versus future value and it has been widely discussed in the literature, particularly in its application to the federal social cost of carbon. However, the selection of the discount rate has a large effect on the estimate of the value of carbon, and there is no consensus or uniform scientific basis for the selection of a discount rate.” I emphasized the key point that there is no consensus for selecting the discount rate chosen. The price chosen boils down to value judgements on the part of the State.
During the January 19, 2021 Climate Action Council meeting, at 1:23:30 in the video of the meeting Jared Snyder, New York Department of Environmental Conservation Deputy Commissioner for Air Resources, Climate Change, & Energy, described the NY Value of Carbon Guidance. Snyder explained that “one of the key issues in establishing the value of carbon is establishing a discount rate”. He went on to say that refers to: ”How do you value impacts in the future versus impacts now?”. He claimed that if you value impacts now the same as impacts in the future you would apply a discount rate of zero. He noted that in the past experts have looked at discounts in a range of 2% to 5% which values current impacts more than future impacts. He explained that the Guidance considered a range of discount rates, including zero. It recommends a central value of 2% ($125 per ton of CO2 in 2020 dollars) with an evaluation range of 1% to 3% ($421 –$53 per ton of CO2 in 2020. As shown in Table 1 that translates into total benefits due to New York CO2 reductions of $33.1 billion at the central value with an evaluation range of $111.5 billion to $14.0 billion.
After Snyder’s presentation, Council member Bob Howarth asked for the justification of the choice of the discount value especially because the CLCPA mandates evaluation of a zero discount rate. I tried to transcribe the response made by Snyder to this question but did edit out superfluous wording. He stated that: “We proposed central values of 2 or 2.5% for public comment. The Obama Administration did use 3% but a number of economists have indicated their views that 3% is somewhat too high and recommended looking at and establishing a value of carbon based on lower values.” He went on to say that based on information from various economists, “we moved towards the 2% range based on a view that impacts that occur significantly in the future that impact our children, grandchildren and the like, are still important and we did not want to discount those too much.” He concluded “Informed by the economists and that value judgement we decided that 2% is an appropriate value”.
Snyder’s response does not give all the details. Snyder states that the discount rate values “impacts in the future versus impacts now”. An alternative explanation is that the discount rate is used to estimate how much money invested today would be worth in the future so that we can link today’s costs to the future. Snyder states that the Obama Administration recommended a central value estimate of 3%. The Guidance and supporting Memo discuss the discount rate and address some of the controversies associated with choosing a value. The Guidance notes that “The federal IWG’s central value applies a 3 percent discount rate that is consistent with the economics literature and in the federal government’s Circular A-4 guidance for the consumption rate of interest” Neither mention that Circular A-4 guidelines state that all cost/benefit analyses are to be scored using both a 3% and a 7% discount rate. Both the IWG and the Guidance document used their values to choose the rates used.
There are two other aspects of the CLCPA law that directly affect the social costs. In addition to CO2, the CLCPA mandates that other greenhouse gases should also be addressed: methane (CH4), nitrous oxide (N2O), hydrofluorocarbons, perfluorocarbons, sulfur hexafluoride (SF6). According to the Guidance document, Global Warming Potential (GWP) weighs the radiative forcing of a gas against that of carbon dioxide over a specified time frame. Contrary to every other jurisdiction the CLCPA mandates that the specified time frame is 20 years, while everyone else uses 100 years.
In order to consider the impacts of other greenhouse gases relative to CO2, the concept of equivalency is used. Carbon dioxide equivalence is “a simple way to normalize all these greenhouse gases and other climate influences in standard units based on the radiative forcing of a unit of carbon dioxide over a specified timeframe (generally set at 100 years)”. The Guidance document found sufficient information to develop social cost values for methane and nitrous oxides so those numbers are used directly. The CO2 equivalents are used in the subsequent analysis for hydrofluorocarbons, perfluorocarbons, sulfur hexafluoride (SF6), and nitrogen trifluoride (NF3) which was included in the Part 496 inventory despite the fact that the numbers are listed as zeros. In testimony before the U.S. House of Representatives Subcommittee on Environment Committee on Oversight and Reform on September 24, 2020, Kevin D. Dayaratna estimated the effect of a wider range of discount rates. He used one of the primary integrated assessment models (DICE) used by the IWG to calculate SC-CO2 to calculate the social costs for different scenarios. As shown in Table 5 the range of total benefits based on different discount rates ranges by an order of magnitude from $1.5 billion to $15 billion.
| Table 5: NY Social Cost of CO2 Value of Reductions ($millions) | ||||
| DICE Model Average SCC End Year 2300 | ||||
| 1990 NY CO2 Emissions (million metric tonnes) |
| Discount | Value | Benefit of Reductions |
| 2.5% | $56.92 | $15,072 |
| 3.0% | $37.79 | $10,007 |
| 5.0% | $12.10 | $3,204 |
| 7.0% | $5.87 | $1,554 |
Snyder said that based on information from various economists, “we moved towards the 2% range based on a view that impacts that occur significantly in the future that impact our children, grandchildren and the like, are still important and we did not want to discount those too much.” The fact is that the in order to justify using a low discount rate people have to know that the Guidance methodology calculated cost impacts 300 years out and according to the internet there are 25.2 years in a generation which means that benefits are being calculated for twelve generations, not exactly our children and grand-children. Proponents argue that because most of the warming caused by carbon dioxide emissions persists for many years, changes in carbon dioxide emissions today may affect economic outcomes for centuries to come. This is described as leaving the world a better place for our grand-children. But because the impacts of climate change will become more evident further in the future the benefits of reductions today will not be a factor until further in the future. Dayaratna estimated the effect of the time horizon calculating the social costs out 150 years instead of the 300-year time horizon. Table 6 compares the time horizons using the same discount rates and shows that he found that using a 2.5% discount rate the 150 year time horizon total benefits would drop by 22% but at a 7% discount rate they only drop 0.3%.
| Table 6: NY Social Cost of CO2 Value of Reductions ($millions) | ||||
| Comaparison of 300 Year and 150 Year Estimates | ||||
| 1990 NY CO2 Emissions (million metric tonnes) |
| 264.8 | Per DEC Part 496 |
| DICE Model Average SCC End Year 2300 |
| Discount | Value | Benefit of Reductions |
| 2.5% | $56.92 | $15,072 |
| 3.0% | $37.79 | $10,007 |
| 5.0% | $12.10 | $3,204 |
| 7.0% | $5.87 | $1,554 |
| DICE Model Average SCC – End Year 2150 |
| Discount | Value | Benefit of Reductions |
| 2.5% | $44.41 | $11,760 |
| 3.0% | $32.38 | $8,574 |
| 5.0% | $11.85 | $3,138 |
| 7.0% | $5.85 | $1,549 |
Snyder’s presentation also noted that the benefits were calculated on a global basis because it is a global problem. This is a value judgement and in the interest of full disclosure the effects should be noted. In 2017, President Trump signed Executive Order 13783 which, among other actions, disbanded the IWG and stated that the estimates generated by the Interagency Working Group were not representative of government policy. Federal projects used social cost estimates based on the same approach as the IWG but differed in two aspects: the only damages that were considered were those in the United States and different values were used to convert to present costs. A recent GAO report show that changing just those two variables results in very different damage estimates. As shown in Table 7, at the common 3% discount rate, the prior federal estimate a was $50 but the current federal estimate is only $7. The value of the reductions goes down from $13.2 billion to $1.9 billion.
| Table 7: NY Social Cost of CO2 Value of Reductions ($millions) |
| Global vs Domestic Damages at 3% Discount Rate |
| Impacts | Value | Benefit of Reductions |
| Global | $50.00 | $13,240 |
| Domestic | $7.00 | $1,854 |
The effect of greenhouse gases on climate is a fundamental driver of the impacts and is another factor affecting the social cost estimates. Equilibrium climate sensitivity (ECS) is the expected change in temperature when the atmospheric CO2 concentration doubles. The IWG analysis depended upon outdated, model-derived ECS values. In his testimony before the Environment Committee on Oversight and Reform on September 24, 2020, Dayaratna also estimated the effect of the ECS on the SC-CO2. Table 8 shows using the Lewis and Curry 2015 ECS values (based on monitoring and not modeling) that in 2020 for a discount rate of 2.5%, the SC-CO2 is reduced 49% using a 300-year time horizon and that the reduction decreases for future estimates. Using those values, the benefits of the reductions goes from $15.1 billion down to $7.7 billion at the 2.5% discount rate.
| Table 8: NY Social Cost of CO2 Value of Reductions ($millions) |
| DICE Model Average SCC – ECS Distribution Updated in |
| Lewis and Curry (2015), End Year 2300 | ||
| Discount | Value | Benefit of Reductions |
| 2.5% | $28.92 | $7,658 |
| 3.0% | $19.66 | $5,206 |
| 5.0% | $6.86 | $1,817 |
| 7.0% | $3.57 | $945 |
| DICE Model Average SCC End Year 2300 | ||
| Discount | Value | Benefit of Reductions |
| 2.5% | $56.92 | $15,072 |
| 3.0% | $37.79 | $10,007 |
| 5.0% | $12.10 | $3,204 |
| 7.0% | $5.87 | $1,554 |
