

New York’s Climate Leadership and Community Protection Act (Climate Act) has a legal mandate for New York State greenhouse gas emissions to meet the ambitious net-zero goal by 2050. The Climate Action Council has released for public comment the Draft Scoping Plan that outlines the implementation plan for the Climate Act. The document is huge as it covers all aspects of New York’s energy system. This post looks at one minor component of the Scoping Plan’s mitigation scenarios to determine if the numbers presented are reasonable.
I have written extensively on implementation of the Climate Act because I believe the ambitions for a zero-emissions economy outstrip available technology such that it will adversely affect reliability and affordability, risk safety, affect lifestyles, will have worse impacts on the environment than the purported effects of climate change in New York, and cannot measurably affect global warming when implemented. The opinions expressed in this post do not reflect the position of any of my previous employers or any other company I have been associated with, these comments are mine alone.
Climate Act Background
The Climate Act establishes a “Net Zero” target by 2050. The Climate Act requires the Climate Action Council to “[e]valuate, using the best available economic models, emission estimation techniques and other scientific methods, the total potential costs and potential economic and non-economic benefits of the plan for reducing greenhouse gases, and make such evaluation publicly available” in the Scoping Plan. The Integration Analysis developed by the New York State Energy Research and Development Authority (NYSERDA) and its consultants was used to develop the Draft Scoping Plan that was released for public comment on December 30, 2021.
The Integration Analysis developed four scenarios to compare with a reference case that describes the New York energy system without the Climate Act. The first scenario is based on Advisory Panel inputs but did not meet the Climate Act targets. According to Appendix G, Integration Analysis Technical Supplement, Section I, page 13:
Transformative levels of effort are required across all sectors, and scenarios include high levels of electrification including Scenario 2, which also incorporates strategic use of low-carbon fuels. Scenario 3 pushes harder on accelerated electrification to meet the emission limits using a very low-bioenergy and low-combustion mix of strategies. Scenario 4 pushes beyond 85% direct reductions in 2050 by including use of some low-carbon fuels, examining very high VMT reductions, and assuming high (but also highly uncertain) levels of innovation in the waste and agriculture sectors. The Council expressly seeks feedback on the components of these scenarios of which detailed information can be found in the sector strategies portions of the sectoral chapters in this draft Plan.
This article describes only one component of the strategies. Make no mistake there is so much information presented and the documentation is so marginal that it is impossible to evaluate all the components in any detail. For this article I am going to address one aspect of the transportation sector plan. The addendum to this article consolidates relevant information in Appendix G, Integration Analysis Technical Supplement, Transportation in Section I starting on page 35 where the components of the transportation sector scenarios are described.
Transportation Component Comment
The mitigation scenarios reduce transportation emission by reducing the miles traveled by vehicles, adoption of zero-emission vehicles, electrification of non-road sectors, and targeted low-carbon fuel use. Reducing energy consumption means that GHG emissions are reduced within the transportation sector.
When I evaluate a regulatory proposal my first step is to try to reproduce the proposal’s numbers so that I can verify that the assumptions used are reasonable. Even though I limited myself to just the transportation sector there still are far too many aspects to consider them all. The scenarios proposed to reduce vehicle miles traveled using smart growth, expanded public transit, telework and demand management programs but all of those strategies are broader than I want to deal with at this time. I considered discussing the suggestion that there could be a “small role for electric aviation in decarbonizing short distance flights by 2050, and hydrogen aviation to decarbonize medium distance flights”. The claim that “hydrogen and electric aviation displace 47% of remaining aviation fuel demand in Scenario 4” sets off my BS detector but I chose instead to use a different claim in this article to see if the numbers can be trusted.
In this example I will address the enhanced transit & mobility claims related to the Scenario 4 alternative “Incremental reductions from enhanced in-state rail aligning with 125 MPH alternative detailed in Empire Corridor Tier 1 Draft EIS”. In particular, I am only going to address the rail improvements measure shown in Table 11 of Appendix G: 200 million light duty vehicle miles can be reduced relative to Scenarios 2 and 3 at a per unit cost of $6 per mile.

57 Moving Cooler: http://www.reconnectingamerica.org/assets/Uploads/2009movingcoolerexecsumandappend.pdf, accessed November 2021
Empire Corridor Draft 1 Tier EIS: https://railroads.dot.gov/environment/environmental-reviews/empire-corridor, accessed November 2021
EU Hydrogen Aviation Study:
https://www.fch.europa.eu/sites/default/files/FCH%20Docs/20200720_Hydrogen%20Powered%20Aviation%20report_FINAL%20web.pdf, accessed November 2021
58 Scenario 2 and Scenario 3 include 9 billion LDV miles reduced in 2050 relative to Reference scenario, from enhanced transit and mobility; telework and travel demand management; smart growth and mode shifting to biking/walking; No $/mile cost was assessed for tranche of VMT reduction achieved in Scenarios 2-3. Table above shows incremental investment relative to Scenarios 2-3
Table 11 documents transportation-related incremental costs associated with Scenario 4. It claims that the per-unit cost is $6 per mile and that 200 million light duty vehicle miles will be reduced relative to Scenarios 2 and 3 in 2050. The plain reading of this is that the 200 hundred million light duty vehicles miles reduced will cost $6 per mile or $1.2 billion. The basis of the claim is the “Empire Corridor Draft 1 Tier EIS” which is an analysis of improvements that could be made to railroad passenger service in New York.
Empire Corridor Rail Passenger Improvements
The Federal Railroad Administration (FRA), in cooperation with the New York State Department of Transportation (NYSDOT) completed the Empire Corridor Environmental Impact Statement (EIS) in 2014 to “evaluate proposed system improvements to intercity passenger rail services along the 463-mile Empire Corridor, connecting Pennsylvania (Penn) Station in New York City with Niagara Falls Station in Niagara Falls, New York.” The components of the EIS include the following:
- Empire Corridor Tier 1 DEIS – Volume 1
- Appendix A – Volume 2
- Appendices B-H – Volume 3
- Appendices I-J – Volume 4
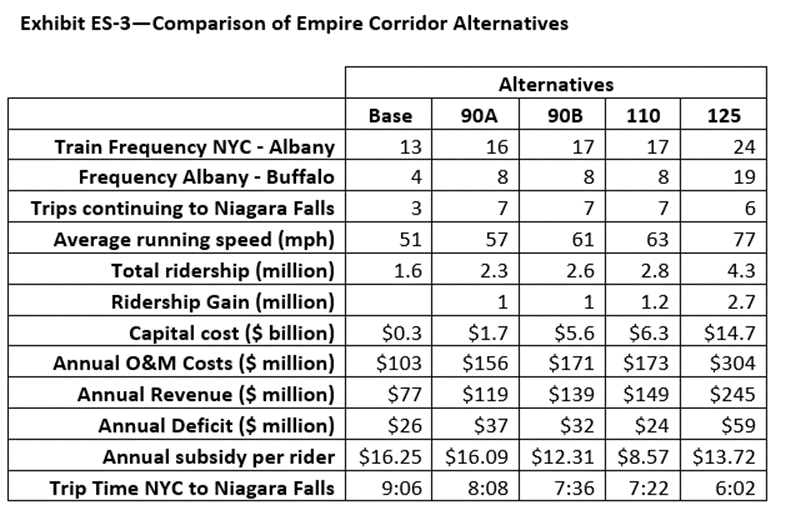
Completing an EIS always takes a long time but the fact that the FRA anticipates publishing the final report in 2022, eight years after it was completed suggests that there were issues. For this evaluation the point is that there were four alternatives considered to upgrade railroad service from New York City to Niagara Falls. There were two alternatives to raise passenger train speeds to 90 mph between Albany and Buffalo and one to raise passenger train speeds to 110 mph that all use the existing right-of-way. The fourth alternative would raise the passenger train speeds to 125 mph but that would require the development of a “new electrified (with overhead catenary), two-track, grade-separated high-speed rail corridor of 283 miles between Albany/Rensselaer Station and a new Buffalo station”. The following table highlights the differences between the alternatives.
According to Appendix G, Scenario 4 would get additional vehicle miles traveled reductions by using the “125 MPH alternative detailed in Empire Corridor Tier 1 Draft EIS”. As this document is the sum total of the documentation a certain degree of guessing is required to deduce what that means. Although never mentioned it seems likely that Scenarios 2 and 3 use Alternative 110 from the Empire Corridor EIS to project reductions in vehicle miles traveled and using the “125 MPH alternative detailed in Empire Corridor Tier 1 Draft EIS” appears to provide incremental improvements.
It is possible to check the projected numbers. Table 11 claims that “200 million light duty vehicle miles will be reduced relative to Scenarios 2 and 3 in 2050” at a per unit cost of $6 per mile. Recall, however, that I previously interpreted this to mean that the 200 hundred million light duty vehicles miles reduced will cost $6 per mile or $1.2 billion. The capital cost difference between Alternative 110 ($6.3 billion) and Alternative 125 ($14.7 billion) is $8.4 billion, far more than that per unit cost.
There is another possible check. Exhibit 6-7 in the Empire Corridor EIS estimates the annual reductions in auto trips in 2035 for the different alternatives. Assuming that using the “125 MPH alternative detailed in Empire Corridor Tier 1 Draft EIS” means that the proposed improvement is the difference between the 110 and 125 alternatives, then that means that 307,475 autos are diverted from highways.

In order to estimate the vehicle miles traveled reduction from the estimate of 307,475 autos diverted from highways, the distribution of where the passenger boarded and exited is needed. Exhibit 2-21 provides that information for 2009. I have an issue with these data. In particular, while the total appears consistent with the numbers in the rest of the document it is worrisome that the origin and destination numbers match exactly. I interpret this table to state that 320,155 people boarded trains in New York to go to Albany reading down the first column to New York City then across to the third column under the heading Albany. For the people going from Albany to New York City read down the trip origins column to Albany and then over to the second column for New York City. I believe it is highly unlikely that exact number of people going from Albany to New York City and vice-versa would be identical. Furthermore, the fact that the station pairs in all instances are the same means that there is an issue with the numbers. Because I don’t expect that there would be a big difference between the numbers and the total is consistent, I have ignored this issue.

Unfortunately, there is no similar breakdown of boardings for the alternatives. Exhibit 6-6 does break down total ridership by alternative in 2035.

My spreadsheet Empire Corridor Data uses the information from these three tables and the distances between the stations listed along the Empire Corridor (Markets tab) to estimate the vehicle mile traveled reduction expected in 2035 if the 125-mph alternative is implemented rather than the 110-mph alternative. I assume that the relative ridership between stations remains the same as that shown in Exhibit 2-21 and that the diversion from highways estimates are proportional to the passenger boardings. The difference in auto trips diverted from highways between the 110-mph alternative (177,603) and the 125-mph alternative (485,078) is 307,475. The number of diverted auto trips for each station is proportional to the station boardings per station in 2009 multiplied by 307,475 divided by the total number of boardings in 2009 (932,801). The vehicle mile traveled reduction is the number of trips per station pair times the distance per station pair. The sum of the distances for all these diverted trips is 64.7 million miles in 2035. The Table 11 projected number of light-duty vehicle miles traveled is 200 million miles in 2050. Even though the dates are different I think it is clear that the numbers, and therefore the methodology, are incompatible.
There are a couple of ways to interpret these discrepancies. It could simply be that my interpretation of the Scoping Plan total costs and mileage reductions for this strategy are incorrect. On the other hand, I think it is more likely due to a methodology difference. Due to the lack of documentation, it is impossible to determine how the Integration Analysis estimated the costs and mileages. I suspect, but cannot prove, that the Integration Analysis assumed some sort of a relationship between railroad passenger investments and vehicle mile reductions based on the results of the Empire Corridor EIS. Unfortunately, the existence of a relationship does not mean that you can estimate benefits for anything other than the total costs of the alternative. The cost difference between the 110-mph alternative and the 125-mph alternative is $6.3 billion and diverts 307,475 auto trips away from the roads to the trains. It is not appropriate, for example, to assume that an investment of $3 billion would divert half as many trips but I think that something along those lines was done.
Conclusion
Without herculean effort by many people over a long period it is impossible to evaluate all the cost-benefit claims in the Draft Scoping Plan. It is not only that there are many components to the New York energy system but the lack of documentation means that a large part of the analysis is trying to guess how the numbers were generated. The only alternative is to evaluate a few discrete components and to see if the estimates are reasonable.
This analysis evaluated the transportation sector vehicle miles traveled difference between Scenarios 2 and 3 relative to Scenario 4. The Draft Scoping Plan claims that “Incremental reductions from enhanced in-state rail aligning with 125 MPH alternative detailed in Empire Corridor Tier 1 Draft EIS” will provide a reduction of 200 million light duty vehicle miles at a per unit cost of $6 per mile or $1.2 billion. I estimate that the only valid cost for the difference between the rail alternatives is $8.4 billion and that it would only provide a reduction of 64.7 million miles. While my estimate is for 2035, consistent with the Empire Corridor evaluation, and the Draft Scoping Plan is for 2050, I don’t think there is any question that the numbers are inconsistent.
Every time I have dug into the numbers, for example residential heating retrofit electrification, the Draft Scoping Plans numbers are not a reasonable estimate compared to my work. I have consistently found that the Scoping Plan costs estimates are biased high and the benefits proposed are biased low. I conclude that there is little reason to trust the cost estimates in the Draft Scoping Plan because of the issues I have found.
All indications at the March 3, 2022 Climate Action Council meeting were that the plan for public involvement will simply going through the motions. For example, there is no provision for the kind of discrepancy documented here to be reconciled as a result of public comments. This example is trivial and has no major bearing on Climate Act implementation. The terrifying prospect is that the issues associated with reliability raised at last summer’s Reliability Planning Speaker Session could possibly be treated the same, that is to say ignored. Those issues must be addressed or the result could lead to people freezing to death in the dark.
