

The Regional Greenhouse Gas Initiative (RGGI) is a market-based program to reduce emissions from electric generating units. One aspect of RGGI is a regular review of the program status and need for adjustments. This article describes my latest comments on the Third Program Review process.
I have been involved in the RGGI program process since its inception. I blog about the details of the RGGI program because very few seem to want to provide any criticisms of the program. I submitted comments on the Climate Act implementation plan and have written over 450 articles about New York’s net-zero transition because I believe the ambitions for a zero-emissions economy embodied in the Climate Act outstrip available renewable technology such that the net-zero transition will do more harm than good. The opinions expressed in this post do not reflect the position of any of my previous employers or any other organization I have been associated with, these comments are mine alone.
Background
RGGI is a market-based program to reduce greenhouse gas emissions (GHG) (Factsheet). It has been a cooperative effort among the states of Connecticut, Delaware, Maine, Maryland, Massachusetts, New Hampshire, New York, Rhode Island, and Vermont to cap and reduce CO2 emissions from the power sector since 2008. New Jersey was in at the beginning, dropped out for years, and re-joined in 2020. Virginia joined in 2021 but has since withdrawn, and Pennsylvania has joined but is not actively participating in auctions due to on-going litigation. According to a RGGI website:
The RGGI states issue CO2 allowances that are distributed almost entirely through regional auctions, resulting in proceeds for reinvestment in strategic energy and consumer programs.
Proceeds were invested in programs including energy efficiency, clean and renewable energy, beneficial electrification, greenhouse gas abatement and climate change adaptation, and direct bill assistance. Energy efficiency continued to receive the largest share of investments.
The RGGI States regularly review successes, impacts, and design elements of the program. This is the third iteration of the review program. It started in February 2021 and there is no schedule for its completion. The description states:
To support the Third Program Review, the states will:
- Conduct technical analyses, including electricity sector modeling, to inform decision-making related to core Program Review topics, such as the regional CO2 emission cap.
- Solicit input from communities, affected groups, and the general public on the Program Review process and timeline, core topics and objectives, modeling assumptions and results, and other policy and design considerations.
- Convene independent learning sessions with experts and other interested parties on key design elements.
I have previously posted an article describing my earlier comments to RGGI addressing the disconnect between the results of RGGI to date relative to the expectations in the RGGI Third Program Review modeling. I have also described other comments submitted to RGGI.
The overarching problem with GHG emission market-based programs is that carbon dioxide emissions are directly tied to fossil-fuel combustion and energy production. If for any number of reasons, the zero-emissions are not deployed fast enough there won’t be enough credits within the cap available to cover the emissions necessary to provide the energy needs. In the worst case, an electric generating unit needed to keep the lights on will refuse to operate because they have insufficient allowances. I do not think that this program review pays sufficient attention to this problem.
The Program Review Update describes the September 23, 2024 update. There are two distinct components to this update: the release of another modeling scenario and a request for suggestions on how to accommodate other states without upsetting the “environmental ambition” of the states currently participating in RGGI.
IPM Emission Modeling Comments
The basis of the RGGI state program review proposal is modeling done by ICF using the Integrated Planning Model (IPM). There is not much documentation for the IPM analysis. The Program Review Update is the only documentation and that consists of “informational slides”. The “detailed modeling results” are presented in a spreadsheet that does not include a table with explanations of the data provided. Even though I have reviewed every previous iteration of RGGI IPM modeling results, I had to spend a lot of time trying to decipher what they were doing. If someone decided to review the modeling analysis without any experience, they would have a very hard time trying to figure out what is going on. I do not think this lack of documentation is appropriate.
The presentation slides note that “The RGGI states have conducted modeling analysis of an additional exploratory policy scenario”. In this type of analysis, the policy scenario results are compared to a base case or business as usual scenario. Two cap scenarios were modeled:
- Flat Cap Scenario consistent with current program design
- Exploratory Policy Scenario with an increased reserve price, declining cap to 2037 and a new two-tier CCR.
Results from two cases of the “Exploratory Policy Scenario” are presented in the spreadsheet. Case A includes “currently contracted renewables only” and Case B includes “on-the-books policies and mandates”. The Flat Cap Scenario includes on-the-book policies and mandates and the exploratory scenario projects what would happen with the policy changes. The documentation also notes that renewable cost data has been updated to align with NREL’s 2024 release of the Annual Technology Baseline dataset. I believe that the updated data were different enough that it was appropriate to do a new current program design base case, i.e., the Flat Cap Scenario.
I have reservations about the analysis because the IPM projected emissions in 2028 are not credible. Table 1 lists the observed EPA Clean Air Markets Division annual CO2 emissions for the last three years and the Integrated Planning Model (IPM) projected 2028 emissions for the three modeling scenarios from the results spreadsheet. IPM projects an overall reduction of more than 50% in four years for Case A I believe that the analysis over-estimates potential CO2 reductions in the ten RGGI states. Reductions in this time frame can only occur when wind and solar resources displace the RGGI source generation. My first impression is that it is unlikely that enough wind and solar can be built in that time frame.
Table 1: Comparison of Observed RGGI CO2 Emissions and IPM Projected Emissions (million tons)
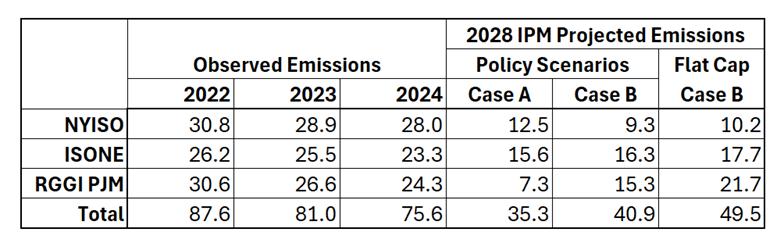
Modeling scenario Case A includes “currently contracted renewables only and Case B, used in the Flat case, includes “on-the-books policies and mandates”. I do not believe that the modeling addresses the fact that renewable rollouts are not going according to contracted renewable plans. The New York Department of Public Service (DPS) Case Number: 15-E-0302,: Proceeding on Motion of the Commission to Implement a Large-Scale Renewable Program and a Clean Energy Standard recently asked for comments on the DPS staff and the New York State Energy Research and Development Authority’s (NYSERDA) July 1, 2024, filing of the Draft Clean Energy Standard Biennial Review. Comments submitted by EDF Renewables noted that:
Reflecting on Sections 4 and 5 of the Draft Review with a look at the current state of contracted
renewables and the path to achieving the 70% Goal:
- Out of 156 RES Tier 1 projects that have been awarded, approved, or are pending approval by NYSERDA since 2004, 30 are operational and 23 are still under development.
- 11 of 25 land‐based wind projects are operational and 9 of 116 solar projects are operational. Operational projects have added 1,016 MW of capacity, 821 MW of which are land based wind projects.
11,000 MW of capacity has been cancelled or is still under development.
The Draft Clean Energy Standard Biennial Review itself acknowledged this problem. It concludes that New York’s Climate Leadership & Community Protection Act 70% renewable energy by 2030 target will not be met until 2033. The Biennial Review notes:
New York’s progress has been and will continue to be affected by conditions in the larger global markets. The complex renewable energy supply chain is a global network of materials procurement, processing, production, materials recovery, infrastructure, and logistics operations. As the United States and other nations raise their goals for emission reductions, those supply chains are stressed. Geopolitical tensions and policies incentivizing domestic production of major energy generation equipment also impact the cost and availability of materials and components. High interest rates and inflation – which were prevalent from mid-2021 through mid-2023 across the renewable energy supply chain – also play a role in raising the baseline for renewable energy input prices. While such prices have recently stabilized, input prices are higher than what was forecasted prior to the 2021-2023 inflationary period.
The IPM modeling does not address this reality. In the absence of documentation citing just how much solar PV, onshore wind, and offshore wind resources were assumed to be deployed in the RGGI IPM modeling analysis I made my own estimate.
My projection of necessary renewable energy is based on evaluation of historical emissions data. Table 2 lists the observed annual CO2 emissions from the ten-state RGGI region from the EPA Clean Air Markets Division (CAMD) database. Details on the methodology are available in my comments, a supplementary attachment, and a spreadsheet that describes the analysis details. Note that there has been a significant drop in CO2 emissions in the RGGI region, but a large portion of those reductions were due to fuel switching from coal and oil to natural gas and retirements of fossil-fired units. Importantly, the opportunity for further fuel switching reductions is small. This is the basis for my assertion that most future emission reductions must come from reduced operations at existing fossil-fired power plants due to displacement by renewable deployments.
Table 2: 10-State EPA CAMD All Program Annual CO2 Emissions by Fuel Type
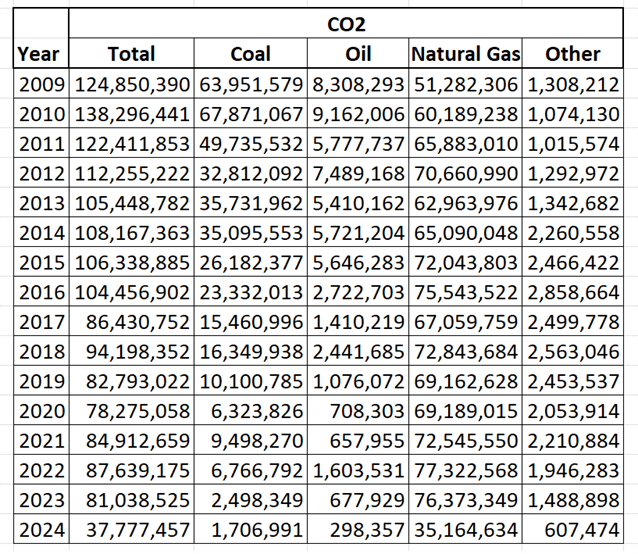
I used these data and the IPM modeling results to make a projection out to 2028. I assumed the coal, oil, and other fuel types would go to zero by 2028 and that natural gas emissions equal the emissions projected by IPM in 2028. I also used these data to project renewable requirements. I used the EPA load data and emissions to calculate the load per ton of CO2 for each fuel type. I used those parameters to estimate the load associated with the IPM projected emissions in 2028.
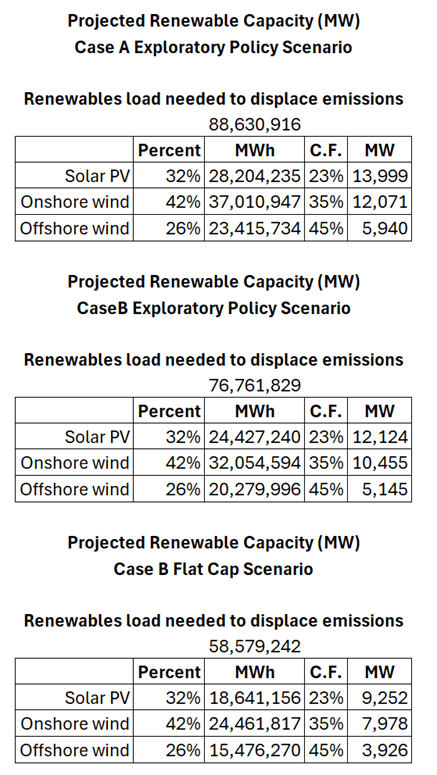
In Table 3 I list the estimated renewable displacement load (MWh) value for each scenario. At the top of the tables, the fossil fired generation load that must be displaced by renewable energy is listed. For example, 88,630,916 MWh is the amount in the Case A, Exploratory Policy Scenario. I determined the relative contributions of solar PV, onshore wind, and offshore wind based on results in the IPM modeling spreadsheet. Those percentages were multiplied by the total load that renewables must displace to estimate how much each type would be needed I assumed some conservatively high capacity factors for the renewable resources and calculated the capacity (MW) of each resource. In my opinion, there is very little chance that these levels of solar PV, onshore wind and offshore wind can be deployed by 2028 because of the problems noted in the Biennial Review.
Table 3: Estimated Renewable Deployment Necessary to Achieve IPM RGGI 2028 Emissions
There are other potential problems that could have bigger ramifications. IPM integrates “wholesale power, system reliability, environmental constraints, fuel choice, transmission, capacity expansion, and all key operational elements of generators on the power grid in a linear optimization framework”. I think that the optimization process presumes that wind and solar resources can be freely substituted for other dispatchable resources in its estimates of the future electric power system. However, wind and solar resources are not dispatchable. It is not clear whether the IPM approach is appropriate for an electric system that has a large renewable component.
Furthermore, I do not know how IPM handles weather dependency of wind and solar in its projections. My back-of-the-envelope projection for renewable generation necessary to displace fossil fueled resource generation assumes that the replacement is on a one for one MWh basis. Presently, wind and solar generation is dispatched first because there is no fuel cost. Fossil resources are being used more and more only as backup when wind and solar is unavailable. As a result, wind and solar resources displace less and less fossil, as more resources are added. For example, fossil support for solar resources can never be eliminated at night. The same holds true for wind because there is a significant correlation of wind facilities across large areas. For example, on 9/13/2024 at hour 1200 the New York Independent System Operator (NYISO) real-time fuel mix generation from over 2,500 MW of wind capacity across the state, including an offshore wind facility, was zero.
To accurately project future fossil generation in an electric grid with increasing amounts of intermittent wind and solar, dispatchability and weather dependency must be incorporated. I understand that the NYISO resource planners use historical meteorological data and associated wind and solar output to account for weather dependency and their resource planning approach incorporates dispatchability concerns. If IPM does not address this issue correctly, then the results for the future projections have little value and should not be relied on to make future predictions of the RGGI electric system. It would be prudent to compare the IPM modeling results with the projections for future resources developed by regional transmission operators in the region before completing the Third Program review process.
Allowance Price Modeling Comments
One of the key outputs in the Program Design modeling is the price of allowances. As described in my comments I am not enamored of the ability of the IPM analysis to project allowance prices. The documentation notes that IPM considers “long-term fundamentals, generation assumptions & costs, economic growth forecast, and government policies.” I think this is a fatal flaw of the approach because the model has no way to incorporate uncertainty, and the model has perfect foresight. This is a problem in the first place because the assumptions used for the considerations are subject to change. For example, cost predictions necessarily are affected by future rates of inflation, and no one predicted the recent large changes. Secondly, these considerations introduce significant uncertainties that affect the deployment of the renewable resources necessary to displace fossil generating units and reduce their emissions. This in turn affects the scarcity of allowances relative to emissions and that affects allowance prices. As shown earlier, there are limited remaining opportunities to switch fuels so any delays in renewable deployment will affect future emissions and allowance prices. The IPM allowance modeling estimates cannot handle these uncertainties, so they are little more than educated guesses.
Modeling Scenario Comment Conclusion
Given the enormous uncertainties of the transition to zero-emissions in the RGGI states it would be prudent to address this issue directly. I commend the states for proposing a two-tier CCR solution that, depending on how it is implemented, could deal with the problem simply.
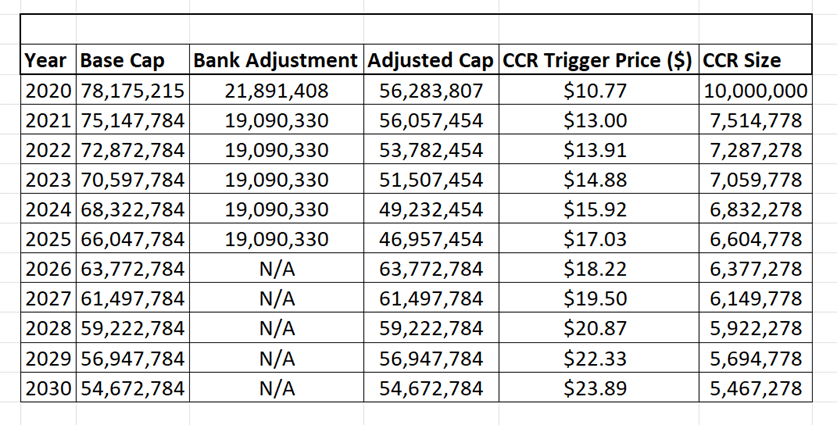
RGGI has already adopted the Cost Containment Reserve (CCR). The CCR established a “quantity of allowances in addition to the cap which are held in reserve.” If allowance prices exceed predefined price levels, these allowances are sold. The CCR is replenished at the start of each calendar year.
Table 4 lists CCR and trigger prices over time. Note that the March 13, 2024 allowance auction clearing price was $16.00 so the CCR allocation was completely used up. In the most recent auction, the clearing price was $25.75 which exceeds the 2030 trigger price. In the two-tier approach another set-aside of allowances will be available for sale in an auction if the price exceeds the second trigger.
Table 4: RGGI Cost Containment Reserve
The ultimate issue is how the allowances allocated for the annual caps compare and the bank of already allocated allowances held compare with actual emissions. Environmental activists demand that the allowance cap “bind” emissions to ensure that the reductions occur on their arbitrary trajectory. They don’t accept that a binding cap will limit emissions even if the zero-emissions resources are not available to displace the existing emissions and that the ramifications of that situation are enormous. In the worst case, an electric generating unit needed to keep the lights on will refuse to operate because they have insufficient allowances. The two-tier CCR resolves this problem.
Response to “Environmental Ambition” Questions
The second component notes that: “The RGGI states are interested in exploring potential market solutions that could enable such states to link to the RGGI market in the future, including potentially at a cap trajectory which may not align with the RGGI cap trajectory resulting from the Third Program Review.” In particular, the RGGI states seek stakeholder feedback on potential accommodation mechanisms such as:
- The potential application of allowance trading or compliance ratios between entities in states that have and have not adopted the cap trajectory resulting from the Third Program Review.
- The potential application of volume limits in trading or compliance between entities in states that have and have not adopted the cap trajectory resulting from the Third Program Review.
- The proper basis to determine such potential allowance trading/compliance ratios, or volume limits, including respective emissions cap levels, reduction trajectories, price levels, and/or other relevant factors.
- Other potential mechanisms that would allow for participation by states implementing a cap trajectory that is different than the cap trajectory resulting from the Third Program Review, such as a cap trajectory previously adopted in regulations to be consistent with the current RGGI program, while safeguarding any new environmental ambition achieved by the current RGGI participating states as a result of the Third Program Review.
These mechanisms all would introduce significant logistical tracking and reporting issues. In addition, the accommodation mechanisms create an incongruous compliance system. Consider two trading regions:
- Region 1 starting emissions are 1,000 and the region target is zero in ten years, so the allowance reduction trajectory is 100 allowances per year
- Region 2 starting emissions are 2,000 and the region target is zero in twenty years, so the allowance reduction trajectory is also 100 allowances per year
In the first year the sum of the allowance caps for the two regions is 2,800. If in the first year Region 1 emissions are 1,000 and the Region 2 emissions are 1,800 the sum of the emissions is 2,800 and the two regions are in overall compliance with the combined limit. However, within Region 1 the sources are out of compliance if they are treated differently. The desired environmental impact is achieved but all the accommodation mechanisms proposed penalize the sources.
What is the point of all the additional complexity? The only rationale is that the ambition is different for timing in two different regions and that needs to be considered. However, the difference in a ton reduced now versus a ton reduced in 2050 is inconsequential to global climate change. Therefore, I do not think that any of the potential accommodation mechanisms are necessary.
Conclusion
In the comments submitted I address problems I see with the IPM modeling that underpins the Third Program Review proposals. IPM estimates that CO2 emissions will be 50% lower across the RGGI region by 2028. I do not think that is reasonable. I estimated how many renewable resources would need to be deployed to displace RGGI-affected source emissions and this confirmed my concerns.
I think the results are related to the limitations of IPM. Documentation related to the New York biennial review of the observed progress of its GHG emission reduction goals has identified supply chain, higher interest rates, inflation, and workforce limitations that have delayed progress in the rollout of New York wind and solar resource deployment. All these issues add significantly to model input uncertainty.
I have serious concerns with the modeling results. My comments note that the IPM modelling approach cannot reconcile the deployment uncertainties observed in New York. Furthermore, it is not clear how well IPM addresses issues related wind and solar weather related dispatchability. These ambiguities compound the inherent challenges related to allowance price estimates. As a result, I believe that the limitations of the IPM projections must be addressed in the Program Design elements.
I commend the RGGI proposal to add second CCR tier. It is a reasonable response to the intractable uncertainties. It should be an effective response to my concerns if the parameters are chosen correctly.
Finally, I review the proposed solutions to address environmental ambition if other jurisdictions join RGGI. I do not believe that the additional complexity and logistical implementation issues associated with the proposals is warranted because the difference in ambition is more symbolic than real.
