

The Regional Greenhouse Gas Initiative (RGGI) is a market-based program to reduce CO2 emissions from electric generating units. One aspect of RGGI is a regular review of the program status and need for adjustments. On July 3, 2025, RGGI announced that results of the Third Program Review. Based on my analysis of the planned revisions, the RGGI States only delayed the inevitable reckoning of the futility of this program to achieve the goal of a “zero-emissions” electric system. When I was researching that article, I used Perplexity AI to help me figure out a way to consider RGGI’s impact on ratepayer costs that is the topic of this post.
Dealing with the RGGI regulatory and political landscapes is challenging enough that affected entities seldom see value in speaking out about fundamental issues associated with the program. I have been involved in the RGGI program process since its inception and have no such restrictions when writing about the details of the RGGI program. I have worked on every cap-and-trade program affecting electric generating facilities in New York including RGGI, the Acid Rain Program, and several Nitrogen Oxide programs, since the inception of those programs. I also participated in RGGI Auction 41 successfully winning allowances and holding them for several years. The opinions expressed in this post do not reflect the position of any of my previous employers or any other organization I have been associated with, these comments are mine alone.
Background
RGGI is a market-based program to reduce greenhouse gas emissions (GHG) (Factsheet). It has been a cooperative effort among the states of Connecticut, Delaware, Maine, Maryland, Massachusetts, New Hampshire, New York, Rhode Island, and Vermont to cap and reduce CO2 emissions from the power sector since 2008. New Jersey was in at the beginning, dropped out for years, and re-joined in 2020. Virginia joined in 2021 but has since withdrawn, and Pennsylvania has joined but is not actively participating in auctions due to on-going litigation. According to a RGGI website:
The RGGI states issue CO2 allowances that are distributed almost entirely through regional auctions, resulting in proceeds for reinvestment in strategic energy and consumer programs.
Proceeds were invested in programs including energy efficiency, clean and renewable energy, beneficial electrification, greenhouse gas abatement and climate change adaptation, and direct bill assistance. Energy efficiency continued to receive the largest share of investments.
Despite the claims about the success of RGGI, the reality is that the only thing it is good at is raising money. Suggestions that RGGI has been responsible for the observed reductions in CO2 emissions over the life of the program ignore the importance of fuel switching and the poor performance of RGGI auction proceed investments in reducing emissions.
The RGGI States regularly review successes, impacts, and design elements of the program. The latest review is the third iteration of the effort. It started in February 2021 and finally was completed in June 2025, years behind schedule.
I was an active participant in the program review. I described my initial comments in October 2023 addressing the disconnect between the results of RGGI to date relative to the expectations in the RGGI Third Program Review modeling. Last October I submitted more comments as described here. I also described other comments submitted to RGGI.
Third Program Review Summary
If you are interested in the revisions made to the program, please refer to my previous RGGI post. The primary rule revisions addressed the need to reduce the cap allocations to be consistent with various RGGI State decarbonization goals. In my opinion, the political mandates for zero electric system emissions by 2040 are infeasible. The changes to RGGI modify the allowance allocation schedule but include a “cost containment reserve” that adds allowances at a higher cost. The focus of this article is on the impact of the RGGI auction price on consumer costs historically and because of the Third Program Review revisions.
Bottom-Up Analysis of RGGI Impact on Consumer Costs
I used Perplexity AI to provide documentation about the effect of RGGI allowance prices on consumer costs. I ended up submitting two questions that provide a description of RGGI Allowance Costs and Their Impact on Electricity Prices with a follow up focusing on New York specific RGGI impacts. In both instances the AI research failed to find documentation that I could decipher well enough to develop a methodology to estimate historical cost impacts and future projected cost impacts.
The research responses explained the components that flow allowance prices into consumer costs. There is a direct relationship between CO2 emissions for a fossil unit and the effect of RGGI allowance prices that shows up in wholesale prices. In New York those cost adders affect the location-based market price in different control zones that makes estimating rate payer impacts difficult. The first response described an ISO-New England case study that provided wholesale price impacts of RGGI. Unfortunately, my primary interest is the cost to consumers and the path from wholesale prices to retail costs is mostly opaque.
The AI response did find references that concluded that “Current retail riders in NJ and DE range 0.40–0.50 ¢/kWh, adding $3–$5 to an average monthly bill—well below other volatility drivers such as natural-gas commodity swings or capacity-market resets.” However, I found nothing about costs in New York.
Trying to estimate residential cost impacts of RGGI using this information would be a bottom-up analysis that starts with specific details that affect electric rates and incorporates other detailed information to project impacts. Given that I could not find sufficient detailed information for each component of costs I gave up trying this approach.
Top-Down Approach to Estimate the Effect of RGGI on Residential Costs
Note: Table numbers refer to tables in the Addendum
For the top-down analysis, I assumed that residential rates are affected by RGGI compliance costs proportional to the total RGGI compliance cost fraction of total electric revenues. I used Perplexity AI to find the total electricity revenues for the residential sector for each RGGI state. The cost of RGGI compliance charged to customers equals the state-level emissions released times the allowance price for each ton emitted. Details of the methodology used to estimate ratepayer impacts are described in the Addendum to the post. It is included because I believe that analyses are more credible when the approach is documented. However, most readers likely do not want to deal with those details so they are not in the main body.
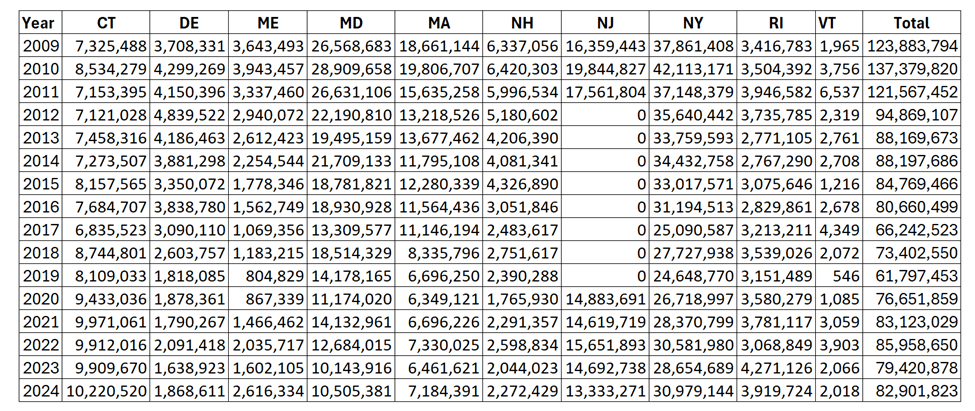
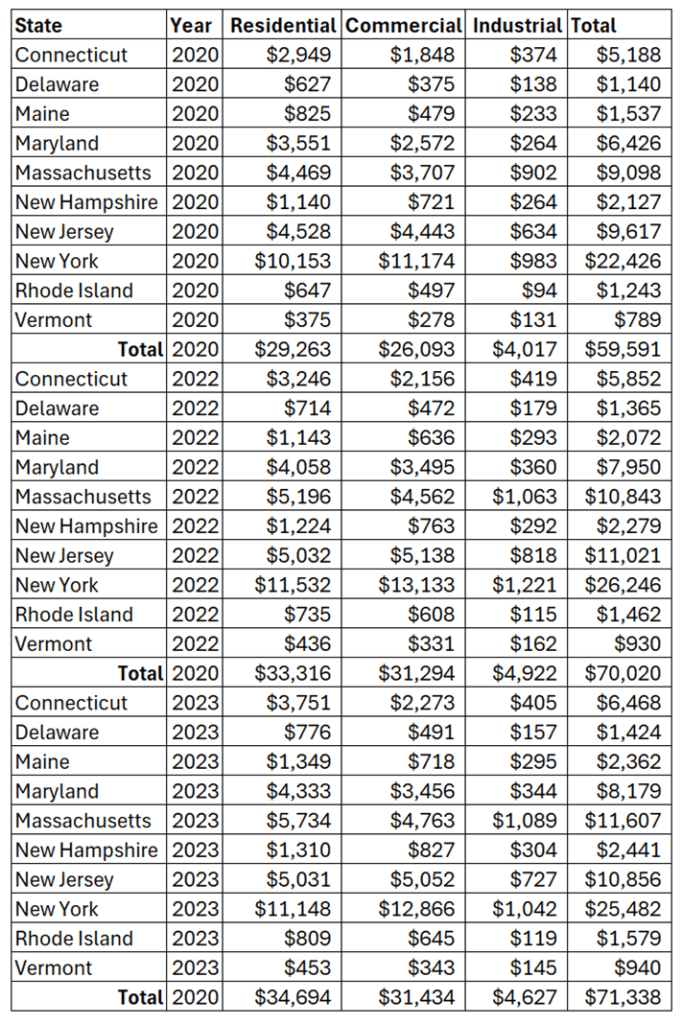
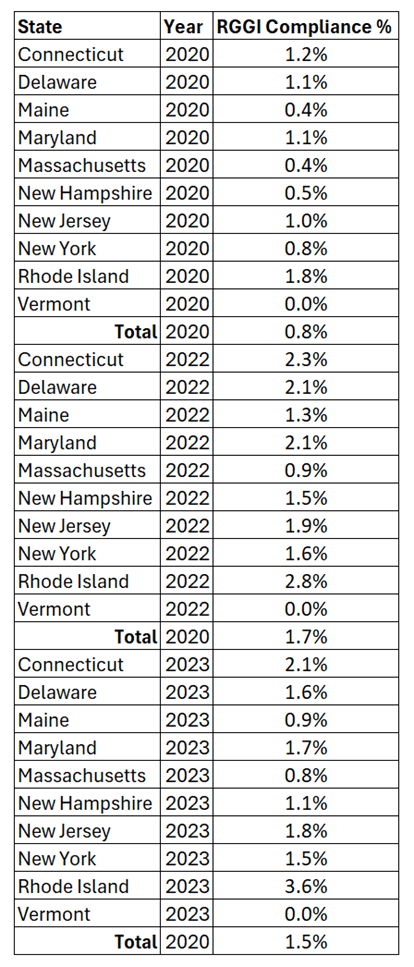
I used data from multiple sources. Emissions data came from the EPA Clean Air Markets Program Data system that documents power plant emissions from various market trading programs. Table 1 in the Addendum lists the annual emissions by state for all units affected by the RGGI program. For allowance prices I calculated annual averages from the quarterly allowance auction prices in the RGGI Market Monitor Auction Reports (Table 2 in the Addendum). I used Perplexity AI to provide revenues by the residential, commercial, and industrial sectors data (Table 3). That analysis was based on information from the US Energy Information Agency but there was only information available for three years. The percentage of total revenue costs caused by RGGI costs is derived from that information (Table 4). I also used Perplexity AI to provide the electricity rates for 2020, 2022 and 2023.
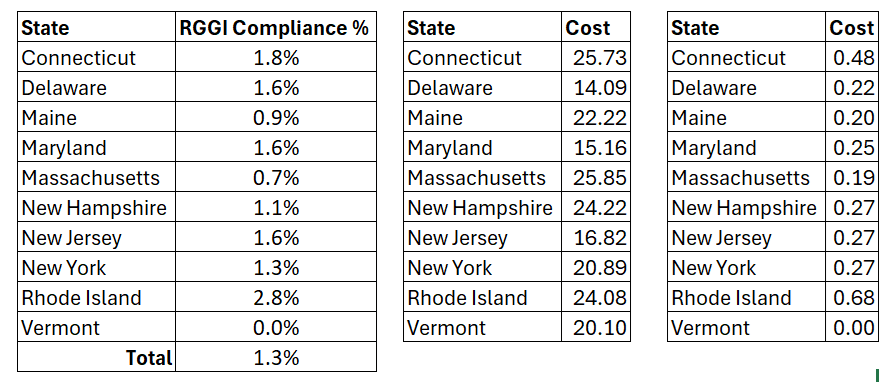
At this point I had all the data necessary to determine the impact of RGGI allowance costs on residential rates for the three years with rate data. I averaged the data from those three years. The RGGI compliance % of total revenues equals the RGGI compliance costs divided by the total electric costs (Table 5a). The average state residential rates (Table 5b) are from another AI search. Table 5c lists the calculated state residential cost attributable to RGGI (¢/kWh) by multiplying the compliance percentage of the average state residential rates. Note that these estimates are in the range of the “current retail riders in NJ and DE that range 0.40–0.50 ¢/kWh.”
Table 5a Table 5b Table 5c
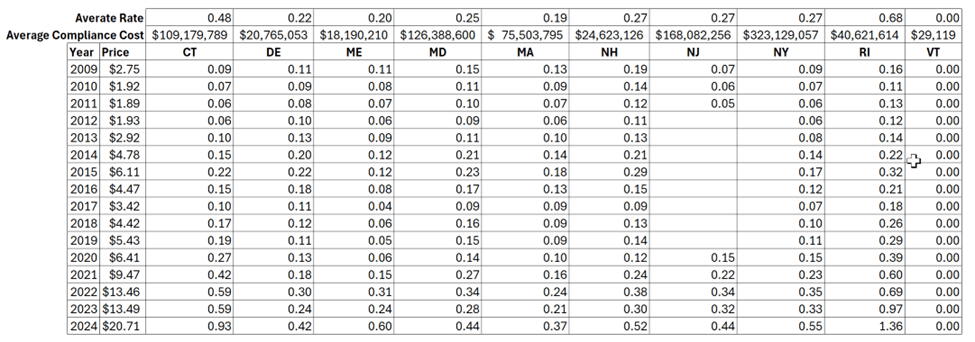
I used this information to estimate the impact of RGGI compliance costs on residential rates (¢/kWh) since the start of the program (Table 6 in the Addendum). In this analysis it is assumed that the annual residential rates in any one year are proportional to the average values listed in Table 5c. For example, the Connecticut 2009 estimated residential rate equals the average rate (0.48) multiplied by the Table 2 annual compliance cost in 2009 ($20,108,464) divided by average compliance cost ($109,179,789).
I do not keep track of my residential rate and do not expect others do either. Table 7 estimates the costs for a typical consumer that uses 750 kWh per month. This is the most important RGGI impact for consumers. The Perplexity AI response noted that “adding $3–$5 to an average monthly bill—is well below other volatility drivers such as natural-gas commodity swings or capacity-market resets.” Note that my estimate of RGGI consumer costs was well below even those levels until 2024. That probably accounts for why consumers have not paid much attention to RGGI.
Table 7: Monthly RGGI Residential Costs for 750 kWh per Month Electric Use
Future Projections
This cost estimation methodology can also be used to estimate future impacts to ratepayers in the RGGI states. I described the assumptions and details of my approach in the Addendum. Table 7 estimates future costs for a typical consumer that uses 750 kWh per month. The monthly cost impact of RGGI peaks in 2030. Rhode Island ratepayer would pay the most, $13.75 a month additional because of RGGI that year. New York ratepayers could pay an additional $5.57 a month because of RGGI in 2030.
Table 11: Future Monthly RGGI Residential Costs for 750 kWh per Month Electric Use
Caveats
The future costs and emissions will be affected by factors that I did not include. There is a significant bank of allowances that will keep emissions higher than the allocations for some time. The sale of banked allowances from non-compliance entities to affected sources that need allowances to operate will increase costs to consumers.
Discussion
There are some interesting facets of the Third Program Review buried in this information.
Although this approach does not cover all the nuances of RGGI allowance prices on residential prices I am comfortable that the projections are reasonable. The first takeaway is that residential average monthly bill impacts of RGGI are “well below other volatility drivers such as natural-gas commodity swings or capacity-market resets.”
The Third Program Review took a long time to finalize and I think that reflects the unprecedented aspects they are confronting. Market based programs rarely establish caps that less than the affected sources can achieve without shutting down. This is the situation in the RGGI states going forward. Typically, costs per ton removed increase as emissions approach zero, so this is a significant challenge for the effectiveness of this strategy for zero-target programs like New York’s Climate Leadership & Community Protection Act.
One problem with the cap and invest approach that incorporates a declining cap that goes to zero is that as the number of allowances decreases the funds available to invest in emission reductions goes down. Table 12 illustrates how the RGGI States got around this problem for now. It lists the allowance cap, the CCR trigger prices and CCR allowance allocations through 2037 when the policy ends. I calculated the total allowances and potential revenues. The RGGI States deferred the problem of declining revenues by setting the CCR Tier 2 trigger price increase the same as the allowance cap decrease.
Table 12: Third Program Review Allowance Allocation Parameters and Expected Revenues
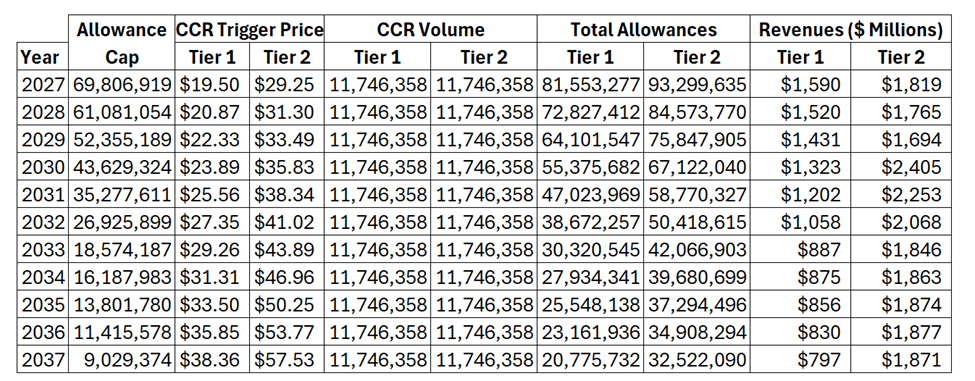
In theory, after 2033 the revenues should stabilize at $1.9 billion a year. Unresolved is that this approach does not get to zero emissions – they level off at just under 23 million tons after 2040. I would also expect that as the allowances get scarcer, that the allowance prices will go up due to demand. There is a potential for very high allowance prices that would affect consumers. Note, that the benefits of the auction sales occur at the time of the auction. Sales of banked allowances only profit the holders of the banked allowances.
Finally I want to reiterate a point made in my previous article on the RGGI Third Program Review. I am convinced that no GHG emission reduction cap-and-invest program will succeed. Danny Cullenward and David Victor’s book Making Climate Policy Work explains why. They note that the level of expenditures needed to implement the net-zero transition vastly exceeds the “funds that can be readily appropriated from market mechanisms”. Even though RGGI allowance prices will increase significantly, they still will be insufficient to fund the necessary development of zero emission resources. Based on this analysis RGGI won’t provide sufficient revenue to support zero decarbonization even if the RGGI States were not squandering revenues on non-emission reduction related programs
Conclusion
The Third Program Review Policy Update features an allowance allocation schedule that is consistent with RGGI State net-zero regulations. That trajectory is inconsistent with wind and solar deployment history and reasonable expectations. As a result, there eventually will be insufficient allowances available for CO2 emitting generation resources to operate.
This analysis of consumer cost impacts has one bright side. It does not appear that reasonably expected allowance prices will meaningfully impact consumers. The allowance prices are too low to cause impacts. At the same time it is clear that there aren’t enough revenues to fully fund emission reduction strategies needed to achieve zero emissions.
The use of a CCR and addition of a second CCR will delay the inevitable reckoning and ensure that for the next ten years there will be a steady source of revenues. Raising money is the only success story for RGGI. The question whether the investments of those revenues was well spent is a story for another time.
Addendum: Top-Down Analysis Description
The methodology used to estimate ratepayer impacts is described in the Addendum to the post. This is included because I believe that analyses are more credible when the approach is documented.
In this analysis it is assumed that residential rates are affected by RGGI compliance costs proportional to the total RGGI compliance cost fraction of total electric revenues.
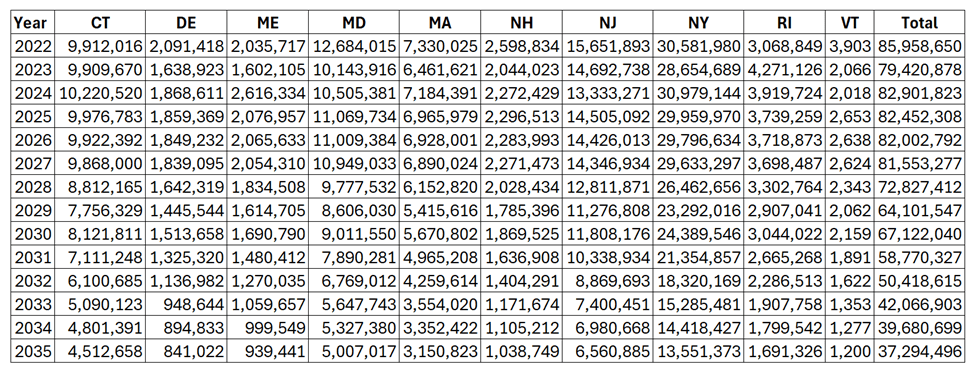
The cost of RGGI compliance is assumed equal to the annual emissions times the annual auction allowance cost. I used data from the EPA Clean Air Markets Program Data system that documents power plant emissions from various market trading programs. Table 1 lists the annual emissions by state for all units affected by the RGGI program.
Table 1: RGGI Annual CO2 Emissions (tons)
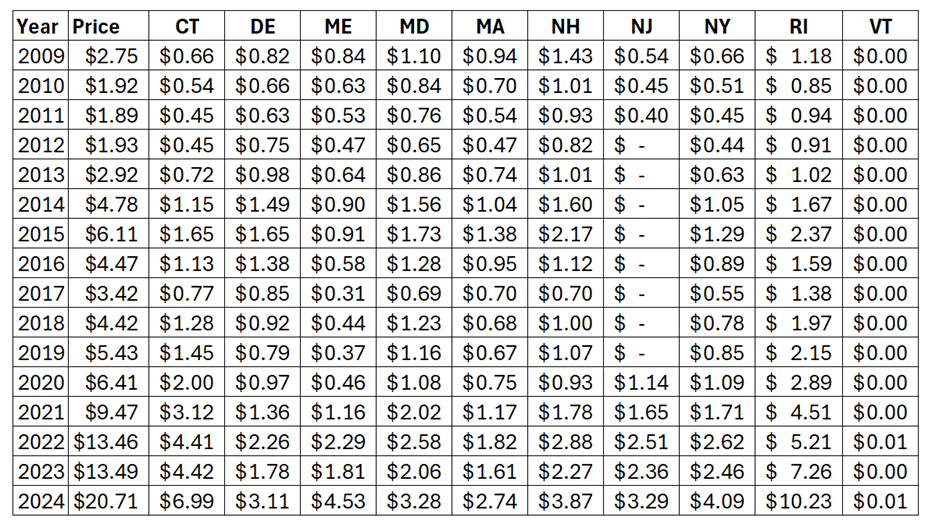
The state-wide cost of RGGI compliance is the cost of allowances times the emissions. Table 2 is based on quarterly allowance auction prices from the RGGI Market Monitor Auction Reports. I calculated the annual numbers that are listed as an average of the quarterly values.
Table 2: Annual RGGI Compliance Costs
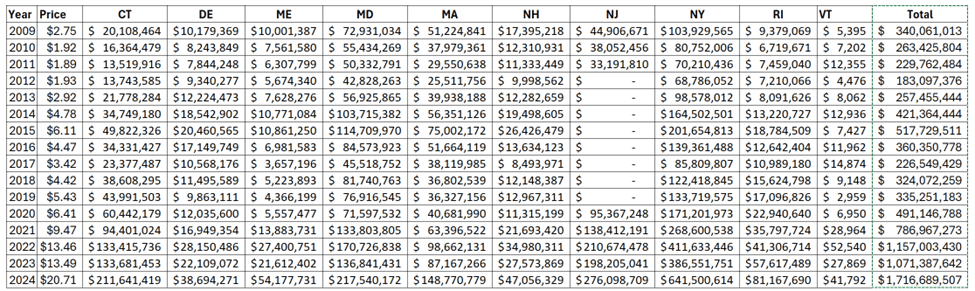
Table 3 lists the total state electricity revenues for the three years that Perplexity AI could provide revenues by the residential, commercial, and industrial sectors.
Table 3: RGGI State Electricity Revenues ($millions) for the Available Annual Data
Using the annual RGGI compliance costs (Table 2) and the annual electricity revenues (Table 3) produces the percentage of total revenue costs that are caused by RGGI costs in Table 4.
Table 4: RGGI Compliance Costs % of total revenues for the Available Annual Data
I also used Perplexity AI to provide the electricity rates for 2020, 2022 and 2023 (not shown). I averaged the values from those years for the Average RGGI Compliance % of total revenues (Table 5a) and the Average State Residential Rates (Table 5b). Table 5c lists the calculated state residential cost attributable to RGGI (¢/kWh) by multiplying the compliance percentage of the average state residential rates.
Table 5a: Average RGGI Compliance % of total revenues, Table 5b: Average State Residential Rates (¢/kWh) and Table 5c: Calculated State Residential Cost Attributable to RGGI (¢/kWh)
Table 5a Table 5b Table 5c

Table 6 estimates the impact of RGGI compliance costs on residential rates (¢/kWh). In this analysis it is assumed that the annual residential rates in any one year are proportional to the average values listed in Table 5c. For example, the Connecticut 2009 estimated residential rate equals the average rate (0.48) multiplied by the Table 2 annual compliance cost in 2009 ($20,108,464) divided by average compliance cost ($109,179,789).
Table 6: Annual Historical Estimated RGGI Residential Rate by State (¢/kWh)
In my opinion, the rate values are not relatable. Table 7 estimates the costs for a typical consumer that uses 750 kWh per month. This is the most important RGGI impact for consumers. In my opinion, the historical costs for a typical consumer are not remarkably much higher even with the much greater allowance prices of late.
Table 7: Monthly RGGI Residential Costs for 750 kWh per Month Electric Use

This cost estimation methodology can also be used to estimate future impacts to ratepayers in the RGGI states. The first step is to estimate annual emissions. In my previous article about the RGGI Third Program Review I argued that the addition of two Cost Containment Reserve (CCR) tiers pushed the inevitable reckoning that future emission reductions consistent with the aggressive reduction trajectory are unlikely. The RGGI summary of the Third Program Review includes a figure that shows the allowance allocation trajectories. The figure compares the current regional base cap (light blue) with the updated cap trajectory (dark blue). The orange and yellow lines display the total updated regional cap if all allowances are released from the updated first and second CCR tier, respectively.
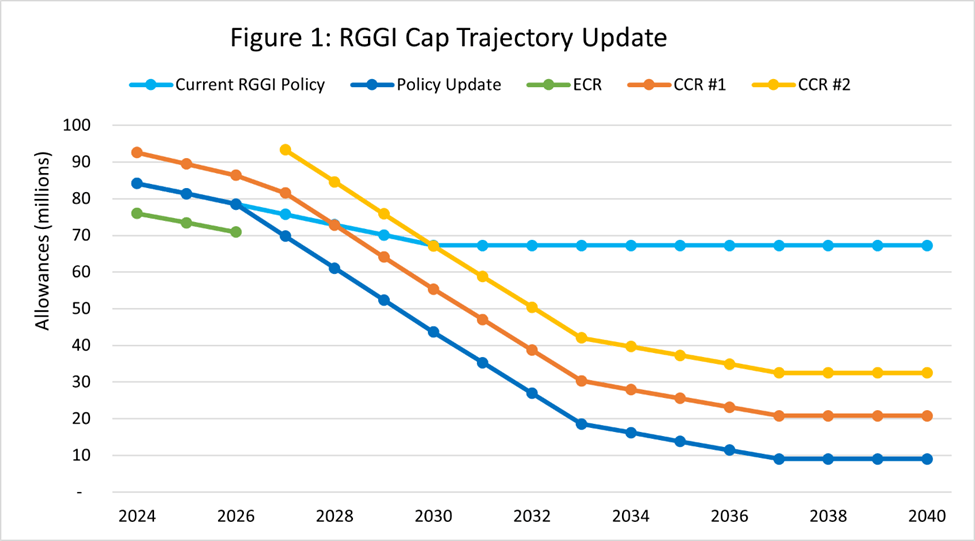
This figure compares the current regional base cap (light blue) with the updated cap trajectory (dark blue). The orange and yellow lines display the total updated regional cap if all allowances are released from the updated first and second Cost Containment Reserve tiers, respectively.
I based my future emission reduction projection on these curves. Table 8 lists my annual projections. I included the observed emissions from 2022 to 2024. I assumed that in 2027, the first year of revised RGGI allowance allocation policy, the emissions would equal the policy update allocation plus CCR #1. For 2025 and 2026, I used a linear interpolation between the average of 2022-2024 and the 2027 values. In 2030 I assumed emissions would equal the policy update allocation plus allowances from both CCR #1 and CCR #2 as shown in Table 8.
Table 8: Projected Annual RGGI Emissions
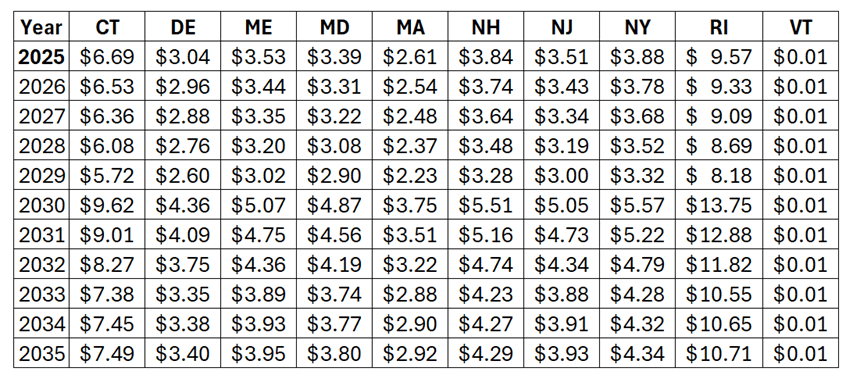
To get the annual RGGI compliance costs it is necessary to multiply the projected emissions by the expected allowance price. For 2025 through 2029 I assumed that the allowance price would equal the first CCR trigger. Starting in 2030 I used the trigger price for CCR #2. Table 9 lists the allowance prices and the compliance costs. Note that the expected compliance costs peak in 2030 and then start to decline as the number of allowances drops.
Table 9: Projected Annual RGGI Compliance Costs
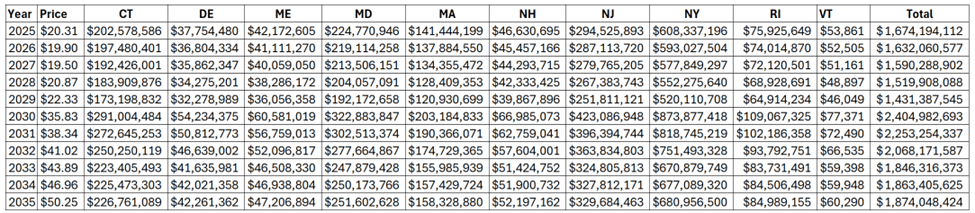
Table 10 estimates the impact of RGGI compliance costs on residential rates (¢/kWh) using the methodology described for Table 6.
Table 10: Annual Projected Future RGGI Impacts on Residential Rate by State (¢/kWh)
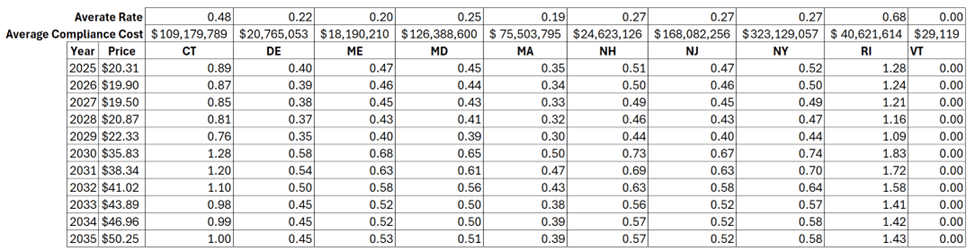
Table 11 estimates the costs for a typical consumer that uses 750 kWh per month. The monthly cost impact of RGGI peaks in 2030. Rhode Island ratepayer would pay the most, $13.75 a month additional because of RGGI that year. New York ratepayer could pay an additional $5.57 a month because of RGGI in 2030.
Table 11: Future Monthly RGGI Residential Costs for 750 kWh per Month Electric Use

