I recently wrote that the energy debacle that occurred in Texas is unlikely in New York today because of market and system differences but if the Climate Leadership and Community Protection Act (CLCPA) is implemented incorrectly something similar is inevitable. Last fall the Analysis Group completed their Climate Change Impact and Resilience Study (“Resilience Study”) for the New York Independent System Operator (NYISO). The study evaluated different resource scenarios that meet the 2040 CLCPA zero-emissions mandate for various weather and load scenarios. The findings do not portend well for New York’s energy future and raise important questions for New York’s planning. In this first post discussing the Resilience Study findings relative to the Texas Energy Debacle I will compare New York’s future reliability problem relative to the Texas weather that caused their problems. This is a long detailed post but will provide background for future posts on other aspects of this issue.
I have written extensively on implementation of the CLCPA closely because its implementation affects my future as a New Yorker. I have described the law in general, evaluated its feasibility, estimated costs, described supporting regulations, listed the scoping plan strategies, summarized some of the meetings and complained that its advocates constantly confuse weather and climate. The opinions expressed in this post do not reflect the position of any of my previous employers or any other company I have been associated with, these comments are mine alone.
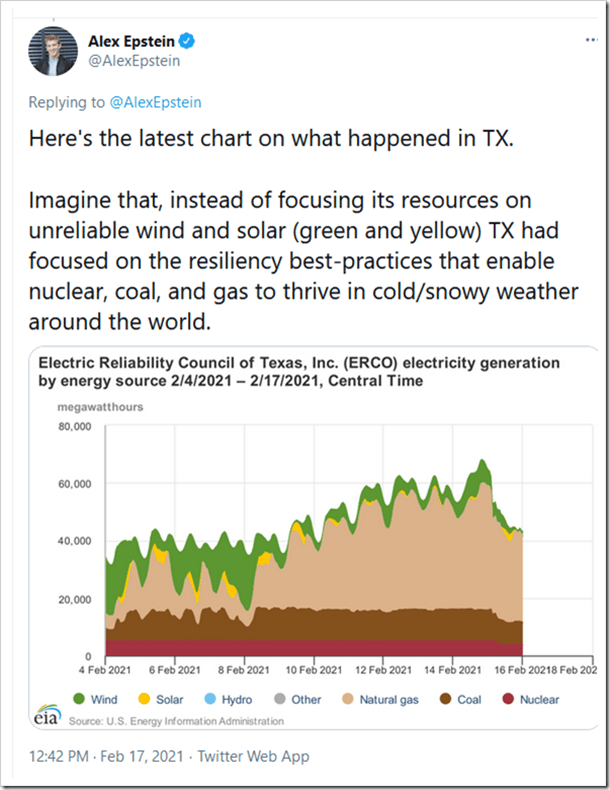
Texas Energy Debacle
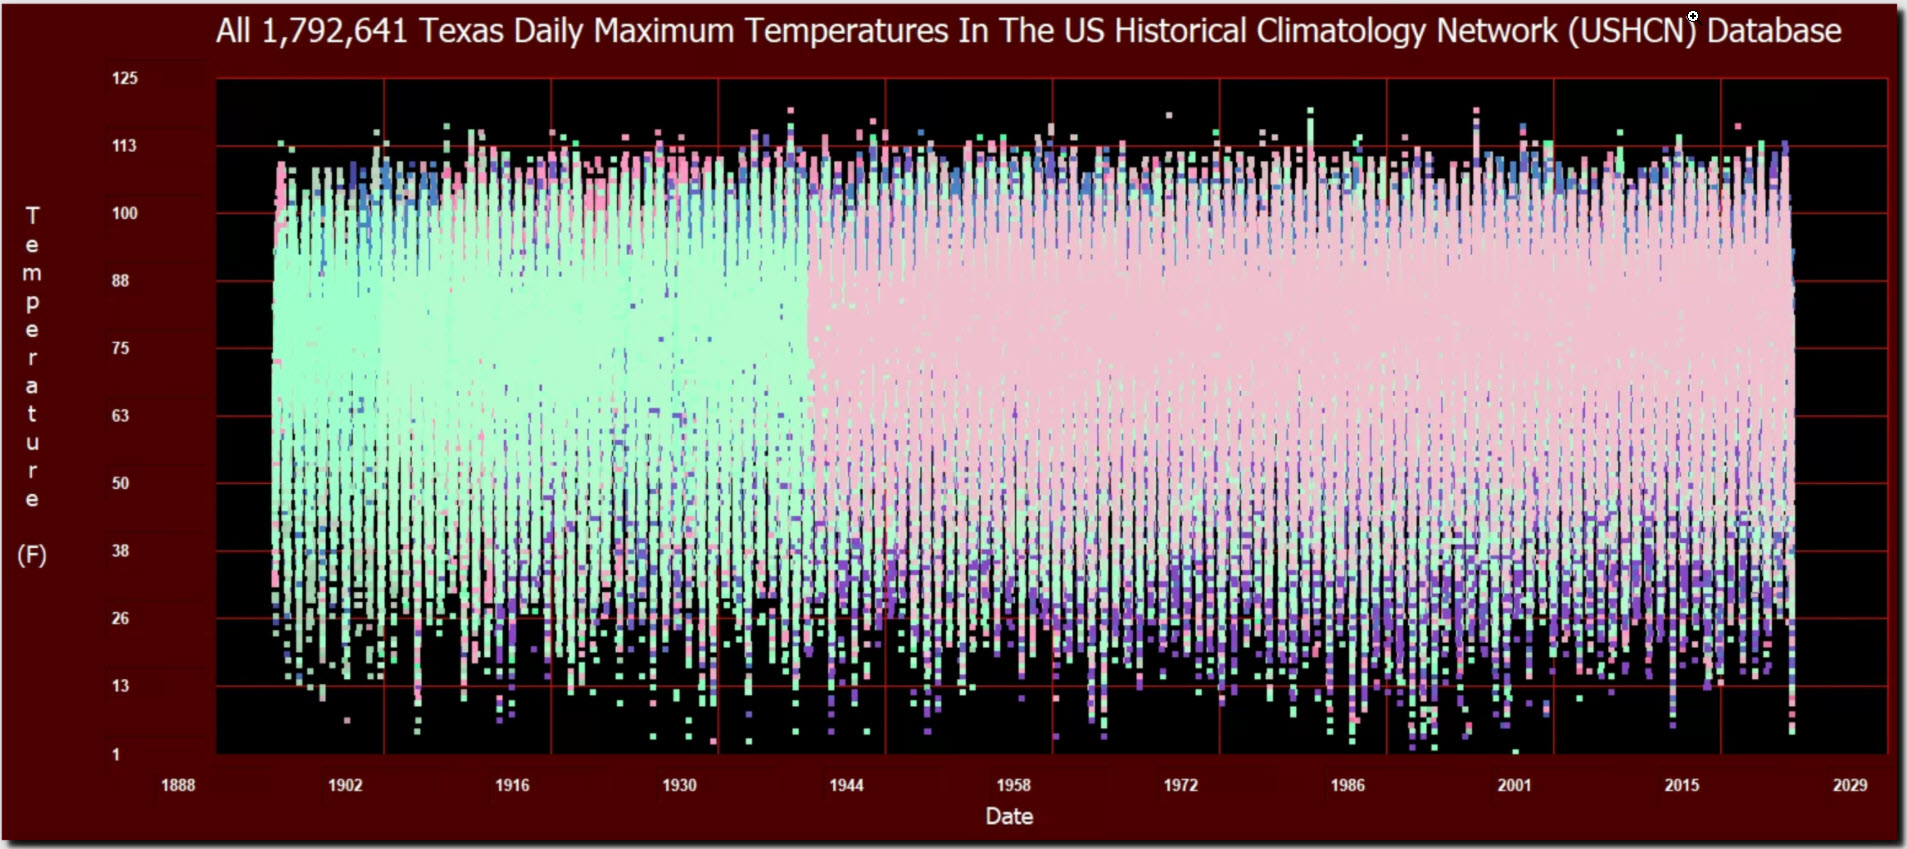
In brief, the ultimate cause of the blackouts and resulting problems in Texas was due to poor planning. The weather in Texas during the storm was extreme but not unprecedented. Similar cold snaps occurred in 2011, 1991, 1990, 1989, 1983, 1963, and 1961 and there were electrical outages in 2011. Because there is no apparent trend in low daily maximum temperatures (see Tony Heller’s graph), climate change is not a factor. This was a weather event.
Clearly the Texas electricity market failed to provide adequate resiliency for these conditions. I agree with Becky Klein, former commissioner and chairman of the Public Utility Commission of Texas who writes that the questions that need to be considered now are:
-
-
- Are we prepared to pay more for electricity and water to ensure higher levels of reliability?
- And if so, how much more?
- How can we be better prepared for “outlier” events, regardless of their probability?
- Would it make sense to require state-wide scenario planning that includes coordinated drills that test both our operational and communication capabilities across multiple entities?
As New York transitions its electric system to one dependent upon renewables all of these questions need to be addressed. Fortunately, the NYISO Climate Change Impact and Resilience Study lays the foundation to start to address those questions in New York.
Ultimate Problem
I have described what I believe is the ultimate problem previously. Both E3 in their presentation to the Power Generation Advisory Panel on September 16 and the Analysis Group in their September 10, 2020 presentation to NYISO explained that in order to meet the CLCPA emissions reduction goals that a resource category that provides firm, dispatchable and zero-emissions generation is needed. E3 gives examples such as “such as bioenergy, synthesized fuels such as hydrogen, hydropower, carbon capture and sequestration, and nuclear generation” but the Analysis Group avoids being specific. The International Energy Agency (IEA) recently published “Special Report on Clean Energy Innovation” that classified the technology readiness level of the technologies that could possibly be both dispatchable without GHG emissions. The bottom line is that none of the E3 examples of firm, dispatchable and zero-emissions technologies are close to being ready for adoption except nuclear and hydro which I believe are unlikely to provide any meaningful support for New York.
Climate Change Impact and Resilience Study
According to the report:
“In 2020, NYISO contracted with Analysis Group (AG) to complete this Climate Change Phase II Study (“Phase II Study”). The Phase II Study is designed to review the potential impacts on power system reliability of the (1) the electricity demand projections for 2040 developed in the preceding Climate Change Phase I Study, and (2) potential impacts on system load and resource availability associated with the impact of climate change on the power system in New York (“climate disruptions”).The climate disruptions considered include items that could potentially occur or intensify with a changing climate and that affect power system reliability, such as more frequent and severe storms, extended extreme temperature events (e.g., heat waves and cold snaps), and other meteorological events (e.g., wind lulls, droughts, and ice storms).”
As the Texas experience shows, it is necessary to address potential impacts of extreme weather on power system reliability. However, in my opinion, there is a significant weakness in the Analysis Group’s team because it does not include a meteorologist. If one was on the team this language probably would have been modified to make the point that natural variability in weather events such as extended extreme temperature events (e.g., heat waves and cold snaps), and other meteorological events (e.g., wind lulls, droughts, and ice storms) currently is much larger than any climate change induced variations. As a result, I refer to this report as the Resilience Study rather than the Climate Study. The report continually refers to climate disruptions which in reality are actually extreme weather events but that does not detract from the value of the analysis itself.
I refer you to the report for a detailed description of the Analysis Group modeling approach summarized in their Figure ES-1. As input they used two long-term hourly zonal-level load forecasts that reflect state policy goals and climate effects developed by ITRON. The Analysis Group energy balance model analyzed two load scenarios: a reference case and the CLCPA case that includes the expected increases in load due to heating and transportation electrification. Four sets of generating system resources were considered. The Resilience Study estimated what they thought would be needed to meet the load requirements and they also include the NYISO Grid in Transition estimates. A reference scenario and an expected resource scenario for both were evaluated. They considered weather disruptions including heat waves, cold snaps, wind lulls, wind storm disruptions, ice storms, and droughts. The result was a set of 72 analyses projecting the amount of each type of energy resource needed and the potential for resource inadequacy for a 30-day evaluation period.
Last October, soon after the Climate Change Phase II study came out, I prepared a post evaluating whether it adequately addressed the weather disruptions. Unfortunately, I don’t think it does. The evaluation period was too short and importantly they did not evaluate extreme wind and solar availability over the same periods. I also believe that monitoring data from a network with more spatial resolution must be done to adequately represent the effect of lake-effect clouds and precipitation. Nonetheless the analysis represents a good start addressing the problem of extreme weather.
NY LOLE planning
According to the 2020 NYISO Reliability Needs Assessment: “The New York system is deemed to have sufficient resources if the probability of an unplanned disconnection of firm load (loss of load expectation, or “LOLE”) is equal to or less than the standard of once in every 10 years or 0.1 events per year.” The reliability planning process starts with the Reliability Needs Assessment (RNA) followed by the Comprehensive Reliability Plan. I will only discuss the RNA here. It evaluates “the reliability of the New York bulk electric grid through 2030, considering forecasts of peak power demand, planned upgrades to the transmission system, and changes to the generation mix over the next ten years.” A base case “includes projected impacts driven by limitations on generator emissions”. Different scenarios “include an in-depth look at certain policy goals from the CLCPA” and “reliability risks associated with the cumulative impact of environmental laws and regulations”.
The RNA document explains that:
“Resource adequacy is the ability of the electric system to supply the aggregate electrical demand and energy requirements of the customers at all times, taking into account scheduled and reasonably expected unscheduled outages of system elements. Resource adequacy considers the transmission systems, generation resources, and other capacity resources, such as demand response. The NYISO performs resource adequacy assessments on a probabilistic basis to capture the random natures of system element outages. If a system has sufficient transmission and generation, the probability of an unplanned disconnection of firm load is equal to or less than the system’s standard, which is expressed as a loss of load expectation (LOLE). The New York State bulk power system is planned to meet an LOLE that, at any given point in time, is less than or equal to an involuntary firm load disconnection that is not more frequent than once in every 10 years, or 0.1 events per year. This requirement forms the basis of New York’s Installed Reserve Margin (IRM) requirement and is analyzed on a statewide basis.”
“If Reliability Needs are identified, various amounts and locations of compensatory MW required for the NYCA to satisfy those needs are determined to translate the criteria violations to understandable quantities. Compensatory MW amounts are determined by adding generic capacity resources to NYISO zones to effectively satisfy the needs. The compensatory MW amounts and locations are based on a review of binding transmission constraints and zonal LOLE determinations in an iterative process to determine various combinations that will result in reliability criteria being met. These additions are used to estimate the amount of resources generally needed to satisfy Reliability Needs. The compensatory MW additions are not intended to represent specific proposed solutions. Resource needs could potentially be met by other combinations of resources in other areas including generation, transmission and demand response measures.”
The relevant question after the Texas energy debacle is whether this planning process adequately protects New Yorkers from a similar blackout.
Climate Change Impact and Resilience Study Loss of Load Occurrences
The Resilience Study includes a generic resource intended to “identify the attributes of any additional resources that may be needed to avoid or reduce Loss of Load Occurrences (LOLO). This is similar to the NYISO Loss of Load Event but does not imply a specific frequency of occurrence like the LOLO. The Analysis Group labels these resources as dispatchable and emissions‐free resources (“DE Resources”). They “cover any circumstances where the resource sets are insufficient to meet identified demand, and to evaluate what attributes such a resource must have to help meet reliability needs”. These are the resources described in the Ultimate Problem section above.
The Resilience Study identified LOLO periods in 26 of the 72 scenarios evaluated. Overall, there were 414 hours with a loss of load identified totaling 331,065 MWh. Fourteen periods were associated with extreme weather events such as hurricanes, wind storms or icing while the other twelve were associated with a scarcity of renewable wind and hydro resources. Note that there was no specific scenario for a solar energy lull analogous to the wind energy lulls evaluated.
The extreme weather events are outliers. Over the 14 periods, 323 hours totaling 258,504 MWh were identified as having loss of load. Recall that Becky Klein wrote that one of the questions that need to be considered now is “How can we be better prepared for “outlier” events, regardless of their probability?” The key question is probability of occurrence for these events and a logical first step would be to determine how often these events happen. It is also important to determine what could be done to reduce impacts. Recall that the NYISO RNA process determines the various amounts and locations of compensatory MW required to reduce the probability of these events. It is not clear to me that any amount of additional resources could mitigate these impacts. Preparation for the outliers would probably focus on hardening infrastructure which is beyond the scope of this article.
On the other hand, the scarce renewable energy resources scenarios can be addressed by specifying compensatory MW requirements. For the twelve periods identified there were 91 hours totaling 72,561 MWh. Nine of the periods were associated with periods of calm winds and three with droughts. I agree with E3 who has highlighted the critical period of concern to be a multi-day winter period of light winds.
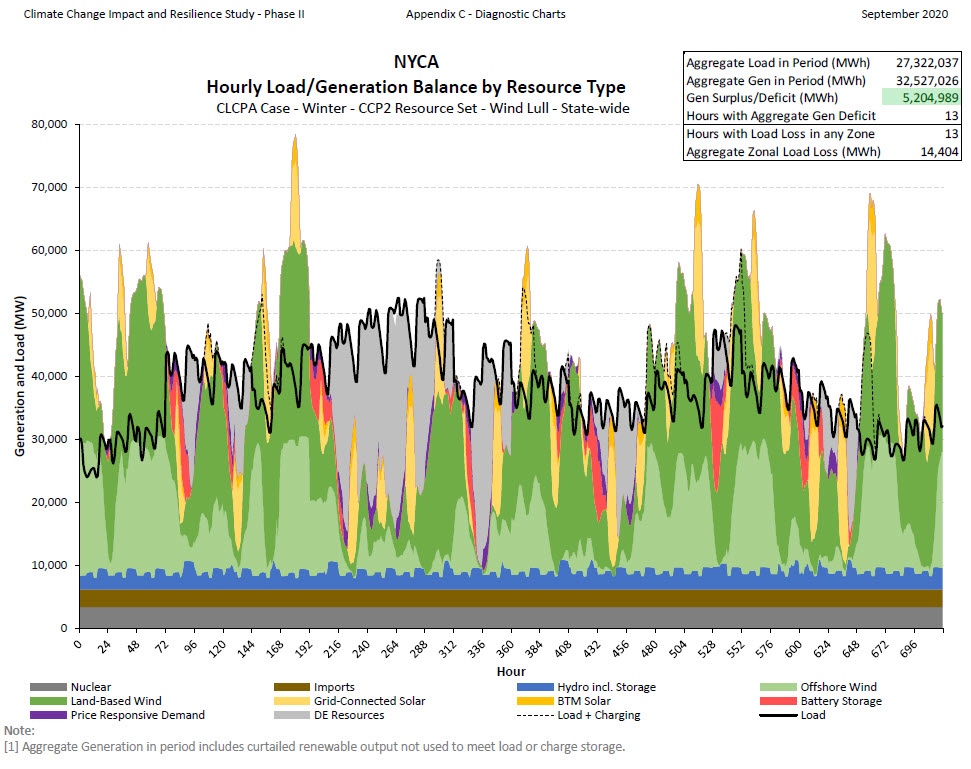
For example, consider scenario 13 which considers CLCPA conditions during a state-wide wind lull in the winter with the set of resources chosen to handle the CLCPA target of zero emissions. Over the 30 day analysis period the Resilience Study estimates that 9,043,988 MWh will be generated by 35,200 MW of land-based wind, 5,288,985 MWH will be generated by 21,063 MW of offshore wind, 503,859 MWh will be generated by 10,878 MW of behind-the-meter solar, 1,951,742 MWh will be generated by 39,262 MW of utility-scale grid solar, 2,027,789 MWh will be generated by 4,486 MW of hydro pondage and run of the river hydro, 2,422,224 MWh will be generated by 4,364 MW of nuclear, 2,023,200 MWh will be imported, 98,672 MWh will be generated by 1,170 MW of pumped storage, 800,462 MWh will be provided by 15,600 MW of battery energy storage over 189 hours, demand response will displace 3,412 MW and 566,429 MWh over 276 hours, and the 32,317 MW of the DE resource will generate 3,653,404 MWh over 278 hours. Over the 30 days 28,380754 MWh will be generated but even these resources will be unable to prevent LOLO totaling 13 hours and 14,404 MWh.
I believe it would be more appropriate for future analyses to consider shorter time periods in greater detail. In this case consider the seven-day period from hour 192 to hour 360. This is the critical period where the most DE resources are required and when the hours with load loss occurred. I think that the uncolored area under the load curve around hour 264 represents the load loss period. Note that battery storage was used up early in the critical period. In order to fully replace all the DE resources MWh would take an extraordinary amount of additional energy storage. Clearly the big problem is a lack of land-based and offshore wind. In the winter, solar is just not going to be able to cover the loss of wind across the state. Furthermore, it is not clear to me that the solar energy output reflects snow cover impacts. It appears that no amount of over-building of wind and solar coupled with battery energy storage is going to be able to solve this renewable resource problem.
The Resilience Study analysis reinforces the fact that the multi-day winter wind lull is a critical period for reliability. In my comments on the resource adequacy hearing and elsewhere I have argued that actual short-term meteorological data from the NYS Mesonet system must be used to correctly characterize the renewable resource availability for New York in general and in areas downwind of the Great Lakes in particular. This type of evaluation is necessary to completely characterize the resource availability during the multi-day winter wind lull. I believe that using those data in conjunction with a meteorological evaluation of the weather systems that cause these conditions could also develop a frequency of occurrence distribution that could be used to extend the Loss of Load Occurrence estimates to Loss of Load Expectation projections.
Independent System Operator – New England (ISO-NE) recently had an analysis done, Analysis of Stochastic Dataset for ISO-NE, that purports to provide frequency of occurrence information. I am not comfortable that they have actually done what they thought they did. In their analysis they used a statistical re-sampling technique that I am not sure adequately considers serial correlation and the relationships between wind and solar resource availability. In their February 20, 2020 presentation to the ISO-NE Planning Advisory Committee, Wind and Power Time Series Modeling of ISO-NE Wind Plants, Methodology and Analysis of Results, they describe a wind mapping system that generates high-resolution mesoscale wind maps. The report notes that “wind generation is very likely to be high during the peak load hour” and goes on to say that “this appears to be due to passing cold fronts associated with strong low-pressure systems that drive wind speeds across New England”. In the February 2020 presentation there is a table with wind turbine power curve basics that shows a cutoff speed for low wind speeds and high wind speeds. I am very sure that the Analysis Group cutoffs were different than the ones used in this study because there is a difference in wind output for wind storms. While another good start I believe that this analysis also comes up short adequately characterizing the lowest renewable energy resource availability period.
Conclusion
The Analysis Group writes: “The variability of meteorological conditions that govern the output from wind and solar resources presents a fundamental challenge to relying on those resources to meet electricity demand.” I agree completely.
In Texas there were seven cold snaps similar to the one that caused the outages in the last 60 years so the frequency of occurrence is 8 divided by 60 or 0.13 events per year. New York’s LOLE standard is 0.1 events per year so the NYISO planning process is supposed to address this kind of event. The relevant question for New York is how often do we expect a multi-day winter wind lull. My answer to that is every year but the intensity varies. For example, from 2/14/21:2300 until 2/15/21:1600 there were 15 of 17 hours when the wind output was less than 10% of the nameplate capacity and all of New York’s on-shore wind turbines produced a total of 765 MWh for a capacity factor of 2.6%. This period wasn’t as intense as the Resilience Study conditions and I did not determine the duration of the wind lull but it was just a random choice. We won’t know how often and how intense these periods are until an analysis specifically designed to evaluate New York’s renewable resource potential is completed using fine-resolution meteorological monitoring data.
As to whether New York’s reliability planning process adequately protects New Yorkers I must reserve judgement. NYISO has the responsibility for this protection but can only guess at what the CLCPA process will propose as its resource mix. Until that time, they cannot do the evaluation work necessary to determine future reliability so it is unfair to pass judgement. I will note however that the Analysis Group and NYISO have identified serious challenges that must be overcome to make a reliable system that meets the CLCPA mandates.
In my opinion, those challenges will prove to be impossible to meet without a marked degradation of reliability. Future posts will explain why I believe that to be the case.


