On December 8, 2020, the New York State Energy Research & Development Authority (NYSERDA) and the New York State Department of Environmental Conservation (DEC) hosted the “Deep Decarbonization Workshop”. Given the enormous challenges ahead of New York trying to transition the electric energy system to be completely free of fossil-fired generation by 2040 I naively assumed that the workshop would focus on decarbonization technologies that could be used to help New York achieve its ambitious Climate Leadership and Community Protection Act (CLCPA) goals. Instead, with one exception, it was an infomercial for solutions that ignored New York’s specific needs and any limitations of the technologies described.
Background
On July 18, 2019 New York Governor Andrew Cuomo signed the Climate Leadership and Community Protection Act (CLCPA), which establishes targets for decreasing greenhouse gas emissions, increasing renewable electricity production, and improving energy efficiency. It was described as the most ambitious and comprehensive climate and clean energy legislation in the country when Cuomo signed the legislation. I have summarized the schedule, implementation components, and provide links to the legislation itself at CLCPA Summary Implementation Requirements.
The CLCPA mandates that a scoping plan outlining the recommendations for attaining the statewide greenhouse gas emissions shall be prepared and approved by December 31, 2021. The Climate Action Council and seven advisory panels: transportation, energy intensive and trade-exposed industries, land-use and local government, energy efficiency and housing, power generation, waste, and agriculture and forestry consisting political appointees and supported by agency staff are charged with this responsibility.
Many of these political appointees were chosen to satisfy particular constituencies rather than for their technical expertise. I maintain that it would be appropriate for them all to be given an overview of how the energy system, in general, and the electric system, in particular work. Without that foundational knowledge I fear that their strategy recommendations will either not be grounded in reality or not be effective solutions. Against that backdrop I hoped the workshop would address this need.
Instead, ”The workshop will feature presentations from nationally renowned technical experts such as the keynote speaker, Saul Griffith, a distinguished energy systems expert, inventor, entrepreneur, and engineer. Mr. Griffith, along with other experts, will discuss the opportunities and challenges around innovative climate solutions such as carbon capture; utilization and storage; green-hydrogen; hydrofluorocarbon replacements and process chemicals; and long-duration storage. The workshop will also feature a roundtable discussion with leading environmental justice advocates across New York State to explore how innovation in decarbonization can help advance environmental justice priorities.”
The CLCPA is the embodiment of the idea that political will can implement policies to meet stringent greenhouse gas reduction targets. I believe many of the appointees accept that without question. If anything, this workshop further misled those people. Nothing in the workshop suggested that there might not be readily available proven technologies capable of replacing fossil fuels, much less the possibility that nothing exists today to solve the multi-day winter doldrum problem. This post briefly describes the presentations and missing context relative to the CLCPA.
Keynote Presentation
Saul Griffith set the tone of the workshop in his keynote presentation. His 15-minute presentation featured 53 slides so you can imagine his carnival barker schtick. Don’t get me wrong the guy is brilliant. According to the Rewiring America website: “As Founder and Chief Scientist at Otherlab, an independent R&D lab, Saul Griffith helps government agencies and Fortune 500 companies understand energy infrastructure and deep decarbonization. He’s been a principal investigator and project lead on federally-funded research projects for agencies including NASA, Defense Advanced Research Projects Agency (DARPA), Advanced Research Projects Agency–Energy (ARPA-e), National Science Foundation and United States Special Operations Command (SOCOM). He was awarded the MacArthur “Genius Grant” in 2007.”
Unfortunately, his spiel is unrealistic magical thinking. The underlying premise of his presentation was that a commitment to electrification and decarbonization makes it substantially easier to meet our energy demands. He claims that 25% of our primary energy needs can be eliminated using distributed renewable energy generation because it reduces energy losses in production and transmission.
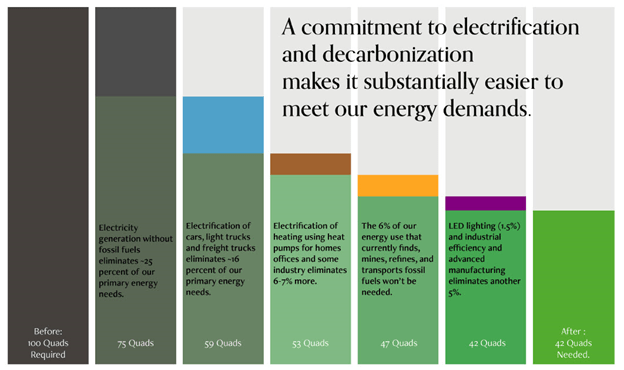
He goes on to claim that electrification of heating using heat pumps for homes, offices and some industry eliminates 6-7% more. He illustrated how that is supposed to work in the following slide.

I will end my description of his presentation with this comment. Griffith is from Australia and lives in the San Francisco area. He is not familiar with the Upstate New York winter reality. Here is my house in a typical winter. His proposed plan is never going to work here. By the way it usually is this cloudy and the snow was not particularly deep in this picture. I can tell because I did not clean the snow off the roof. One other issue with our winters is the occasional ice storm. What do these people think will happen when there is no electricity for extended periods?

Long Duration Storage
Scott Litzelman from U.S. Department of Energy – Advanced Research Projects Agency – Energy gave the most relevant presentation “Long-Duration Energy Storage as a Decarbonization Enabler”. The organizers should have explained the connection between this resource and the E3 analysis Pathways to Deep Decarbonization in New York State – Final Report . E3 has explained that “Firm capacity is the amount of energy available for power production which can be guaranteed to be available at a given time. As the share of variable resources like wind and solar grows substantially, firm capacity resources will be needed to ensure year-round reliability, especially during periods of low renewables output.” While it should be obvious that long-duration storage is needed for firm capacity resources I don’t think that all of the political appointees recognize the enormity of the particular challenge in New York. The workshop squandered what would have been a perfect opportunity to make the point that if they cannot solve that problem this won’t work.
The presentation itself was pretty technical. For the Climate Action Council and Advisory Panel members the presentation should have addressed the specifics of New York’s targets. More importantly, there was no discussion whether the technologies discussed might be ready to be deployed in time for use to meet the CLCPA targets.
Hydrogen
Sunita Satyapal, Director- Hydrogen Program, U.S. Department of Energy, presentation “U.S. Department of Energy Hydrogen and Fuel Cell Technologies Office and Global Perspectives” was a pep talk for a hydrogen economy. For example, he claimed that there has been a 25-fold increase in deployment in the last decade of electrolyzers that produce hydrogen. Whether the world-wide deployment of 25 MW in 2019 offers hope or not was not discussed. Just for context, On September 10, 2020 the Analysis Group presented a discussion of draft recent observations as part of the New York Independent System Operator (NYISO) Climate Change Phase II Study. Their analysis included a generic resource that I think is the biggest problem for the CLCPA. They call this resource the Dispatchable & Emissions-Free Resource. It was “included to maintain reliability during the highest load hours of each modeling period” to “provide the majority of energy on the peak winter hour during the CLCPA load scenario”. Their analysis shows that this category makes up 19% (32,137 MW) of the total capacity for their projected CLCPA load scenario. Clearly hydrogen deployment with a world-wide deployment of 25 MW has a long way to go to provide any meaningful support to the CLCPA. The rest of the presentation described many potential hydrogen technologies but completely ignored the context of the implementation needs for the CLCPA. Completely ignored were the significant technological issues with hydrogen and the weak economic case.
Dr. S. Julio Friedmann, Center on Global Energy Policy, Columbia University gave a presentation entitled “Circular Carbon Economy with Carbon Capture, Carbon to Value, and CO2 Removal”. His circular carbon economy consists of four components: reducing CO2 emissions, reusing CO2 where possible, recycling CO2 by altering their composition, and removing CO2 after it is produced. The emphasis was on carbon capture and sequestration (CCS) in different forms. He claimed there are 20 operating plants that are storing 35 million tons of CO2 per year worldwide. He also claimed that the science and technology is well established. According to the International Energy Agency there were 33 giga tons of CO2 emissions in 2019. In other words, CCS is treating about one thousandth of the world’s emissions. Again, there was no discussion of CCS in the context of New York. Importantly, for it to be viable in New York there have to be locations where it can be stored but that issue was not discussed.
The final presentation, “Keeping cool without warming the planet (alt: heat pumps that don’t heat the globe), Climate Friendly Alternatives for High GWP Hydrofluorocarbons”, was presented by Kristen N. Taddonio, Senior Climate & Energy Advisor, Institute for Governance & Sustainable Development. According to her, hydrofluorocarbons (HFC) have high global warming potential, climate friendly HFC alternatives can avoid up to 0.5 °C of warming and combining energy efficiency can avoid another 0.5 °C of warming. I accept that there are climate friendly alternatives but am a little leery of the claims that 1 °C of warming can be avoided. Just how much warming are they expecting? More importantly is the New York context. New York’s CLCPA 1990 emission inventory only has a total of 0.05 million metric tons global warming potential of HFC (less than 0.1% of the total) and the latest NYSERDA inventory has 10.37 million metric tons global warming potential of HFC which is less than 5% of the total. We will have to wait to see what the current emission inventory fraction of HFC will be but I have no reason to believe it will be a significant fraction of the total emissions inventory.
Conclusion
The CLCPA deep de-carbonization workshop wasted a perfect opportunity to bring some reality to the implementation challenges to: reduce greenhouse gas emissions 40% from the 1990 baseline by 2030, produce all electricity from zero-emission sources by 2040, and reach net-zero by 2050. Based on my observations of panel discussions I believe many of the individuals charged with the responsibility for developing the scoping plan to implement strategies to meet those goals do not understand the enormity of this task. A workshop to explain how energy systems work and quantify how much energy is needed and where to provide reliable power would give the panel members a common basis.
Instead, the workshop mostly reinforced the notion that CLCPA targets will be met because of the political will of the State. Long-duration energy storage is the key need and the presentation provided some hope in this regard. Unfortunately, the presentation did not address the availability or applicability to New York so it is not clear if there is a viable solution to this critical requirement in the timeframe needed. The keynote, hydrogen, and carbon sequestration presentations all sound great superficially but no context relative to the New York needs was given and they all have serious technological or implementation issues. The hydrofluorocarbon presentation showed that there may be a solution to address this greenhouse gas but there was no mention of the fact that this is not a big deal for New York.
Finally, the workshop included an environmental justice representative roundtable discussion. I did not listen to that, there are no slides from it and no recording has been posted.