Balancing the risks and benefits of environmental initiatives
Author: rogercaiazza
I am a meteorologist (BS and MS degrees), was certified as a consulting meteorologist and have worked in the air quality industry for over 40 years. I author two blogs. Environmental staff in any industry have to be pragmatic balancing risks and benefits and (https://pragmaticenvironmentalistofnewyork.blog/) reflects that outlook. The second blog addresses the New York State Reforming the Energy Vision initiative (https://reformingtheenergyvisioninconvenienttruths.wordpress.com). Any of my comments on the web or posts on my blogs are my opinion only. In no way do they reflect the position of any of my past employers or any company I was associated with.
Update 2/26/21: On Date: Fri, Feb 26, 2021 at 1:44 PM Suzanne Hagell, PhD, a Climate Policy Analyst, Office of Climate Change from the New York Department of Environmental Conservation responded to the email that precipitated this post. The response is added at the end. I will leave it to the reader to determine if the response was appropriate.
I have been trying to get involved and stay involved in the Climate Leadership and Community Protection Act (CLCPA) implementation process over the past year. This post documents the lack of responsiveness within the process to this point.
According to the Climate Act webpage the Climate Action Council will lead the transition:
The New York State Climate Action Council (Council) is a 22-member committee that will prepare a Scoping Plan to achieve the State’s bold clean energy and climate agenda. The Council will also oversee the establishment of sector-specific advisory panels and working groups and will work in consultation with the Climate Justice Working Group and the Environmental Justice Advisory Group.
In order to get involved with the process I have been following the advisory panel activities as well as I can. The webpage explains how the public can provide input:
The advisory panels of the Climate Action Council and the Just Transition Working Group will host public meetings throughout 2021. The advisory panels will hold sector-specific discussions that will provide recommendations to the Council for consideration as it develops a Scoping Plan to achieve New York’s ambitious greenhouse gas reduction targets. The Just Transition Working Group will help ensure an equitable transition for New York’s workforce in the State’s renewable energy economy.
The Advisory Panel meetings and materials page announces meetings and provides summaries of the public meetings. However, the lack of updates in general and the process in particular does not lend itself well to providing meaningful comments. In the first place the Power Generation panel has not updated its meeting materials for three weeks despite the fact that there have been two meetings held at the date of this writing. I blame that panel for some of the lack of responsiveness.
However, there is a systemic problem. At the bottom of the page it says “Past meeting materials are updated on this page every Friday. Meeting notes and presentations received from Panels by 5 p.m. ET. Tuesday will be added to the website by Friday of that week.” I take issue with it taking three working days to get ready to post the material. That is not that big an effort but is an inconvenience for some state worker. Furthermore, why wait until Friday? If the State process truly wants to have public involvement then assign several people who make posting material received from the advisory panels within two working days.
Unfortunately, that is not the biggest problem. The CLCPA law mandates that there be public involvement. However, whether any of the information received is actually considered by any of the panels or addressed by any of the agencies is another matter.
Consider, for example, that I found an error in New York State guidance document Establishing a Value of Carbon, Guidelines for Use by State Agencies (the “Guidance”). I sent an email to several staff who I know have responsibilities associated with the issue and two weeks after submitting my comments I have not received any response.
In particular the Guidance includes a recommendation how to estimate emission reduction benefits for a plan or goal. I believe that the guidance approach is wrong because it applies the social cost multiple times for an emission reduction so I recommended that the Guidance be revised.
In the Guidance section entitled “Estimating the emission reduction benefits of a plan or goal” an example is included that states:
The net present value of the plan is equal to the cumulative benefit of the emission reductions that happened each year (adjusted for the discount rate). In other words, the value of carbon is applied to each year, based on the reduction from the no action case, 100,000 tons in this case. The Appendix provides the value of carbon for each year. For example, the social cost of carbon dioxide in 2021 at a 2% discount rate is $127 per metric ton. The value of the reductions in 2021 are equal to $127 times 5,000 metric tons, or $635,000; in 2022 $129 times 10,000 tons, etc. This calculation would be carried out for each year and for each discount rate of interest.
The IWG damages approach value is the net present benefit of reducing carbon dioxide emissions by one ton. The calculation methodology determines that value from the year of the reduction out to 2300. It is inappropriate to claim the benefits of the annual reduction over any lifetime. Consider that in this example, if the reductions were all made in the first year the value would be 50,000 times $127 or $6,350,000, but the guidance approach estimates a value of $37,715,000 using this methodology.
I did not catch this error until after the comment period ended so I sent the email. However, in my comments on their stakeholder webinar I made the comment that the New York State Energy Research and Development Authority practice of calculating lifetime savings in a similar fashion was incorrect. In order to verify my understanding, I contacted Dr. Richard Tol, Professor of the Economics of Climate Change at Vrije Universiteit Amsterdam and a Professor of Economics at the University of Sussex who has direct experience estimating the social cost of carbon. He graciously responded and explained that “The SCC should not be compared to life-time savings or life-time costs (unless the project life is one year).”
My email concluded that the Value of Carbon guidance example methodology in the Guidance section “Estimating the emission reduction benefits of a plan or goal” inappropriately considers lifetime benefits. That is inconsistent with social cost damages approach methodology used to derive the social costs so it should be revised.
Conclusion
While the CLCPA mandates that the public be involved in the development of scoping plan, those are just words and the reality is different. The system does not encourage meaningful participation because meeting information is available promptly after the meetings. There is no indication that the panel members are aware of comments received. Worse is the lack of response from agency staff responsible for guidance documentation when errors were noted. I posted this article to document these issues.
Update 2/26/21: In response to the email I sent Wednesday, February 10, 2021 2:27 PM I received this:
From: Hagell, Suzanne E (DEC)
Date: Fri, Feb 26, 2021 at 1:44 PM
Subject: Re: Value of Guidance Document Emission Reduction Benefit Calculation Example
To: Roger Caiazza
Cc: Pandich, Jason P (DEC)
Hi, Roger. My apologies for not getting back to you right away. This is really useful. Jason and I will take a look at the issue that you’re raising and talk to our colleagues at NYSERDA as we develop the accounting for the Scoping Plan.
I expect that we will be making additional updates to the Value of Carbon guidance and this would be one update that could be addressed.
According to Bloomberg Law, Biden’s Hefty Clean Air To-Do List Follows Early Big Promises means that air quality standards have to be revised and must incorporate social justice and climate concerns. Based on what I have seen this push will rely less on science and more on emotion.
The Bloomberg article states:
“Revising clean air rules is a cornerstone of climate and justice policies, two areas that the Biden administration has set as priorities. Clean air experts in areas that carry a disproportionate burden of dirty air say that runaway air pollution remains a chronic problem, reflecting neglect of low-income neighborhoods and communities of color, exacerbated by air monitor disparities.”
“Portable air quality monitors used in the South Bronx and Brooklyn caught particulate matter quantities 20 times higher in some areas than levels reported by state-run monitors, according to new data from a neighborhood-level air monitoring study by the New York City Environmental Justice Alliance, or NYC-EJA. The findings highlight insufficient air monitoring for targeted environmental justice communities, and show why one generalized air policy may not be enough to mitigate pollution for hard-hit areas, said Jalisa Gilmore, research analyst for NYC-EJA. “That’s why we have a little bit more emphasis on hyper local monitoring, and making sure that we actually get the interventions that are most appropriate for the community,” she said.”
“Because New York City has only 13 high-performance ambient air monitoring sites, air pollution exposures are poorly characterized at the neighborhood level. To address this data gap, CAMP-EJ utilized dozens of low-cost, portable air quality monitors to measure hyperlocal air quality and characterize air pollution exposures at more refined spatial and temporal scales than is possible using existing City and State data. The results of our air monitoring campaign shed light on the disproportionate public health burdens imposed on environmental justice communities from industrial pollution, trucking, and transportation infrastructure.”
The analysis found that local facilities and expressways are big polluters, traffic congestion fouls the air twice every day, and that hyperlocal measurements show inhalable particulate matter are twenty times higher than state-run monitors. I was not surprised by the first two findings but the claim that hyperlocal measurements were much higher than state-run monitors surprised me.
I have experience running air quality monitoring networks with particulate matter monitors. I found that measuring particulates was always difficult to do correctly and more so with smaller aerodynamic particles like the inhalable or 2.5 micron particles. In the project, “CAMP-EJ participants used the AirBeam2, a low-cost, palm-sized air quality instrument that measures PM2.5, and AirCasting, an open-source environmental data visualization platform that consists of an Android app and online mapping System”.
The going price for an AirBeam 2 is around $250 and the state-run monitors systems use instruments that go for $25,000. The state-run system has a detailed quality assurance plan and includes quality control tests which I doubt were included in the community monitoring program so my first thought is just how accurate are these personal monitors? According to the report: “The AirBeam2’s PM2.5 measurements are “quite accurate” according to a performance evaluation conducted by South Coast Air Quality Management District, which compared the performance of the AirBeam2 to reference monitors.”
However, the South Coast Air Quality Management District evaluation report I found told a different story. Three sensors were tested against a reference FEM FRIMM PM 2.5 monitoring instrument similar to the one used in the New York State network. According to the concluding discussion:
“Accuracy: Overall, the three AirBeam sensors showed very low accuracy compared to FEM GRIMM at 20 °C and 40% RH, when varying PM2.5 mass concentration from 10 to 50 μg/m3. The AirBeam sensors significantly overestimated the FEM GRIMM readings. According to the method of calculating accuracy, the % accuracy for the sensors were all negative. When PM2.5mass conc. was over 50 μg/m3, Airbeam sensors reached plateau of 315 μg/m3.”
Don’t get me wrong, I have no doubt that the CAMP-EJ main conclusions, local facilities and expressways are big polluters and traffic congestion fouls the air twice every day, are correct. However, the monitors used over-estimated inhalable particulate concentrations considerably, particularly at the higher rates they claimed are hurting local communities. As a result, the numbers that they claim prove the need to act are incorrect.
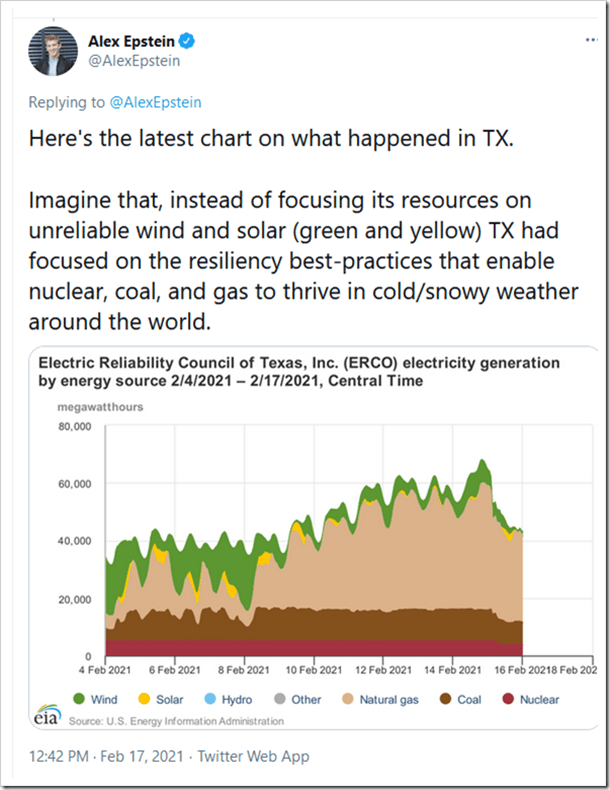
A friend recently posted information on Facebook that the Texas blackout situation was a “literal perfect storm test if an all-renewable energy plan would work”. The Facebook police posted a warning that there was “missing context” but I will explain why there was missing context in the missing context claim.
I while away my time in retirement publishing a blog on New York environmental and energy issues and have written extensively on New York’s attempts to address climate change by reducing greenhouse emissions. For this context I wrote a post explaining the lessons that should be learned by New York in their quest to save the planet and another responding to a newspaper article asking whether something similar could happen in New York. Short answers: New York has to be very careful with their plans or they will end up in the same situation as Texas in the future and New York’s electricity market is currently structured differently than Texas so it is very unlikely that the same thing could happen today.
The Facebook missing context check claims that because failure of natural gas and other fossil sources was the primary problem with the blackouts this February it is unfair to claim this was an appropriate test of an all-renewable energy plan. However, their arguments fail to consider a couple of things.
In the first place the claim in the post was that this was a test of an all-renewable energy system. One way to consider generating availability is the capacity factor which is the actual electricity generated divided by the maximum electricity possible. If we look at the capacity factors for Texas generation types during the crisis, midnight 2/15 to noon 2/18, then we can try to determine the cause of the crisis. None of the energy sources performed particularly well. It is clear that in all-renewable energy system a lot would have to be done to replace the lack of wind and solar generation. Note that 30,000 MW of wind at a cost of some $70 billion producing 650 MWs when it was desperately needed is a failure on the magnitude of the Maginot Line in World War 2. My first problem with the fact checkers is that even though the fossil plants failed to do well in this situation, the resources needed to keep the lights on in an all-renewable energy system for a future situation would be so immense and so expensive that they may not be feasible and that was the point of the claim.
Figure 1 ERCOT Capacity Factors 2/15/21:0000 to 2/18/21:1200
In my opinion the actual root cause to the problem is that the Texas energy market only pays generators when they produce power. Most other electric markets pay generators for capacity or the ability to provide electricity when it is needed. Texas had a very similar situation ten years ago which also led to blackouts. If you don’t pay generators to be available in critical if rare situations they simply will not invest for those periods. In this case, the wind mills could have spent extra for cold weather upgrades, the natural gas infrastructure could add heat tracing so equipment did not freeze, and the nuclear plants could have protected their water systems and this catastrophe could have been avoided. All of that would have been done if the market paid for capacity.
There is a bigger problem associated with the lack of a capacity market in Texas that the Facebook fact checkers completely ignore in their missing context claim. A former electric utility planning engineer described his impression of the problems that lead to the debacle and noted that the purpose of the payment for energy only market strategy was “to aid the profitability of intermittent wind and solar resources and increase their penetration levels.” Put another way, because renewables don’t provide capacity that means having a capacity market disadvantages renewables.
I conclude that the Facebook fact checkers were more interested in damage control against claims that renewable energy has weaknesses than objectively addressing the claims. The original claim is that an all-renewable energy system would most likely fail even more under the conditions that occurred and that has nothing to do with the fact that fossil fueled sources failed in this event. The other flaw in their fact check is that the ultimate cause of the failure, payments only for energy, is the preferred approach for renewables advocates. If they get their way blackouts will be inevitable.
On February 17, 2021 Rick Karlin at the Albany, NY Times Union wrote an article comparing the Texas electrical grid and the New York grid relative to the power failures in Texas caused by extreme cold. I agree with his conclusion that New York’s grid is sufficiently different than Texas so that something similar is unlikely to happen in New York. However, I disagree with the experts that he interviewed that believe the primary problem going forward is the transmission system. Instead, I think that trying to meet the Climate Leadership and Community Protection Act (CLCPA) zero-emissions mandate by 2040 for the electric system is the biggest challenge to future electric system reliability.
Mr. Karlin interviewed a number of experts who argued that a mass failure of the state’s power grid was unlikely for a number of reasons. However, he went on to say “that doesn’t mean Empire State residents don’t have other threats to worry about.” First, I will comment on the statements from the experts and then I will argue that their transmission threats are secondary to what I think is the primary threat for a future blackout.
I agree that one of the Texas problems is that their power grid has relatively few links to other transmission systems. Karlin quoted Luigi Vanfretti, a professor of electrical engineering at Rensselaer Polytechnic Institute, who said “It’s about the ability to route the power”. In this line of thought, if one state has a shortfall, electricity can easily be moved from another state. Nick Bassill, a meteorologist and director of research and development at the University at Albany’s Center Of Excellence in Weather and Climate Analytics claimed that “Neighboring Oklahoma was also hit with record cold and snow but they didn’t have the mass outages Texas did since they could easily get power from other states”. However, since the time of the article it became clear that neighboring grids were having similar problems and their own outages. In the final analysis I believe that this is not the root cause of the problem.
Karlin pointed out a difference between Texas and New York is that Texas power plants “operate with looser regulations compared to New York, particularly when it comes to the Empire State’s stringent rules about having certain levels of capacity and spare fuel”. He explained that:
“Power plants in New York have to demonstrate a certain maximum capacity, or the amount of power they can produce running at full steam, even though they may only rarely have to do so. These requirements are enforced through credits that can be sold in a capacity market, which Texas doesn’t have. There’s more. In New York City, for instance, gas plants, which typically use either gas or oil, must have backup supplies of oil in case there is a gas line disruption or shortage.”
Another claimed difference is that Texas is heavily reliant on natural gas and wind whereas New York has a more diversified energy supply. Although some have blamed the lack of wind production during the outage as a primary driver “most experts contacted by the Times Union said the stuck turbines were minimal compared to the frozen gas infrastructure”. “The gas pipes freezing was key,” said Vanfretti. In New York Karlin explained that:
“Thirty nine percent of New York state’s power comes from fossil fuels meaning the plants can burn gas or oil (gas has been in favor lately due to low prices). Another 22 percent is hydropower and about 30 percent is nuclear, as of 2019. Wind was 3 percent as of 2019.”
Karlin also explained that “Texas isn’t built for blizzards”. Clearly “homes as well as gas line infrastructure in Texas aren’t designed or built for snow and cold, just as New York isn’t built for extreme heat.” He went on to say that:
As temperatures plummeted, Texans turned their electric heaters or gas furnaces to the maximum, putting extra demand on gas lines that would normally feed power plants, leading to rolling blackouts. “When you’re plunging down close to zero in northern Texas, suddenly there is a huge demand for heating,” said UAlbany’s Bassill, meaning that there may not be enough for power plants. “It’s the worst of both worlds.”
Finally, Karlin argued that New York’s bigger threat “likely lies with the state’s creaky system of power lines – many of which are above ground and vulnerable to storm damage”. He explained that:
Venfretti believes the outdated transmission system, along with what he said is the primitive 1980s-era hardware used to monitor and control many power line substations, are among the biggest vulnerabilities. The push for clean renewable energy is driving innovation in power generation but the transmission part of the equation is lagging, said Venfretti. It’s like a person buying a shiny new Mercedes to drive down a crumbling pot-holed road. “The last thing people think about is the road they are going to drive their Mercedes on,” he said.
My Take on the Differences Between New York and Texas
I posted an article on the Texas situation and its implications for New York energy policy on February 18. One distinction between this article and my analysis and a couple of others I found is that we addressed the systemic cause more than the specifics of this energy problem. Ultimately the problem boils down to the importance of reliability. In 2001 the draft New York energy policy stated: “Greater diversity in the types of fuel used for energy production could benefit all market participants, ensuring adequate fuel supplies and dampening price volatility.” Everyone in the energy planning process at that time took as a fundamental principle that diversity meant a balanced and diverse portfolio with different kinds of dispatchable electric energy: coal, natural gas, oil, nuclear, and hydro. The greater diversity mantra included different ways to transport oil and coal including railroads and barges as well as the ability to have fuels that could be stored for use as needed. I believe that the New York energy planners who incorporated that mantra developed an energy system that is much more resilient to extreme weather than the Texas system.
The systemic problem is the failure of Texas to include capacity payment in their market. If the system is unwilling to pay for the power needed during rare events then the inevitable result will be a blackout. It is incredible to me that a similar problem occurred in 2011 and that steps were not taken to fix them in ten years. A former electric utility Planning Engineer has described his impression of the problems that lead to the debacle. He agrees that the particular problem is that Texas only pays for the energy produced. As a result, there is no incentive to develop the capacity needed for rare extreme conditions so when it was needed it simply was not there. Importantly, he believes that the purpose of the payment for energy only market strategy was “to aid the profitability of intermittent wind and solar resources and increase their penetration levels.”
It appears to me that there is a shift to the same mis-guided policy priorities now underway in New York. Planning Engineer explains that “Having a strong technical knowledge of the power system along with some expertise in finance, rates and costs can help one see the folly of a variety of policies adopted to support many of today’s wind and solar projects. Very few policy makers possess anything close to the skill sets needed for such an evaluation. Furthermore, while policy makers could listen to experts, their voices are drowned out by those with vested interests in wind and solar technology who garner considerable support from those ideologically inclined to support renewables regardless of impacts.” This describes New York’s Climate Action Council and advisory panel Climate Leadership and Community Protection Act process perfectly.
Karlin interviewed Gavin Donohue, president and CEO of the Independent Power Producers of New York, who explained that New York’s current diversity of power sources provides a measure of resiliency. Note, however, that when New York outlawed the use of coal at power plants they eliminated a source of power that used a fuel that could be stored on-site and stockpiled for emergencies. The Climate Act eliminates the use of fossil fuel by 2040 further reducing balance, diversity, and flexibility to handle weather related load peaks. It is not clear what will be needed to replace those attributes in the future.
Karlin also noted extreme weather events such as the derecho windstorms that took out power for several days in the Capital Region last fall, Superstorm Sandy in 2012, and the massive ice storm that in 1998 left eastern Ontario, Quebec, New Brunswick and a sliver of northern New York without power for weeks. While that wasn’t due to problems in power plants or a lack of alternate fuels, a diverse and balanced energy system is better able to address the impact of miles and miles of downed power lines.
Up to this point I only had minor issues with the article but then he wrote:
Others stress that redundancy going forward should be in renewables, given the climate havoc that greenhouse gases have caused. “We need to be moving as swiftly as possible to 100% renewable energy,” remarked Peter Iwanowicz, executive director of Environmental Advocates NY.
Contrary to popular impression it is extremely unlikely that weather events associated with changes in the climate observed to date can be attributed to greenhouse gas impacts. Advocates constantly confuse weather and climate and every time I have examined a weather event supposedly associated with climate change I have not been able to find a climatic change effect. Following the usual pattern, there already are claims that the power system impacts were somehow due to climate change and not inadequate planning for this kind of extreme weather event. Ten years ago, in February 2011, there was a similar extreme cold snap and blackouts also resulted because “coal and natural gas plants and electric utility companies didn’t have the resources to maintain service.” If these conditions happened ten years ago then changes in climate did not increase the need for planning to meet events of the recent past.
Even more problematic is the suggestion that “moving as swiftly as possible to 100% renewable energy” will make society more resilient because there will be more redundancy. The fact is that calling wind and solar diverse and redundant is a gross mis-characterization. Solar energy is not diverse when every single solar facility in the state goes off-line at night. Wind energy is not redundant when the winds are calm at night. I believe that a comprehensive analysis of the New York joint frequency distribution of wind and solar energy resource availability is needed to determine the worst-case reliability needs scenario. It is imperative to consider wind and solar availability over the same period and given that Texas extreme weather had a 10-year reoccurrence period I would say that the analysis should consider a minimum of ten years. When the wind and solar resource availabilities are known then, and only then, can the wind, solar and energy storage resources necessary to prevent cold weather blackouts be established. This has not been done.
Ultimately the problem is that the worst-case wind and solar renewable resource availability period is rare. Keep in mind that New York’s Climate Act intends to reduce all fossil fuel emissions so heating and transportation will also have to be electrified. That means that all the smart planning in the world is not going to be able to shave peak loads much if any. If the worst-case resource availability period is associated with a period of high energy use then the electric system will be stressed. In order to be able to provide adequate power during those periods will require expensive energy storage solutions which have not been identified in the Climate Act implementation process.
Conclusion
For the most part I agree with the conclusions in Karlin’s article. Up until this time the chances of extreme winter weather causing an electric energy shortage in New York similar to Texas are essentially nil. Energy planners in State agencies, the Power Pool and at the utilities were committed to preventing it by developing an electric energy system with different kinds of dispatchable electric energy, developing on-site fuel storage with inventories able to cover extreme cases and enabling transport and delivery alternatives. Their foresight and commitment have given us a resilient electric system.
However, under the Climate Act everything changes when wind and solar replace fossil fuels. The article did not mention that one reason that Texas does not have a capacity market is that payment for energy only was to aid the profitability of intermittent wind and solar resources and increase their penetration levels. In New York’s electric market regulators are wrestling with a market design that can provide the appropriate signal for investors to provide power during the rare worst-case weather conditions that caused the Texas power failures. That will be an experiment that may or not may be successful.
The experts interviewed believe that problems with the transmission system will be the biggest future vulnerability. I disagree because I believe that reliance on just wind and solar during worst-case weather conditions is going to be a much bigger problem. The fact is that there are inherent advantages to fossil fuels that cannot be easily overcome with intermittent and diffuse wind and solar. At one time the New York energy planning process was more concerned about reliability and affordability for New York ratepayers than catering to ideological activists whose precautionary fears of potential climate change impacts override consideration of unintended reliability outcomes and costs. I conclude that a Texas energy debacle is currently unlikely today but inevitable if New York’s Climate Act is implemented as currently mandated.
As I watched the Texas energy debacle unfold the last several days, I thought that I would end up posting an article about the implications for New York’s Climate Leadership and Community Protection Act (CLCPA). This is my first response. It is becoming clear that the rolling blackouts and exorbitant electric prices that occurred in Texas were related to a lack of market support for diversity and resilient generation. There is no question in my mind that the CLCPA electric system envisioned by the Climate Action Council will be even less diverse and resilient so something similar in New York is inevitable if the transition unfolds as I expect.
As I write this on February 18, 2021 the causes of the electric system problems in Texas are unknown. What is certain is that power outages left millions in the dark and without heat when a bitter cold snap brought snow, ice and temperatures in the single digits. Electric loads hit record levels even as the electric system operators instituted rolling electric outages to reduce the power used in order to prevent even bigger blackouts. There also appear to be issues with the generators not being able to provide enough power. The wind resources were way down because of icing but apparently the natural gas fired units had trouble getting sufficient gas to run because the priority was for residential use.
I have one anecdote that may be relevant. When New York State deregulated the utility companies and I left Niagara Mohawk Power Corporation to go with NRG Energy who purchased the fossil plants I supported, one of the cultural awakenings was going to other power plants across the country. One vivid memory was a visit to the massive Parish power plant outside of Houston and being able to see all the infrastructure. I have heard that visitors from the south were also similarly impressed when visiting northern power plants and not being able to see all the infrastructure because the power house was enclosed. The reason northern power plants are enclosed because trying to run a power plant when things freeze is very difficult. I have heard that there are indications that monitoring equipment and water lines were failing due to the cold Texas weather.
One other note is that claims that these impacts were somehow due to climate change and not inadequate planning for this kind of extreme weather event are complete baloney. Ten years ago, in February 2011, there was a similar extreme cold snap and blackouts also resulted because “coal and natural gas plants and electric utility companies didn’t have the resources to maintain service.” If these conditions happened ten years ago then the root cause is weather and not climate. Anyone claiming otherwise is ill-informed, naïve or lying.
Diversity and Resiliency
At one time the New York energy planning process was more concerned about reliability and affordability for New York ratepayers than catering to ideological activists whose precautionary fears of climate change override consideration of unintended consequences. For example, the Draft New York State Energy Plan and Draft Environmental Impact Statement dated December 2001 includes this ultimate truth: “Greater diversity in the types of fuel used for energy production could benefit all market participants, ensuring adequate fuel supplies and dampening price volatility.” Unfortunately, the first inklings of the renewable energy initiatives to come also showed up: “Moreover, a balanced portfolio of energy resources provides greater economic development opportunities within the State, particularly in the development of indigenous energy resources, including renewable energy resources, and energy service reliability.”
The 2001 draft was the oldest energy plan I could find. You will have to trust me when I say that everyone involved in this energy plan and earlier iterations, took as a fundamental principle that diversity meant a balanced and diverse portfolio with different kinds of dispatchable electric energy: coal, natural gas, oil, nuclear, and hydro. The greater diversity mantra included different ways to transport oil and coal including railroads and barges as well as the ability to have fuels that could be stored for use as needed. Arguably New York’s concern for reliability and avoiding blackouts is linked to New York City blackouts and the looting and vandalism that occurred during the 1977 blackout. After every blackout extensive steps were taken to prevent a re-occurrence due to the same conditions and, more importantly, drove self-examination to address similar situations that might cause blackouts. Although this process improved resiliency that term was not in use in 2002 and it was not used once in the draft energy plan.
In my opinion the Texas debacle occurred because the energy regulators failed to manage the system to address the problems that occurred in 2011. Epstein persuasively explains that a large part of the reason that they did not address those problems was because energy policy priorities were hijacked to policy that has prioritized the adoption of unreliable wind/solar energy over reliable energy. A former electric utility Planning Engineer has described his impression of the problems that lead to the debacle. He thinks that the particular problem is that Texas only pays for the energy produced. As a result, there is no incentive to develop the capacity needed for rare extreme conditions so when it was needed it simply was not there. The purpose of the payment for energy only market strategy was “to aid the profitability of intermittent wind and solar resources and increase their penetration levels.”
It appears to me that the same mis-guided policy priorities are underway in New York. Planning Engineer explains that “Having a strong technical knowledge of the power system along with some expertise in finance, rates and costs can help one see the folly of a variety of policies adopted to support many of today’s wind and solar projects. Very few policy makers possess anything close to the skill sets needed for such an evaluation. Furthermore, while policy makers could listen to experts, their voices are drowned out by those with vested interests in wind and solar technology who garner considerable support from those ideologically inclined to support renewables regardless of impacts.” This describes New York’s Climate Action Council and advisory panel process perfectly.
What About New York?
In the early afternoon of February 15, I found out about the Texas problems and on a whim checked the New York Independent System Operator real-time dashboard to see what how much wind energy was available from the 24 facilities and nameplate capacity of 1,985 MW. In hour 12 the entire on-shore wind fleet of New York generated 2 MWh. Later I downloaded data and found that from 2/14/21:2300 until 2/15/21:1600 there were 15 of 17 hours when the wind output was less than 10% of the nameplate capacity and totaled New York’s on-shore wind turbines produced a total of 765 MWh for a capacity factor of 2.6%.
What about solar? The NYISO does not provide solar generation data like it does for wind. However, we know that nine hours were basically dark so there was no solar. The CLCPA goal is 6,000 MW by 2025. That much solar and New York’s 2020 on-shore wind turbines that produced a total of 519 MWh those nine hours results in a pathetic capacity factor of 0.7%. I also used the NYS Mesonet data to estimate that the total solar insolation available on February 15 was around 16% of the insolation available at the peak of availability near the summer solstice when the days are longest. Clearly relying on wind and solar when these conditions occur is going to be a challenge because energy storage will be required to bridge the gap.
In 2040 all electricity currently produced by fossil fuels is supposed to be produced by zero emissions sources. The “vested interests in wind and solar technology who garner considerable support from those ideologically inclined to support renewables regardless of impacts” intend that the replacement power will come from wind and solar. Over the entire 17-hour winter doldrum fossil units produced 1,424,942 MWH and during the no-solar 9-hour period fossil units produced 588,838. The best thing that can be said is that at least load is low in the early morning when solar energy is non-existent. However, that does not help the fact that a minimum of 1,424,942 MWH less whatever solar energy can come from hopefully not snow-covered solar panels will have to come from storage.
Note that a more detailed analysis to determine when wind and solar was able to replace all the energy produced by fossil units is needed to determine the total needed. Assuming that the total energy will be at least equal to the 15-hour period energy when solar energy included and that the energy storage systems can provide power for four hours that means that 356,911 MW of energy storage are needed. New York’s energy storage goal is 3,000 MW of energy storage by 2030. That means that a minimum of two orders of magnitude more energy storage is needed just to cover this one period chosen simply by chance. I believe that the State must do a comprehensive analysis of the joint frequency distribution of wind and solar energy resource availability to determine the worst-case reliability needs scenario. It can be argued that even that analysis is inadequate because it would presume that wind and solar generating sources haven’t been damaged by an ice storm. If New York fails to do this kind of analysis then an energy debacle comparable to Texas is the inevitable result.
Conclusion
The fact is that there are inherent advantages to fossil fuels that cannot be easily overcome with intermittent and diffuse wind and solar. In the past the chances of extreme winter weather causing an electric energy shortage in New York were essentially nil. Energy planners in State agencies, the Power Pool and at the utilities were committed to preventing it by developing an electric energy system with different kinds of dispatchable electric energy, developing on-site fuel storage with inventories able to cover extreme cases and enabling transport and delivery alternatives. In the future, however, politicians have subverted energy policy for their agendas pushing reliance on just wind and solar. That is going to be an extreme challenge and calling that kind of system “diverse” is simply wrong.
To date all the analyses of wind and solar extremes have been limited to separate evaluation periods over shorter periods than I think are needed. It is imperative to consider wind and solar availability over the same period and given that Texas extreme weather had a 10-year reoccurrence period I would say that the analysis should consider a minimum of ten years. When the wind and solar resource availabilities are known then, and only then, can the wind, solar and energy storage requirements to prevent cold weather blackouts be established.
I encourage you to read Planning Engineer’s description of his impression of the problems that caused the Texas energy debacle. New York’s de-regulated electric market is going to have to develop a market mechanism to support both the wind and solar generation facilities but also the energy storage needed to provide all the energy needed for a cold snap and the increased load when heating and transportation are electrified. For example, say that the CLCPA planners determine that 200,000 MW of energy storage are needed to meet 90% of the energy requirements annually for their wind and solar development scenario, but 300,000 MW is needed for 95%, and 400,000 is needed for 99.9%. Using those numbers means that 100,000 MW of energy storage will have to be supported in only 4.9% of the year so prices must be very high for a market solution. Renewable energy advocates claim that “smart planning”, which I believe incorporates real-time pricing, will reduce the peaks but that is only theory. The more likely reality is that because energy is really needed during these extreme weather events people will do whatever it takes to stay warm and end up paying exorbitant prices for that power. It cannot end well for those least able to pay for their energy needs.
I conclude that a Texas energy debacle is currently unlikely today but inevitable if the CLCPA is implemented as currently mandated.
The 3 February 2021 Power Generation Advisory Panel included a chance for public input that deserves comment. Twenty-three people were given two minutes to speak. More than half the presenters argued that nuclear power needs to be considered. Only three speakers representing environmental advocacy or justice spoke. Finally, the concluding thoughts of Department of Public Service Commissioner Rhodes claimed that the process has been unbiased.
At the 3 February 2021 Power Generation Advisory Panel there was a brief overview of the efforts of the Climate Action Council and the panel’s focus areas and discussions to date. Most of the meeting was opened to the public to provide their thoughts and input. The meeting notes provide a brief summary of those comments and I have summarized the speaker’s affiliations and categorized their positions in a table. My speaker categories included customer advocates, environmental justice and environmental activists, renewable energy development advocates, and a couple of people representing miscellaneous concerns.
I was surprised by the number of people who spoke out for nuclear power and I suspect so was the Panel. I believe they were all associated with a pro Indian Point group. All their comments were similar. Clearly shutting down 2,000 MW of zero emission nuclear generating capacity is counter-productive if you really believe that climate change caused by anthropogenic greenhouse gas emissions is the existential threat used as the rationale for the CLCPA. Commenters pointed out that CO2 emissions will go up as a result of the shutdown and that developing additional nuclear power should be considered as a strategy for the zero-emissions future.
I was also surprised by the fact that there were only four people arguing that wind and solar development needs to be supported more and accelerated. I am not sure about the propriety of an organization represented on the panel to have a speaker present public comments. Two people claimed community solar deserves more support. The final speaker in this category was from Generate Capital, a sustainability investment firm who suggested new renewable technology is ready to implement.
I was one of two consumer advocates speakers. It is difficult to say much in two minutes but I tried to point out concerns with affordability, reliability and feasibility. The other speaker also addressed affordability and made the point that investments have be prioritized and cost-effective.
I was shocked that only three environmental activists spoke and two of them were worried about specific issues. The one true believer said we have to act faster because we are running out of time. I predict that future public sessions will be inundated with people making those claims and suggesting that wind and solar will solve all energy problems. A lady from Fossil Free Tompkins County complained that behind the meter natural gas facilities are inimical with the CLCPA and that allowing a former coal-fired power plant to run on gas was wrong. The environmental justice speaker was worried about a gas pipeline that was being built in her neighborhood.
The last two categories only had one speaker. One lady who was worried about renewable development equity because most of the renewables will be sited Upstate and coincidentally some near her. A student in a masters program in sustainability made the good point that reginal planning efforts to date have concentrated on transportation and more emphasis should be placed on renewable development.
Rhode Concluding Remarks
The lead person for the panel is Department of Public Service Commissioner John Rhodes. I will end this post with an evaluation of his remarks. The meeting notes described his concluding thoughts as follows:
Appreciates and takes seriously the various comments that have been made. A thread of pro-nuclear environmentalism has been quite a presence of this chat.
Assures everyone that nothing nefarious in the composition of the panel.
Panel was selected by the CAC after a lot of input and deliberation, no bias desired, trying to make the most helpful recommendations.
Panel able to respond with better recommendations now that public has voiced this input
I believe that “thread of pro-nuclear environmentalism has been quite a presence of this chat” confirms my suspicion that the agency staff who are supporting this panel had no idea that was going to happen. They are going to have to go into damage control mode because the arguments that retiring Indian Point is counter-productive are persuasive. I suspect that the response will be to close ranks and ignore the issue.
The other nuclear speaker concern was that there was no one representing nuclear issues on the panel. Rhodes response rings hollow. He claimed that there was nothing nefarious in the composition of the panel. Based on the definition “infamous by way of being extremely wicked: wicked in the extreme; heinous; abominable; atrociously sinful or villainous; or detestably vile” that may be true but claiming that no bias was desired is baloney.
I researched the membership of the Power Generation Advisory Panel last year. The CLCPA Power Generation Advisory Panel attachment summarizes each member with a link to their organization including, where appropriate, a brief description of their organization’s mission, along with a summary of the individual named to the panel. In order to be unbiased, the membership of the panel should have included members with expertise in all energy sectors. The lack of a nuclear representative is a concern but the lack of anyone from the transmission utility industry is clear evidence of bias. I understand from sources is that the utility industry tried to get representation but “after input and deliberation” a decision to exclude them was made by the Cuomo Administration. That was clearly a mistake as evidenced by the fact that some sort of utility support group is currently being organized to provide expertise to the process.
The Advisory Panel is made up of people more representative of organizations supporting the political narrative of the CLCPA than the technical expertise necessary to implement the transition to zero emissions. In an earlier post, I categorized the organizations represented by the 14 non-state agency members: three members work for generating companies, two renewable and one fossil oriented; one member is from the New York Independent System Operator, the state’s grid operating company; one member is a consultant for energy and sustainability issues; and the remaining eight members were from advocacy organizations representing either renewable technologies, the environment, or trade unions, with one representing ratepayers.
As I feared the representatives with the technical expertise to recognize the technological challenges are being drowned out by those that believe the myth of renewable energy magical solutions. For example, in an electric energy system powered primarily by wind and solar, the transmission system has to be supported by services that are currently provided by fossil, nuclear and hydro generation but not available from wind and solar. The power generation advisory panel should be leading the charge to make sure the transmission ancillary service problem is addressed but the issue has not even been raised at their public meetings. Instead, there have been extensive discussions about the peaker power plant issue which I believe is an emotional problem not supported by reality. I have seen no sign of any response to the comments I submitted to this panel on that topic.
Conclusion
The first public input session for the CLCPA power generation advisory panel was encouraging because there were comments presented by environmentalists arguing for the development of nuclear power in the future and pointing out that retiring existing nuclear facilities was counter-productive and someone else supported my affordability concerns. However, I predict that future public input sessions will be dominated by environmental activists and renewable energy supporters.
John Rhodes claims that the advisory panel makeup was designed to be unbiased rings hollow when you look at the makeup of the members. Representatives from the nuclear sector and transmission utilities should be on the panel.
The popular narrative is greenhouse gas emission reductions are necessary to prevent climate change impacts. In order to justify the monetary costs and loss of personal choices necessary to make those reductions a parameter was developed to “put the effects of climate change into economic terms to help policymakers and other decisionmakers understand the economic impacts of decisions that would increase or decrease emissions.” At the January 19, 2021 Climate Action Council meeting there was a discussion of New York’s version of this parameter and it has become clear that the Council intends to use it to claim that the costs imposed on New Yorkers are “cost-effective”. The problem is that they will be comparing real costs today against contrived value-driven estimates of speculative impacts occurring in the far future elsewhere. In this post I explain the methodology used to value greenhouse gas emission reductions and how assumptions and value judgements radically change the estimated benefits.
The CLCPA requires that the Department of Environmental Conservation (DEC), in consultation with the New York State Energy Research and Development Authority (NYSERDA), establish a value of carbon for use by State agencies. This value of carbon represents the present-day value of projected future net damages from emitting a ton of CO2 today. A draft document was issued for comments in October 2020 and in December the Value of Carbon Guidance (“Guidance”), an appendix with values for carbon dioxide, methane, and nitrous oxide, and a supporting memo were released for use by State agencies along with recommended guidelines for the use of these and other values by State entities.
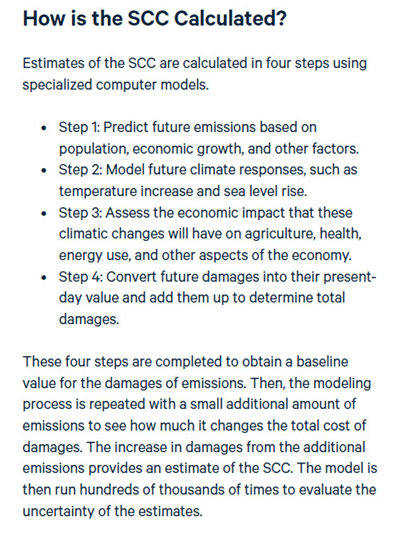
The Guidance has prepared estimates, in dollars, of the economic damages that would result from emitting one additional ton of greenhouse gases into the atmosphere to justify the costs of mitigating strategies. Resources for the Future (RFF) prepared an overview summary of the process used to calculate these values and described how the values are used in policy analysis. Note that Guidance supporting memo was prepared by the New York State Energy Research & Development Authority (NYSERDA) and RFF and includes much of the same information. The Guidance recommends using the damages approach to valuing carbon. RFF refers to the value of carbon using that approach as the Social Cost of Carbon (SCC) and I will use the value of carbon and SCC interchangeably in this post. According to RFF:
The point of this post is that there many choices that affect the value of the SCC. The emissions, climate response and economic calculations are based on research and expertise from many different fields, such as climate science, demography, and economics. While proponents of this approach give the impression that the input presumptions are based on the “science”, the reality is that assumptions made by model developers play as much of a role as “science” on the results. Inevitably the assumption decisions are subject to value judgements and the biases of the researchers. RFF also notes that “the modeling must incorporate information that is inherently uncertain, such as projections of future economic growth.”
The Guidance document makes a recommendation for the value of the SCC to use: “The Department specifically recommends that State entities provide an assessment using a central value that is estimated at the 2 percent discount rate as the primary value for decision-making, while also reporting the impacts at 1 and 3 percent to provide a comprehensive analysis.” For CO2 this translates into a 2020 value of carbon dioxide of $53-421 per ton, with a central value of $125 per ton. The full set of values for 2020-2050 is provided in the separate Appendix tables.
Discussion
All evidence suggests that the Climate Action Council responsible for developing a plan to implement the law intends to estimate monetary benefits by multiplying the values of carbon in the Guidance document and the observed emission reductions to claim that the costs of their strategies to reduce emissions are outweighed by those benefits. Using their recommended values and the official 1990 baseline emissions for all the greenhouse gases included in the CLCPA the total benefits total $668 billion:
Table 1: Recommended Value of Carbon Guidance 1990 Reduction Benefits (millions)
CO2
CH4
N2O
PFCs
HFCs
SF6
NF3
Total
$33,100
$373,317
$260,758
$113
$6
$501
$0
$667,795
In my detailed post I documented different factors that affect the benefits calculations. In this post I will qualitatively describe the value judgements used to, in my opinion, maximize the CLCPA narrative that there is value in the proposed emission reductions. One example of narrative-driven value judgement is the global warming potential (GWP) time horizon. This parameter weighs the radiative forcing of a gas against that of carbon dioxide over a specified time frame. Most jurisdictions use a 100-year GWP time horizon but the CLCPA law mandates the use of the 20-year GWP that increases methane (CH4) reductions associated with natural gas. Note that in Table 1 methane benefits are three times higher than the benefits of CO2. If the 100-year GWP values were used then reduction benefits would drop 34%
The biggest driver of social costs from greenhouse gases is the discount value which is used to estimate how much money invested today would be worth in the future so that we can link today’s costs to the future. It is accepted that there is no consensus or uniform scientific basis for the selection of a discount rate. The CLCPA implementation process claims to follow the “science” but it appears that is only when it is consistent with their narrative to maximize the benefits of reductions. For example, the Obama Administration Integrated Working Group (IWG) chose a central value 3% and only published results down to 2.5% but New York chose to use 2% as the central value which results in social costs over two times larger. Combining the GWP and discount value judgements, if New York followed the IWG recommendations the benefits would be 70% lower.
There are other parameters that affect the social benefits of emission reductions. Part of the argument for using a lower discount rate is that it helps protect our children and grandchildren but the Guidance calculates future net damages out 300 years, far future many generations away. No one could have imagined the technology available in today’s society one hundred years ago so it is an act of extreme hubris to claim that any projection of how the world will operate in 100 years, much less 300 years, should be used to guide current actions. In testimony before the U.S. House of Representatives Subcommittee on Environment Committee on Oversight and Reform on September 24, 2020, by Kevin D. Dayaratna determined that if economic impacts are only considered out 150 years the social benefits are reduced 14%.
The entire rationale for the CLCPA is that there is a climate emergency threat to society because of climate change due to greenhouse gas emissions. The process does not recognize that the climate models used to predict this future are speculative. One way to minimize modeling uncertainty is to use historical data to estimate climate sensitivity to greenhouse gases. Dayaratna showed that an empirical approach reduced benefits 48%.
New York chose to calculate world-wide benefits of reductions because “climate change is a global problem”. It is a fact that climate change impacts will be felt most by countries that are too poor to be resilient. However, I believe that anyone having trouble paying energy bills today would be hard pressed to accept the higher costs imposed by the CLCPA if they know that their descendants will derive little benefit from today’s sacrifices because most of the benefits will accrue elsewhere. Considering only benefits that would accrue to the United States from reductions instead of global benefits reduces the benefits 86%.
Conclusion
To sum up, greenhouse gas emission reductions under the CLCPA using the recommended assumptions are supposed to provide benefits of $668 billion. Using the Obama Administration recommended assumptions the benefits go down to $201 billion. Using different value-driven estimates, reducing speculation by using observations rather than models, estimates that go out “only” 150 years instead of 300 years, and counting only benefits that occur in the United States instead of the globe results in benefits that are reduced to $12.5 billion.
Ultimately, the value of carbon methodology relies on a complex causal chain from carbon dioxide emissions to social impacts that are alleged to result from those emissions. Richard Tol testified that these connections are “long, complex and contingent on human decisions that are at least partly unrelated to climate policy. The social cost of carbon is, at least in part, also the social cost of underinvestment in infectious disease, the social cost of institutional failure in coastal countries, and so on.” The fact is that this process focuses exclusively on negative externalities and completely ignores the benefits of fossil fuels. I believe these facts make this a contrived process.
One final point. After all these machinations, the social cost values chosen when applied to the 1990 baseline emissions indicate that reducing those emissions will result in $668 billion in benefits. The Climate Action Council is charged with developing an implementation plan that should include costs. What happens if those costs are greater than these benefits?
At the January 19, 2021 Climate Action Council meeting there was a discussion of New York’s value of carbon guidance document and it has become clear that the Council intends to use the value of carbon to claim that the costs imposed on New Yorkers are “cost-effective”. The problem is that they will be comparing real costs today against contrived value-driven estimates of speculative impacts occurring in the far future elsewhere. This extensive post provides context for their numbers that maximize the costs and addresses explanations of the value of carbon guidance provided at the meeting.
In this post I tried to simplify the discussion as much as possible but still ended up with a post that was too long. In order to address this, I rearranged the order of the sections. I provide background information first followed by a synopsis that presents the key findings and conclusions. If you want to learn where the numbers come from a simplified description of the methodology used to calculate the key findings comes next. Finally, I present a more detailed description of the CO2 societal cost analysis to provide even more details for anyone interested. Because I have not figured out how to format tables and show them in the text each table has a link to a formatted version. Stay tuned for an even simpler version if this one gets too wonky.
Background
The CLCPA requires that the Department of Environmental Conservation (DEC), in consultation with the New York State Energy Research and Development Authority (NYSERDA), establish a value of carbon for use by State agencies. This value of carbon represents the present-day value of projected future net damages from emitting a ton of CO2 today. A draft document was issued for comments in October 2020 and in December the Value of Carbon Guidance (“Guidance”), an appendix with values for carbon dioxide, methane, and nitrous oxide, and a supporting memo were released for use by State agencies along with recommended guidelines for the use of these and other values by State entities.
I followed the development of this guidance throughout the process and if you want to get into the weeds then check out my previous posts. I described the background of the value of carbon after the initial stakeholder webinar, documented the comments I submitted on the draft document, and described the DEC response to my comments. Be forewarned however, these posts are wonky. In this post I attempted to show how differences in purported reduction benefits vary as a function of different assumptions.
The Guidance has prepared estimates, in dollars, of the economic damages that would result from emitting one additional ton of greenhouse gases into the atmosphere to justify the costs of mitigating strategies. Resources for the Future (RFF) prepared an overview summary of the process used to calculate these values and described how the values are used in policy analysis. Note that Guidance supporting memo was prepared by the New York State Energy Research & Development Authority (NYSERDA) and RFF and includes much of the same information. The Guidance recommends using the damages approach to valuing carbon. RFF refers to the value of carbon using that approach as the Social Cost of Carbon (SCC) and I will use the value of carbon and SCC interchangeably in this post. According to RFF:
The point of this post is that there many choices that affect the value of the SCC. The emissions, climate response and economic calculations are based on research and expertise from many different fields, such as climate science, demography, and economics. While proponents of this approach give the impression that the input presumptions are based on the “science”, the reality is that assumptions made by model developers play as much of a role as “science” on the results. Inevitably the assumption decisions are subject to value judgements and the biases of the researchers. RFF also notes that “the modeling must incorporate information that is inherently uncertain, such as projections of future economic growth.”
The Guidance document makes a recommendation for the value of the SCC to use: “The Department specifically recommends that State entities provide an assessment using a central value that is estimated at the 2 percent discount rate as the primary value for decision-making, while also reporting the impacts at 1 and 3 percent to provide a comprehensive analysis.” For CO2 this translates into a 2020 value of carbon dioxide of $53-421 per ton, with a central value of $125 per ton. The full set of values for 2020-2050 is provided in the separate Appendix tables.
Synopsis
All evidence suggests that the Climate Action Council responsible for developing a plan to implement the law intends to use the monetary benefits derived by multiplying the values of carbon in the Guidance document and the observed emissions to claim that the costs of their strategies to reduce emissions are outweighed by those benefits. The problem is that they will be comparing real costs today against contrived value-driven estimates of speculative impacts occurring in the far future elsewhere as I show in this post. Table 1 lists the monetary benefits for seven assumption scenarios that result in a benefits range of $668 billion to 12.6 $billion.
Table 1: Alternative New York 1990 Value of GHG Reduction Benefits ($millions)
1) CLCPA Value of Carbon Guidance 2% Discount & GWP-20
CO2
CH4
N2O
PFCs
HFCs
SF6
NF3
Total
$33,100
$373,317
$260,758
$113
$6
$501
$0
$667,795
2) CLCPA Value of Carbon Guidance 2% Discount Rate & GWP-100
CO2
CH4
N2O
PFCs
HFCs
SF6
NF3
Total
$33,100
$111,113
$294,751
$170
$3
$653
$0
$439,789
3) IWG 3% Discount Rate Using GWP-100
CO2
CH4
N2O
PFCs
HFCs
SF6
NF3
Total
$14,034
$60,988
$125,764
$72
$1
$277
$0
$201,136
4) Dayaratna 300 year horizon, 3% Discount Rate Using GWP-100
CO2
CH4
N2O
PFCs
HFCs
SF6
NF3
Total
$10,007
$33,592
$89,109
$51
$1
$197
$0
$132,957
5) Dayaratna 150 year horizon, 3% Discount Rate Using GWP-100 (-14.3%)
CO2
CH4
N2O
PFCs
HFCs
SF6
NF3
Total
$12,025
$52,257
$107,759
$62
$1
$237
$0
$172,342
6) Dayaratna empirical ECS, 150 year horizon, 3% Discount Rate Using GWP-100 (-48%)
CO2
CH4
N2O
PFCs
HFCs
SF6
NF3
Total
$6,256
$27,187
$56,061
$32
$0
$123
$0
$89,660
7) Domestic benefits, empirical ECS, 150 yr horizon, 3% Rate Using GWP-100 (-86%)
CO2
CH4
N2O
PFCs
HFCs
SF6
NF3
Total
$876
$3,806
$7,849
$4
$0
$17
$0
$12,552
Section 1 lists the benefits (2020 social cost times 1990 emissions for each greenhouse gas. One example of narrative-driven value judgement is the global warming potential (GWP) time horizon. This parameter weighs the radiative forcing of a gas against that of carbon dioxide over a specified time frame. Most jurisdictions use a 100-year GWP time horizon but the CLCPA law mandates the use of the 20-year GWP. As a result, methane reductions associated with natural gas are valued three times higher as shown in Section 2.
The biggest driver of social costs from greenhouse gases is the discount value which is used to estimate how much money invested today would be worth in the future so that we can link today’s costs to the future. It is accepted that there is no consensus or uniform scientific basis for the selection of a discount rate. The CLCPA implementation process claims to follow the “science” but it appears that is only when it is consistent with their narrative to maximize the benefits of reductions. For example, the Obama Administration Integrated Working Group (IWG) chose a central value 3% and only published results down to 2.5% but New York chose to use 2% as the central value which results in social costs over two times larger (Section 3).
In order to consider the effect of other parameters, I calculated social benefits values based on different assumptions derived from testimony before the U.S. House of Representatives Subcommittee on Environment Committee on Oversight and Reform by Kevin D. Dayaratna. Section 4 lists his estimated benefits using the same assumptions as the IWG. I calculated the % reduction between Section 4 and each of the different assumptions and applied the resulting percentage reductions cumulatively to the Section 3 benefits.
Part of the argument for using a lower discount rate is that it helps protect our children and grandchildren but the Guidance calculates future net damages out 300 years, many generations away. Moreover, it is an act of extreme hubris to claim that any projection of how the world will operate in 100 years, much less 300 years, should be used to guide current actions simply because no one could have imagined the technology available in today’s society one hundred years ago. If the economic impacts are only considered out 150 years the social costs are reduced 14%. (Section 3 benefits times (1- 14%))
The entire rationale for the CLCPA is that there is a climate emergency threat to society because of climate change due to greenhouse gas emissions. The process does not recognize that the climate models used to predict this future are not without shortcomings. One way to minimize modeling uncertainty is to use historical data to estimate climate sensitivity to greenhouse gases and, as shown here, that can reduce impacts 48%.
New York chose to calculate world-wide benefits of reductions because climate change is a global problem. It is a fact that climate change impacts will be felt most by countries that are too poor to be resilient. However, I believe that anyone having trouble paying energy bills today would be hard pressed to accept the higher costs imposed by the CLCPA if they know that their descendants will derive little benefit from today’s sacrifices. Considering only benefits that would accrue to the United States from reductions instead of global benefits reduces the value of carbon 86%.
To sum up, greenhouse gas emission reductions under the CLCPA using the recommended assumptions are supposed to provide benefits of $668 billion. Using the Obama Administration recommended assumptions the benefits go down to $201 billion. At the extreme end of value and scientific judgements the benefits are as low as $12.5 billion.
Ultimately, the value of carbon methodology relies on a complex causal chain from carbon dioxide emissions to social impacts that are alleged to result from those emissions. Richard Tol testified that these connections are “long, complex and contingent on human decisions that are at least partly unrelated to climate policy. The social cost of carbon is, at least in part, also the social cost of underinvestment in infectious disease, the social cost of institutional failure in coastal countries, and so on.” The fact is that this process focuses exclusively on negative externalities and completely ignores the benefits of fossil fuels. I believe these facts make this a contrived process.
One final point. After all these machinations, the social cost values chosen when applied to the 1990 baseline emissions indicate that reducing those emissions will result in $668 billion in benefits. The Climate Action Council is charged with developing an implementation plan that should include costs. What happens if those costs are greater than these benefits?
Greenhouse Gas Reduction Benefits Estimates
This section describes the methodology used to calculate the values shown in Table 1.
The Climate Action Council plans to multiply the values of CO2 in the Guidance document by CO2 emissions to come up with “benefits”. Table 2, NY Social Cost of CO2 Value of Reductions ($millions), lists the recommended 2020 values for CO2, the DEC Part 496 CLCPA baseline emissions, and the total benefits for completely eliminating 1990 emissions (multiplies the Guidance values by the emissions). It shows how differences in the assumptions changes the potential benefit costs for CO2 for three different discount rates. In the absence of a recent estimate of New York CO2 emissions I used the DEC official baseline 1990 value of 264.8 million metric tons of CO2 to estimate the potential benefits. Using the 2020 value of carbon dioxide of $53-421 per ton, with a central value of $125 per ton and the 1990 emissions the benefits of eliminating those emissions ranges between $111.5 billion and $14.0 billion with a central value of $33.1 billion.
1990 Statewide Greenhouse Gas Emissions (million metric tonnes)
GWP
CO2
CH4
N2O
PFCs
HFCs
SF6
NF3
GWP20
264.8
134.19
5.83
0.9
0.05
4.01
0
GWP100
264.8
39.94
6.59
1.36
0.02
5.22
0
Recommended Value of Carbon Benefits (millions)
Discount
CO2
CH4
N2O
PFCs
HFCs
SF6
NF3
Total
2%
$33,100
$373,317
$260,758
$113
$6
$501
$0
$667,795
The first, and arguably, the biggest judgement that has to be made when the values are developed is the economic discount rate. According to the Guidance document “Discounting is a common and useful aspect of economic analyses that allows for the balancing of present versus future value and it has been widely discussed in the literature, particularly in its application to the federal social cost of carbon. However, the selection of the discount rate has a large effect on the estimate of the value of carbon, and there is no consensus or uniform scientific basis for the selection of a discount rate.” I emphasized the key point that there is no consensus for selecting the discount rate chosen. The discount price chosen boils down to value judgements on the part of the State and the model developers.
During the January 19, 2021 Climate Action Council meeting, Jared Snyder, New York Department of Environmental Conservation Deputy Commissioner for Air Resources, Climate Change, & Energy, described the NY Value of Carbon Guidance and talked about the discount rate choices. I tried to transcribe his comments but did edit out superfluous wording. He stated that: “We proposed central values of 2 or 2.5% for public comment. The Obama Administration did use 3% but a number of economists have indicated their views that 3% is somewhat too high and recommended looking at and establishing a value of carbon based on lower values.” A key point is that the Integrated Working Group did a more thorough analysis of the discount rates and chose a central value that was not even proposed for comment. The Guidance 2% value is $72 more per ton and results in increased benefits of over $19 billion compared to the IWG 3% value. In my opinion the Guidance did not adequately justify their choice to deviate from the IWG expert analysis.
Snyder went on to say that based on information from various economists, “we moved towards the 2% range based on a view that impacts that occur significantly in the future that impact our children, grandchildren and the like, are still important and we did not want to discount those too much.” He concluded “Informed by the economists and that value judgement we decided that 2% is an appropriate value”. Snyder states that the discount rate values “impacts in the future versus impacts now”. An alternative explanation is that the discount rate is used to estimate how much money invested today would be worth in the future so that we can link today’s costs to the future. Snyder’s response is disingenuous because while it may be appropriate to value impacts today similar to impacts tomorrow for our children and grandchildren, the SCC valuation process considers impacts out to 2300. According to the internet there are 25.2 years in a generation which means that benefits are being calculated for twelve generations, not exactly our children and grand-children.
There are two other aspects of the CLCPA law that directly affect the social costs. In addition to CO2, the CLCPA mandates that other greenhouse gases should also be addressed: methane (CH4), nitrous oxide (N2O), hydrofluorocarbons, perfluorocarbons, sulfur hexafluoride (SF6). According to the Guidance document, Global Warming Potential (GWP) weighs the radiative forcing of a gas against that of carbon dioxide over a specified time frame. Contrary to every other jurisdiction the CLCPA mandates that the specified time frame is 20 years, while everyone else uses 100 years. EPA notes in Understanding Global Warming Potentials that the ”20-year GWP prioritizes gases with shorter lifetimes, because it does not consider impacts that happen more than 20 years after the emissions occur”.
In order to consider the impacts of other greenhouse gases relative to CO2, the concept of equivalency is used. Carbon dioxide equivalence is “a simple way to normalize all these greenhouse gases and other climate influences in standard units based on the radiative forcing of a unit of carbon dioxide over a specified timeframe (generally set at 100 years)”. The Guidance document found sufficient information to develop social cost values for methane and nitrous oxides so those numbers are used directly. The CO2 equivalents are used in the subsequent analysis for hydrofluorocarbons, perfluorocarbons, sulfur hexafluoride (SF6), and nitrogen trifluoride (NF3), which was included in the Part 496 inventory despite the fact that the numbers are listed as zeros.
Table 3 lists the values of carbon that New York included in the Guidance document, GWP-20 and GWP-100 for 1%, 2% and 3% discount rates. The recommended central value benefits are $668 billion and the range of benefits goes from $201 billion to $1.86 trillion for all the greenhouse gases in the CLCPA. Note that methane benefits are more than half of the total and an order of magnitude greater than the CO2 benefits. Using the 20-year GWP increases the benefits three times the 100-year GWP benefits. Nitrous oxide benefits are over seven times greater than carbon dioxide benefits.
CLCPA Social Cost Requirements – Value of Carbon Guidance Recommendations
2020 Value of Greenhouse Gas Reductions
Discount
CO2
CH4
N2O
PFCs
HFCs
SF6
NF3
1%
$421
$6,578
$140,766
$421
$421
$421
$421
2%
$125
$2,782
$44,727
$125
$125
$125
$125
3%
$53
$1,527
$19,084
$53
$53
$53
$53
1990 Statewide Greenhouse Gas Emissions (million metric tonnes)
GWP
CO2
CH4
N2O
PFCs
HFCs
SF6
NF3
GWP20
264.8
134.19
5.83
0.9
0.05
4.01
0
GWP100
264.8
39.94
6.59
1.36
0.02
5.22
0
D.R.
GWP
CO2
CH4
N2O
PFCs
HFCs
SF6
NF3
Total
1%
GWP20
$111,481
$882,702
$820,666
$379
$21
$1,688
$0
$1,816,937
2%
GWP20
$33,100
$373,317
$260,758
$113
$6
$501
$0
$667,795
3%
GWP20
$14,034
$204,908
$111,260
$48
$3
$213
$0
$330,465
1%
GWP100
$111,481
$262,725
$927,648
$573
$8
$2,198
$0
$1,304,633
2%
GWP100
$33,100
$111,113
$294,751
$170
$3
$653
$0
$439,789
3%
GWP100
$14,034
$60,988
$125,764
$72
$1
$277
$0
$201,136
Table 1, Alternative New York 1990 Value of GHG Reduction Benefits ($millions), lists seven scenarios that compare the reduction benefits as a function of different assumptions and value judgements. The first section, CLCPA Value of Carbon Guidance 2% Discount & GWP-20, reproduces the recommended benefits from Table 2. The second section, CLCPA Value of Carbon Guidance 2% Discount Rate & GWP-100, compares the differences in benefits when using the 100-year GWP commonly used. Total benefits drop from $668 billion to $440 billion. Using the IWG approach, 3% discount rate and 100-year GWP, the total benefits drop to $201 billion. The only values I have for the IWG approach are for CO2. To calculate the remaining gases, I made the crude assumption that their social costs would be proportional to the change in social costs of CO2 using values from the second section.
In the remaining analyses I calculate social benefits values based on different assumptions derived from testimony before the U.S. House of Representatives Subcommittee on Environment Committee on Oversight and Reform on September 24, 2020, by Kevin D. Dayaratna. He used one of the primary integrated assessment models (DICE) used by the IWG to calculate SC-CO2 to calculate the social costs for different scenarios. My derived values are rough estimates and I applied the reductions in each analysis to accumulate the impacts. In order to refine the numbers, it is necessary to run multiple models thousands of times and that is way beyond my capabilities.
In the section of Table 1 labeled Dayaratna 300 year horizon, 3% Discount Rate Using GWP-100 (-70%) I list the his values for comparison to the IWG values in the third section. There is the same issue for the other gases as described for the IWG section and I applied the same approach.
Recall that Snyder justified the 2% discount rate “based on a view that impacts that occur significantly in the future that impact our children, grandchildren and the like, are still important and we did not want to discount those too much.” Note however, that the economic modeling calculates cost impacts 300 years out. But because the impacts of climate change will become more evident further in the future the benefits of reductions today will be much more of a factor closer to 2300. Dayaratna estimated the effect of the time horizon calculating the social costs out 150 years instead of the 300-year time horizon and found that assumption reduces societal benefits by 14%.
The effect of greenhouse gases on climate is a fundamental driver of the impacts and is another factor affecting the social cost estimates. Equilibrium climate sensitivity (ECS) is the expected change in temperature when the atmospheric CO2 concentration doubles. The IWG analysis depended upon outdated, model-derived ECS values. In his testimony before the Environment Committee on Oversight and Reform on September 24, 2020, Dayaratna also estimated the effect of the ECS on the SC-CO2. In section 6, he used an ECS estimate based on observed data and found that the benefits would be reduced 48%.
By using different value judgements and a different ECS value the $668 billion in societal benefits from greenhouse gas reductions under the CLCPA are reduced to $12.5 billion in benefits.
CO2 Methodology
For the summary analysis I considered all the greenhouse gases but that necessitates the crude assumption that their social costs would be proportional to the change in social costs of CO2. This section provides a more-detailed description of my CO2 calculation methodology and the discussion of value of carbon cost effectiveness at the January 19, 2021 Climate Action Council meeting. I suggest that this section is best used as a stand-alone reference to the previous text.
The Climate Action Council plans to multiply the values of carbon in the Guidance document by the greenhouse gas emissions to come up with “benefits”. Table 4, NY Climate Social Cost of CO2 Value of Reductions ($millions), shows how differences in the assumptions changes the negative externality costs for CO2. In the absence of a recent estimate of New York CO2 emissions I will use the DEC official baseline 1990 value of 264.8 million metric tons of CO2 to estimate the potential benefits. The benefits are simply the 1990 emissions multiplied by the values of CO2.
According to the Guidance document “Discounting is a common and useful aspect of economic analyses that allows for the balancing of present versus future value and it has been widely discussed in the literature, particularly in its application to the federal social cost of carbon. However, the selection of the discount rate has a large effect on the estimate of the value of carbon, and there is no consensus or uniform scientific basis for the selection of a discount rate.” I emphasized the key point that there is no consensus for selecting the discount rate chosen. The price chosen boils down to value judgements on the part of the State.
During the January 19, 2021 Climate Action Council meeting, at 1:23:30 in the video of the meeting Jared Snyder, New York Department of Environmental Conservation Deputy Commissioner for Air Resources, Climate Change, & Energy, described the NY Value of Carbon Guidance. Snyder explained that “one of the key issues in establishing the value of carbon is establishing a discount rate”. He went on to say that refers to: ”How do you value impacts in the future versus impacts now?”. He claimed that if you value impacts now the same as impacts in the future you would apply a discount rate of zero. He noted that in the past experts have looked at discounts in a range of 2% to 5% which values current impacts more than future impacts. He explained that the Guidance considered a range of discount rates, including zero. It recommends a central value of 2% ($125 per ton of CO2 in 2020 dollars) with an evaluation range of 1% to 3% ($421 –$53 per ton of CO2 in 2020. As shown in Table 1 that translates into total benefits due to New York CO2 reductions of $33.1 billion at the central value with an evaluation range of $111.5 billion to $14.0 billion.
After Snyder’s presentation, Council member Bob Howarth asked for the justification of the choice of the discount value especially because the CLCPA mandates evaluation of a zero discount rate. I tried to transcribe the response made by Snyder to this question but did edit out superfluous wording. He stated that: “We proposed central values of 2 or 2.5% for public comment. The Obama Administration did use 3% but a number of economists have indicated their views that 3% is somewhat too high and recommended looking at and establishing a value of carbon based on lower values.” He went on to say that based on information from various economists, “we moved towards the 2% range based on a view that impacts that occur significantly in the future that impact our children, grandchildren and the like, are still important and we did not want to discount those too much.” He concluded “Informed by the economists and that value judgement we decided that 2% is an appropriate value”.
Snyder’s response does not give all the details. Snyder states that the discount rate values “impacts in the future versus impacts now”. An alternative explanation is that the discount rate is used to estimate how much money invested today would be worth in the future so that we can link today’s costs to the future. Snyder states that the Obama Administration recommended a central value estimate of 3%. The Guidance and supporting Memo discuss the discount rate and address some of the controversies associated with choosing a value. The Guidance notes that “The federal IWG’s central value applies a 3 percent discount rate that is consistent with the economics literature and in the federal government’s Circular A-4 guidance for the consumption rate of interest” Neither mention that Circular A-4 guidelines state that all cost/benefit analyses are to be scored using both a 3% and a 7% discount rate. Both the IWG and the Guidance document used their values to choose the rates used.
There are two other aspects of the CLCPA law that directly affect the social costs. In addition to CO2, the CLCPA mandates that other greenhouse gases should also be addressed: methane (CH4), nitrous oxide (N2O), hydrofluorocarbons, perfluorocarbons, sulfur hexafluoride (SF6). According to the Guidance document, Global Warming Potential (GWP) weighs the radiative forcing of a gas against that of carbon dioxide over a specified time frame. Contrary to every other jurisdiction the CLCPA mandates that the specified time frame is 20 years, while everyone else uses 100 years.
In order to consider the impacts of other greenhouse gases relative to CO2, the concept of equivalency is used. Carbon dioxide equivalence is “a simple way to normalize all these greenhouse gases and other climate influences in standard units based on the radiative forcing of a unit of carbon dioxide over a specified timeframe (generally set at 100 years)”. The Guidance document found sufficient information to develop social cost values for methane and nitrous oxides so those numbers are used directly. The CO2 equivalents are used in the subsequent analysis for hydrofluorocarbons, perfluorocarbons, sulfur hexafluoride (SF6), and nitrogen trifluoride (NF3) which was included in the Part 496 inventory despite the fact that the numbers are listed as zeros. In testimony before the U.S. House of Representatives Subcommittee on Environment Committee on Oversight and Reform on September 24, 2020, Kevin D. Dayaratna estimated the effect of a wider range of discount rates. He used one of the primary integrated assessment models (DICE) used by the IWG to calculate SC-CO2 to calculate the social costs for different scenarios. As shown in Table 5 the range of total benefits based on different discount rates ranges by an order of magnitude from $1.5 billion to $15 billion.
Snyder said that based on information from various economists, “we moved towards the 2% range based on a view that impacts that occur significantly in the future that impact our children, grandchildren and the like, are still important and we did not want to discount those too much.” The fact is that the in order to justify using a low discount rate people have to know that the Guidance methodology calculated cost impacts 300 years out and according to the internet there are 25.2 years in a generation which means that benefits are being calculated for twelve generations, not exactly our children and grand-children. Proponents argue that because most of the warming caused by carbon dioxide emissions persists for many years, changes in carbon dioxide emissions today may affect economic outcomes for centuries to come. This is described as leaving the world a better place for our grand-children. But because the impacts of climate change will become more evident further in the future the benefits of reductions today will not be a factor until further in the future. Dayaratna estimated the effect of the time horizon calculating the social costs out 150 years instead of the 300-year time horizon. Table 6 compares the time horizons using the same discount rates and shows that he found that using a 2.5% discount rate the 150 year time horizon total benefits would drop by 22% but at a 7% discount rate they only drop 0.3%.
Snyder’s presentation also noted that the benefits were calculated on a global basis because it is a global problem. This is a value judgement and in the interest of full disclosure the effects should be noted. In 2017, President Trump signed Executive Order 13783 which, among other actions, disbanded the IWG and stated that the estimates generated by the Interagency Working Group were not representative of government policy. Federal projects used social cost estimates based on the same approach as the IWG but differed in two aspects: the only damages that were considered were those in the United States and different values were used to convert to present costs. A recent GAO report show that changing just those two variables results in very different damage estimates. As shown in Table 7, at the common 3% discount rate, the prior federal estimate a was $50 but the current federal estimate is only $7. The value of the reductions goes down from $13.2 billion to $1.9 billion.
The effect of greenhouse gases on climate is a fundamental driver of the impacts and is another factor affecting the social cost estimates. Equilibrium climate sensitivity (ECS) is the expected change in temperature when the atmospheric CO2 concentration doubles. The IWG analysis depended upon outdated, model-derived ECS values. In his testimony before the Environment Committee on Oversight and Reform on September 24, 2020, Dayaratna also estimated the effect of the ECS on the SC-CO2. Table 8 shows using the Lewis and Curry 2015 ECS values (based on monitoring and not modeling) that in 2020 for a discount rate of 2.5%, the SC-CO2 is reduced 49% using a 300-year time horizon and that the reduction decreases for future estimates. Using those values, the benefits of the reductions goes from $15.1 billion down to $7.7 billion at the 2.5% discount rate.
As part of the implementation process of the Climate Leadership and Community Protection Act, on February 4, 2021 Energy Efficiency and Housing Advisory Panel had a public engagement session. The agenda included their preliminary draft recommendations that are under consideration. This post presents those recommendations with minimal comment. I believe that most New Yorkers have no clue about the Climate Act, much less what will be required to meet the target goals. These recommendations ought to be a wakeup call to them.
The summary of the recommendations included six slides. The screen captures of each slide is shown below with a few brief notes. Update 2/6/21: The meeting presentation with these slides is available here.
There have been similar strategies proposed for some cities but the recommendation to ban gas/oil for space heating, water heating, cooking and dryers for an entire state is a first. I doubt that many in New York have any inkling that this is seriously being considered.
This strategy is for multi-family apartment buildings as well as commercial and industrial buildings.
If they go through with these strategies then a lot of workers will be required but any claims about the number of jobs should be sure to consider the jobs lost too.
My particular concern is home heating and the transition away from fossil fuel options. According to the most recent NYSERDA Patterns and Trends document in 2016 NYS residential fuel use was 75% fossil fuels. The same document notes that there were 7,209,054 occupied housing units and 6,061,315 or 84% of them used fossil fuels for space heating. If non-fossil fuel alternatives were cheaper, then those percentages would be smaller. Even access to “low-cost capital” comes at a price. How much is needed and where will it come from?
The costs of these programs is going to be huge and this strategy does not include the cost of electrical service upgrades in neighborhoods. When heating and transportation is electrified it is unlikely that existing distribution networks will be able to handle the loads without upgrades.
Every Advisory Panel includes anti-natural gas ideologues amongst its membership. The language in this strategy reflects that. I also think this obsession to get rid of fossil-fuel heating sources will lead to much greater reliance on wood-fired stoves for heat. If that comes to pass the public health impacts will be much greater than the health impacts alleged to be associated with natural gas and oil.
Conclusion
When I was growing up during the 1950’s I remember the excitement when natural gas came to town so that my family no longer had to deal with maintaining our coal-fired furnace fire, dealing with the ashes and having a coal bin in the basement. My first house had an oil-fired furnace and I do not miss dealing with an oil tank in the basement and worrying about oil deliveries. Natural gas is simply more convenient and cleaner than other alternatives. As a result, I like natural gas for heat, hot water, cooking, drying clothes, and, I even have a whole-house generator powered by natural gas. In addition to cost savings, I am not comfortable that an all-electric home would protect my family in the event of a prolonged power outage. In the last 40 years we have only had a couple of multi-day outages but we survived because we had access to natural gas.
Frankly I was taken aback by these recommended strategies. I have been following this implementation process and it was clear that fossil fuels would have to be banned but seeing that spelled out still was a shock. In the introduction I said that I thought most people have never heard of the CLCPA much less had any idea of what would be required to meet the law’s mandates. When people start hearing about these plans, I imagine enormous pushback. I can only hope.
A recent survey claims that there is wide support for policies to combat climate change by developing “clean” energy. I am very cynical about polls in general and climate polls in particular. This post poses some questions about the survey results.
Background
The Politics & Global Warming poll[1] was performed by the researchers from the Yale Program on Climate Change Communication and the George Mason University Center for Climate Change Communication. According to the Executive Summary:
“Drawing on a nationally representative survey (N = 1,036; including 949 registered voters), this report describes how registered voters view a variety of climate and energy policies. This survey was fielded from December 3 – 16, 2020 – after the results of the 2020 U.S. presidential election were known, but before control of the U.S. Senate was determined. This executive summary reports the results from all registered voters, while the report breaks the results down by political party and ideology.
53% of registered voters say global warming should be a high or very high priority for the president and Congress.
66% of registered voters say developing sources of clean energy should be a high or very high priority for the president and Congress.”
In the Executive Summary I count percentage results for 62 questions. The report breaks down the results from questions in more detail, but the complete survey text is not included as far as I can tell. There are questions included in graphical results but I believe that there had to be some explanatory text too. Given the volume of material included in this survey I believe it is expecting a lot to expect respondents to have enough knowledge of the topics to give educated responses. If the survey does provide background information, that is where the biases of the survey developers could easily affect the results. If not, then respondents have to depend on sound-bite news stories. There is nothing in this poll that reduces my cynicism of climate polls.
Premise of the Survey
Section 2, Support for Policies to Reduce the Pollution that Causes Global Warming, describes questions related to strategies to address climate change. There is an implicit presumption that we understand the reasons for climate change well enough to be able to say climate mitigation policies could actually affect global warming. If there was any expository text introducing these questions, I am sure that it followed the politically correct meme that there is a climate crisis and we have to act now to save the earth from thermal Armageddon.
What if the respondents were to hear the other side of the story? In a recent interview Judith Curry described the climate models used to generate the scary stories used to justify the policies:
“However, the most consequential applications of climate models are to tell us what caused the 20th century climate change, how much the climate change is going to change in the 21st century and what’s causing extreme weather events. I mean, those are the more consequential applications and climate models aren’t fit for any of those purposes. And that’s pretty much acknowledged even in the IPCC report. Well, they, they do claim that they can attribute the global warming, but this can’t be easily separated from the natural variability associated with large-scale ocean circulations. And the way they’ve used climate models to do that involves circular reasoning, where they throw out climate simulations that really don’t match what was observed. So, you, you end up, even if you’re not explicitly tuning to the climate record, you’re implicitly tuning. And then the thing with extreme events, weather events is beyond silly because these climate models can’t resolve the extreme events and they can’t simulate the ocean circulation patterns that really determine the locations of these extreme events. And then when you start talking about 21st century, the only thing they’re looking at is the manmade human emissions forcing, they’re not predicting solar variability.”
Paris Climate Agreement
The first subsection stated that “There is bipartisan support for U.S. participation in the Paris Climate Agreement”. The text states:
“In December, 2015, officials from 197 countries (nearly every country in the world) met in Paris at the United Nations Climate Change Conference and negotiated a global agreement to limit global warming. On Earth Day, April 2016, the United States and 174 other countries signed the agreement, with all of the other countries following suit. On June 1, 2017, President Trump announced that the United States would withdraw from the agreement, and on November 4, 2020, the day after the U.S. presidential election, the U.S. formally withdrew. President-elect Biden has announced that the U.S. will re-join the agreement soon after Biden’s inauguration on January 20, 2021.”
I have to assume that this text was used in the survey. There is nothing factually incorrect in this explanation but for a public that has no clue it also does not provide the full story. Bjorn Lomborg recently pointed out that “Climate change, according to Biden, is “an existential threat” to the nation, and to combat it, he proposes to spend $500 billion each year on climate policies — the equivalent of $1,500 per person”. He goes on to explain that the agreement will not materially affect global warming itself and that increases in emissions in countries without Paris Agreement commitments will quickly overwhelm any reductions made in the United States.
In Appendix I: Data Tables, the specific question was quoted:
“In 2015, the United States signed an international agreement in Paris with 196 other countries to limit the pollution that causes global warming. Do you strongly support, somewhat support, somewhat oppose, or strongly oppose the U.S.’s participation in the Paris Agreement?”
The report claims that:
“Three in four registered voters (75%) support U.S. participation in the Paris Climate Agreement, but support varies by party. Nearly all liberal Democrats (97%) and moderate/conservative Democrats (93%) support U.S. participation, as do seven in ten liberal/moderate Republicans (71%) and Independents (70%). About four in ten conservative Republicans (44%) also support U.S. participation in the Agreement.”
If the Lomborg’s background information were provided then I do not believe there would be as much support for the Agreement.
Green New Deal
The report states “A majority of registered voters support a ‘Green New Deal’”, but does admit that “only 18% say they have heard ‘a lot’ about it.” The Section 2 documentation notes:
“As we reported in 2019, a majority of registered voters support the policy aspirations included in the Green New Deal, although support decreased during the time period between December 2018 and April 2019, particularly among conservative Republicans and regular viewers of the Fox News Channel. The description of the policy was summarized based on a 2018 policy report:“the Green New Deal will produce jobs and strengthen America’s economy by accelerating the transition from fossil fuels to clean, renewable energy. The Deal would generate 100% of the nation’s electricity from clean, renewable sources within the next 10 years; upgrade the nation’s energy grid, buildings, and transportation infrastructure; increase energy efficiency; invest in green technology research and development; and provide training for jobs in the new green economy.”
Again, I have to assume that this text was used in the survey. For anyone who has not heard a lot about the Green New Deal summarizing it based on a report from Data for Progress, “a multidisciplinary group of experts using state-of-the-art techniques in data science to support progressive activists and causes” clearly is going to hear only one side of the story. A complete description would explain the following. The conversion from fossil fuels to “clean” energy has negative consequences that are overlooked in the simple “clean” description. It is impossible to convert 100% of the nation’s electricity to clean, renewable energy in ten years by any rational evaluation. In addition to the technical considerations, costs will be enormous.
In that light of the biased information provided the survey’s findings are not surprising:
“As of December 2020, about two in three registered voters (66%) support the Green New Deal as described above, including a large majority of liberal Democrats (91%) and conservative/moderate Democrats (86%). About six in ten liberal/moderate Republicans (59%) but fewer conservative Republicans (24%) also support the Green New Deal.”
“About one in five registered voters (18%) have heard “a lot” about the policy proposal called the “Green New Deal” (see section 2.12 for a description of the policy). This represents an increase of 15 percentage points since this question was first asked in December 2018. Conservative Republicans were most likely to have heard “a lot” about the Green New Deal (27%), followed by liberal Democrats (23%).”
“Overall, relatively few registered voters have heard a lot about the Green New Deal, which suggests that opinions about the proposal may continue to change over time.”
I agree with the authors of this survey that opinions about the Green New Deal may continue to change over time but I suspect that if the short-comings of the policy and costs become known that the support for it will plummet.
Conclusion
Organizations with the name “Climate Change Communication” in their names are necessarily dependent upon climate change being a problem. So, it is not surprising that the survey was constructed to get answers supporting their pre-conceived outcome that there is wide support for policies to combat climate change by developing “clean” energy. However, if respondents who admit to having little knowledge about the topics in the poll are given both sides of the story, I believe the results would be much different. Nonetheless expect advocates to use this poll to justify action.
[1] Leiserowitz, A., Maibach, E., Rosenthal, S., Kotcher, J., Carman, J., Wang, X, Goldberg, M., Lacroix, K., & Marlon, J. (2021). Politics & Global Warming, December 2020. Yale University and George Mason University. New Haven, CT: Yale Program on Climate Change Communication