

In the summer of 2019 Governor Cuomo and the New York State Legislature passed the Climate Leadership and Community Protection Act (CLCPA) which was described as the most ambitious and comprehensive climate and clean energy legislation in the country when Cuomo signed the legislation. In early April 2020, NYS passed the Accelerated Renewable Energy Growth and Community Benefit Act (AREGCBA) as part of the 2020-21 state budget. This legislation is intended to ensure that renewable generation is sited in a timely and cost-effective manner. It is best described by a knowledgeable friend as “Once again the idiots in Albany have proven they are willing to dive from the high board without looking to see if there is any water in the pool.” When this was proposed I posted an essay describing the hypocrisy and over-reach aspects. This post show why there are significant risks to the electric system. I will follow up with a post addressing the other problems associated with these laws.
Background
The AREGCBA legislation states that the CLCPA targets “shall mean the public policies established in the climate leadership and community protection act enacted in chapter one hundred six of the laws of 2019, including the requirement that a minimum of seventy percent of the statewide electric generation be produced by renewable energy systems by 2030, that by the year 2040 the statewide electrical demand system will generate zero emissions and the procurement of at least nine gigawatts of offshore wind electricity generation by 2035, six gigawatts of photovoltaic solar generation by 2025 and to support three gigawatts of statewide energy storage capacity by 2030”.
Unfortunately, the politicians that passed this law never bothered to figure out how it could be done. Prudence would have been to do a study to determine what was feasible and then set the targets. Instead, the legislation sets up a Climate Action Council with the charge to prepare and approve a draft scoping plan “outlining the recommendations for attaining the statewide greenhouse gas emissions limits” within two years of the effective date of the legislation. One year later, the council shall submit the final scoping plan to the governor, the speaker of the assembly and the temporary president of the senate and post such plan on its website. I have written a series of posts on the feasibility risks, implications and some of the costs of the CLCPA that provides more details on the law.
The Accelerated Renewable Energy Growth and Community Benefit Act is Cuomo’s legislation and the unintended consequences will be his fault. On February 21, 2020 he announced “he is advancing a 30-day budget amendment to dramatically speed up the permitting and construction of renewable energy projects, combat climate change and grow the state’s green economy. If adopted, the Accelerated Renewable Energy Growth and Community Benefit Act will create a new Office of Renewable Energy Permitting to improve and streamline the process for environmentally responsible and cost-effective siting of large-scale renewable energy projects across New York while delivering significant benefits to local communities.” New York State’s budget process has never been a template for good governance and this March would have been an appropriate time to concentrate on the financial implications of the coronavirus pandemic. Instead, Cuomo jammed this legislation into the budget package making it difficult for the assembly or senate to discuss, much less object.
2. Legislative findings and statement of purpose
I have copied section 4 of this chapter of the legislation and inserted my comments in italics. My over-riding problem with the CLCPA is that there is no plan. The AREGCBA legislation compounds the problem by removing the evaluation of community impacts constraints.
-
- A public policy purpose would be served and the interests of the people of the state would be advanced by:
(a) expediting the regulatory review for the siting of major renewable energy facilities and transmission infrastructure necessary to meet the CLCPA targets, in recognition of the importance of these facilities and their ability to lower carbon emissions;
Article 10 Law currently requires “environmental and public health impact analyses, studies regarding environmental justice and public safety, and consideration of local laws” but those requirements take time to evaluate and it appears this legislation over-rides the time needed for those analyses.
(b) making available to developers of clean generation resources build-ready sites for the construction and operation of such renewable energy facilities;
In my opinion if the CLCPA and AREGCBA laws had been written such that the plans were developed first it would have been more protective for New Yorkers. In that approach the State would fulfill all the Article 10 requirements as part of the “build-ready sites” approach. It is possible that is the intent of this part of the rule but there will be more sites needed then those which are incentivized by section (f) below.
(c) developing uniform permit standards and conditions that are applicable to classes and categories of renewable energy facilities, that reflect the environmental benefits of such facilities and address common conditions necessary to minimize impacts to the surrounding community and environment;
I have reviewed all the Article 10 solar applications and there is no question that uniform permit standards and common conditions could be addressed by a comprehensive planning approach.
(d) providing for workforce training, especially in disadvantaged communities;
This is a transparent effort to develop support from a specific voting bloc.
(e) implementing one or more programs to provide benefits to owners of land and communities where renewable energy facilities and transmission infrastructure would be sited;
This is political payola. It is a bribe given in exchange for accepting any negative consequences of the renewable energy facilities.
(f) incentivizing the re-use or adaptation of sites with existing or abandoned commercial or industrial uses, such as brownfields, landfills, dormant electric generating sites and former commercial or industrial sites, for the development of major renewable energy facilities and to restore and protect the value of taxable land and leverage existing resources; and
This is a noble gesture. Without question it is a nice idea to re-use or adapt unused sites but the fact is that those sites are small relative to the areal needs of diffuse wind and solar power production required by the CLCPA.
(g) implementing the state’s policy to protect, conserve and recover endangered and threatened species while establishing additional mechanisms to facilitate the achievement of a net conservation benefit to endangered or threatened species which may be impacted by the construction or operation of major renewable energy facilities.
In the long list of Cuomo’s hypocritical environmental policies this may be the topper. There is no question that there is value for net conservation benefits. For example, if an acre of a wetland is impacted, then the applicant could restore, create or enhance more wetland acreage nearby for a net environmental benefit. The Cuomo administration has a consistent record of ignoring the possibility of this approach where it is inconvenient for their rationale to reject an application (e.g., any of the pipeline applications rejected in his tenure). While this may be appropriate for affected wetlands at renewable facilities the real concern with blanketing the state with wind turbines is the effect on endangered or threatened avian species. What in the world could be proposed as a net benefit for incidental slaughter of birds and bats at any wind turbine?
Electric System Concerns
The politicians that enacted CLCPA made a major mistake putting the cart (the aggressive targets) before the horse (figuring out what was feasible). The draft scoping plan outlining attainment recommendations will not be approved until June 2021 and the final version will not be presented to the Governor, Assembly and Senate for another year. The crony capitalists, environmental activists, and all the others who stand to gain from this ambitious plan have conned the legislators and Governor into believing that meeting the targets is simply a matter of political will but as I show below that is not the case.
I worry about the costs of the CLCPA because jurisdictions that are attempting similar GHG reductions have seen higher costs. Renewable energy supporters claim solar and wind are cheaper than conventional power plants but that is only the cost of the facility. The problem is the cost of the generator does not include the cost to get the power to where it is needed when it is needed. I evaluated one example of Cuomo’s renewable energy promises: freeing the state fairgrounds of fossil fuels. One advocate claimed “solar is doable” and that “the 9 million kilowatt hours the fair used in 2018-2019 could be supplied by a 45-acre solar array and that would cost about $12 million to build”. In my post I calculated what would be needed to provide all the electric power needed during the ten days the fair is open. In my cheapest scenario I estimate that the solar array has to be at least twice as large, a wind farm with ten 2.5 MW wind turbines has to be added to reduce energy storage requirements and that you would still need an energy storage array totaling 43 MWh. I have not evaluated the costs of solar and wind but have looked into the costs of Li-Ion batteries for energy storage. Using National Renewable Energy Laboratory information, I estimate that the cost of just battery backup would be $17 million. Assuming that a wind farm is a comparable cost to the 45-acre solar array and doubling the size of the array, the crude cost is $53 million. Of course, with no detailed plan we have no idea of the cost of the CLCPA.
But it not just a question of cost but also of feasibility. The State needs to show how many wind turbines, solar panels and energy storage systems will be needed when we most need power. The only way to do that is to determine the availability of wind and solar based on historical meteorological data. Done properly the study should look at hourly solar insolation, snow cover, and wind speed meteorological records across the state. The other component is expected load. In order to meet all the CLCPA targets the heating and transportation sectors will have to be electrified and that means that the future load peak will be in the winter. The over-riding feasibility problem is what resources will be needed to cover a winter peak when solar resources are low. I estimated the resources needed for a load estimate from the Citizen’s Budget Commission with wind and solar output estimates based on meteorological data from January 3-4 2018 and found that New York would have to build 11,395 MW of residential solar, 16,117 MW of utility-scale solar, 18,457 MW of on-shore wind and 16,363 MW of off-shore wind to meet the increased load needed for the CLCPA targets. For the example winter peak period I showed that the light winds at night would require 150,000 MWh of energy storage and using National Renewable Energy Lab information showed that energy storage alone could cost $176 billion by 2050.
There is another feasibility problem. Wind and solar are diffuse and chaotically intermittent. Because they are diffuse the transmission system is needed but because they are so intermittent the transmission system has to be modified. Conventional fossil-fuel fired, nuclear, and hydro units generate relatively stable power. Wind and solar units provide variable power generation so resources also have to be developed to handle grid balancing services. No major electric system has even come close to the targets in the CLCPA but transmission problems have shown up where renewable energy input is about half of the total such as South Australia. Battery storage such as LI-ion batteries can provide these services in theory but no where has any system near the size of New York demonstrated the practicality of such a system. Again, because there is no plan, we have no idea of the added costs of this necessary component of the future CLCPA electric energy system.
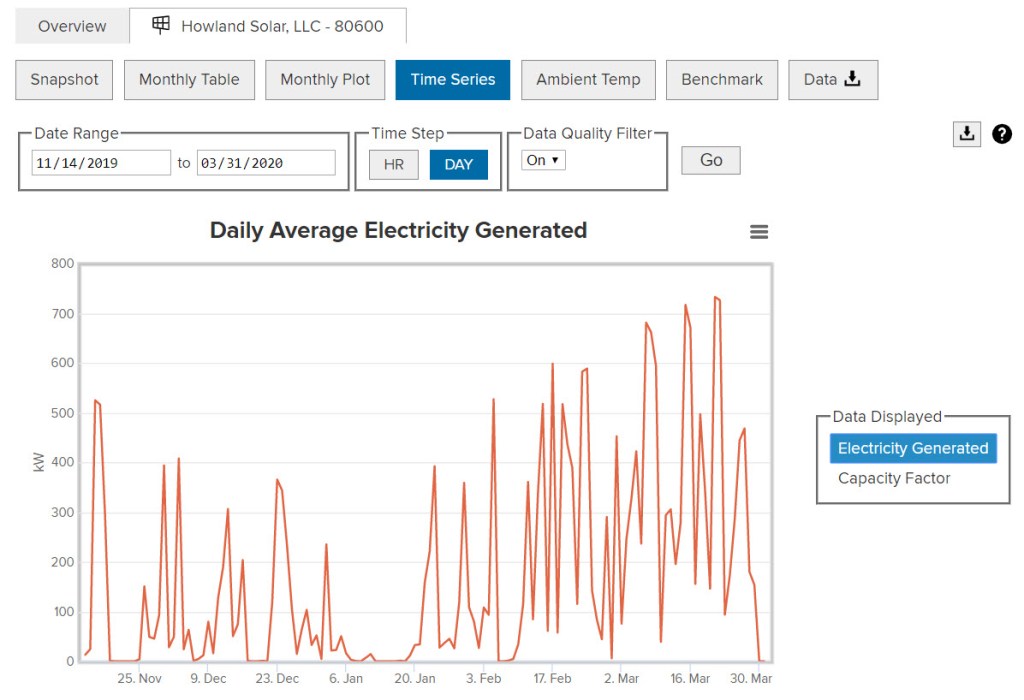
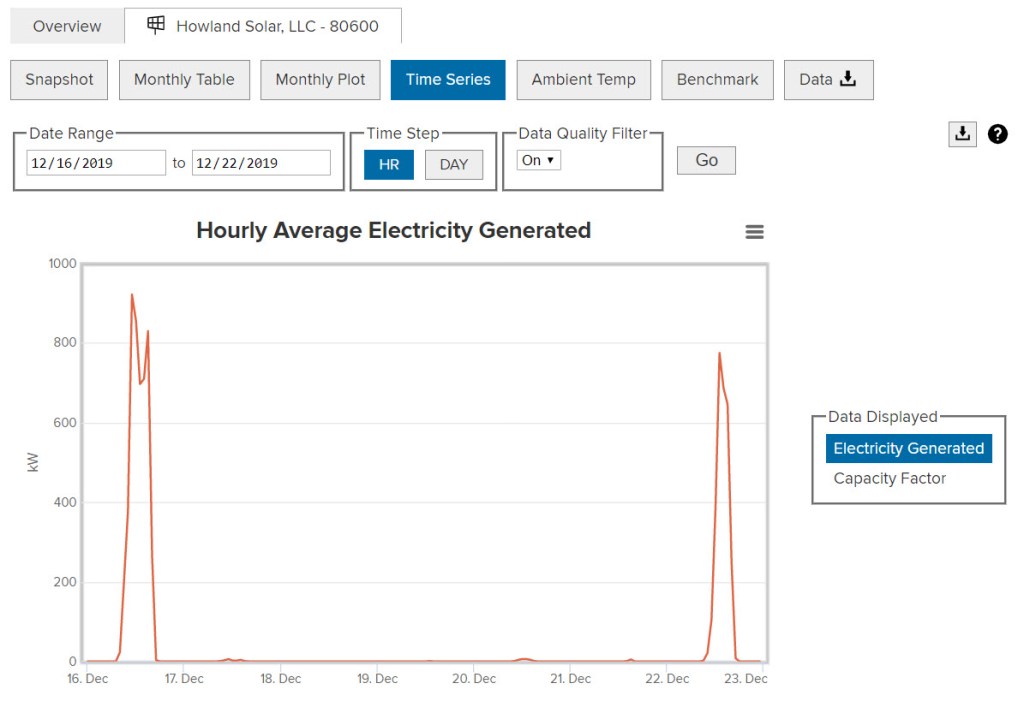
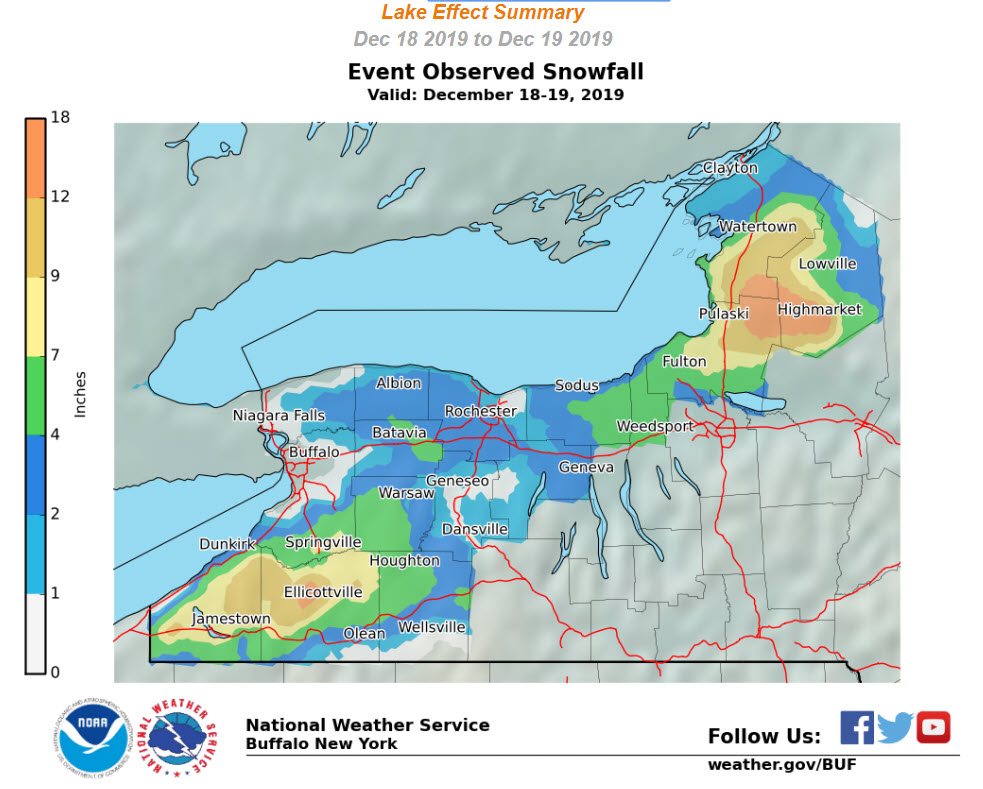
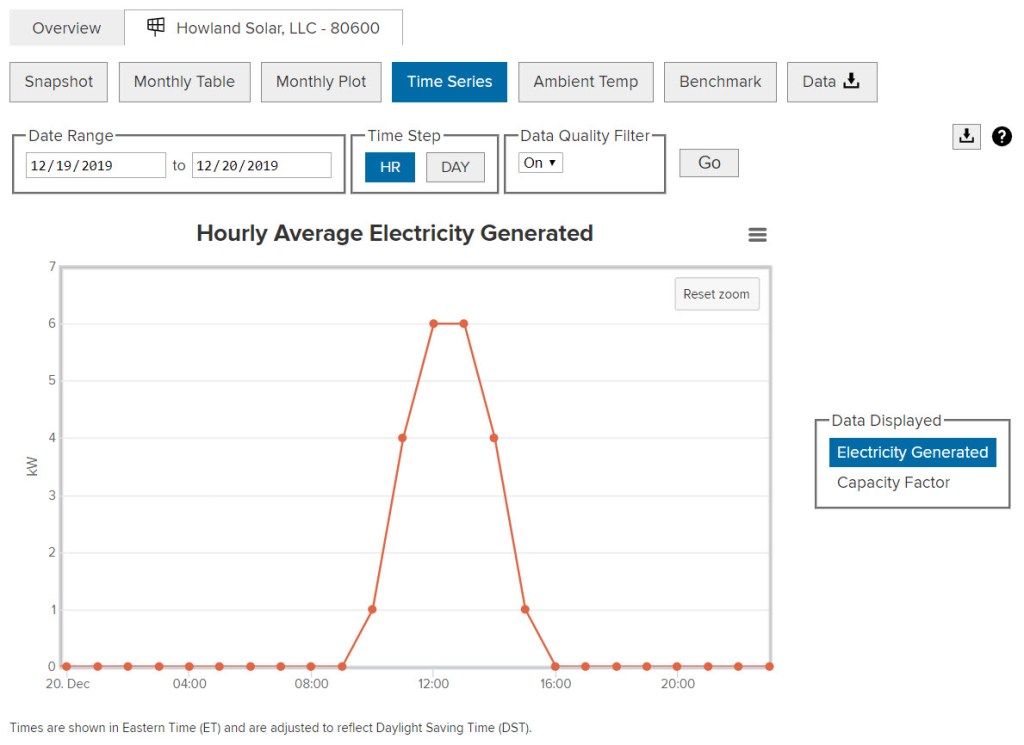
Even if a study shows it is feasible what about resiliency? Coal is no longer burned to generate electricity in New York and residual oil is discouraged but both fuels could be stored on-site making them more resilient sources of power. I recently showed that a 9” snowstorm blocked all the power output from a solar facility for four days. When the CLCPA target of 6 GW of solar PV is implemented and we have a similar snowstorm to the March 12-14 superstorm that covered the state with 10” of snow, how can the electrical needs be met with no solar generation. Even worse, what happens when an ice storm takes the power out to a city when residents completely depend on electric heat? The ultimate resiliency question is how can New York City possibly meet its requirements for in-city generation using diffuse renewables. Failure to meet those specifications raises the possibility of a New York City blackout.
There also are worrying issues with the environmental aspects. In order to do justice to those topics I am going to follow up with another post.
Conclusion
The New York electric system is part of one of the largest and most effective machines in the world. It produces affordable reliable electricity when and where it is needed. However, the popular conception of the grid is that for all of its complexity and acknowledged past success it is outdated. Enter the “Smart Grid” to solve all the problems. According to SmartGrid.gov, “the Smart Grid will consist of controls, computers, automation, and new technologies and equipment working together, but in this case, these technologies will work with the electrical grid to respond digitally to our quickly changing electric demand.“ They also say that “The Smart Grid represents an unprecedented opportunity to move the energy industry into a new era of reliability, availability, and efficiency that will contribute to our economic and environmental health.” I believe that the underlying impetus is “environmental health”. The only way to integrate renewable technology is the smart grid and everyone knows that we need renewables to save the planet.
New York State energy policy is on board with the Smart Grid and it has been sold to the gullible and innumerate as a simple, cheaper solution. Cynics like me say if it is so good then the market should choose it as the preferred alternative. Instead we get laws like CLCPA with its ambitious targets and the AREGCBA with its rushed incentives to build renewable technology. As I have shown there is no New York plan to implement this technology and serious technological issues to address. All we are left with are hollow promises and vague reassurances from the politicians. Until we have a plan that includes costs and environmental impacts these laws should be put on hold if not repealed altogether. The problem with the idiots in Albany diving from the high board without looking to see if there is any water in the pool is that they will take the reliable and affordable electric system crashing down with them.


