
A couple of years ago I posted an article about New York GHG emissions and found that they are less than one half of one percent of global emissions and that global emissions have been increasing on average by more than one half of one percent per year since 1990. I was recently asked to document that claim and updated that analysis. This post describes the results.
I have followed the Climate Act since it was first proposed, submitted comments on the Climate Act implementation plan, and have written over 400 articles about New York’s net-zero transition. The opinions expressed in this post do not reflect the position of any of my previous employers or any other organization I have been associated with, these comments are mine alone.
Overview
The Climate Act established a New York “Net Zero” target (85% reduction in GHG emissions and 15% offset of emissions) by 2050. It includes an interim 2030 reduction target of a 40% reduction by 2030 and a requirement that all electricity generated be “zero-emissions” by 2040. The Climate Action Council (CAC) is responsible for preparing the Scoping Plan that outlines how to “achieve the State’s bold clean energy and climate agenda.” In brief, that plan is to electrify everything possible using zero-emissions electricity. The Integration Analysis prepared by the New York State Energy Research and Development Authority (NYSERDA) and its consultants quantifies the impact of the electrification strategies. That material was used to develop the Draft Scoping Plan outline of strategies. After a year-long review, the Scoping Plan was finalized at the end of 2022. In 2023 the Scoping Plan recommendations were supposed to be implemented through regulation, PSC orders, and legislation. Not surprisingly, the aspirational schedule of the Climate Act has proven to be more difficult to implement than planned and many aspects of the transition are falling behind. In addition, there has not been any additional documentation provided that proves that the transition will be affordable, keep the same standards of energy reliability, or not have unacceptable cumulative environmental impacts.
GHG Emissions
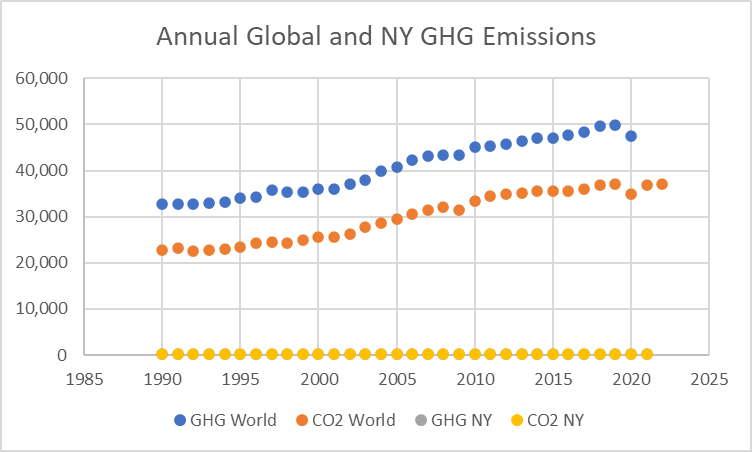
I frequently note that New York greenhouse gas emissions are less than one half of one percent of global emissions, and global emissions have been increasing by more than one half of one percent per year since 1990. This post shows that the claim is still true.
I originally used information from my post Climate Act Emission Reductions in Context to support that claim. I recently updated the analysis. I found CO2 and GHG emissions data for the world’s countries and consolidated the data in a spreadsheet. There is interannual variation, but the five-year annual average has always been greater than 0.79% until the COVID year of 2020. For the New York data I used GWP-100 data from Open Data NY through 2021 as documented in this post. New York’s share of global GHG emissions is 0.42% in 2019 so this means that global annual increases in GHG emissions are greater than New York’s total contribution to global emissions.
The data used are shown in the following table.
Global and New York State GHG and CO2 Emissions (million metric tonnes)
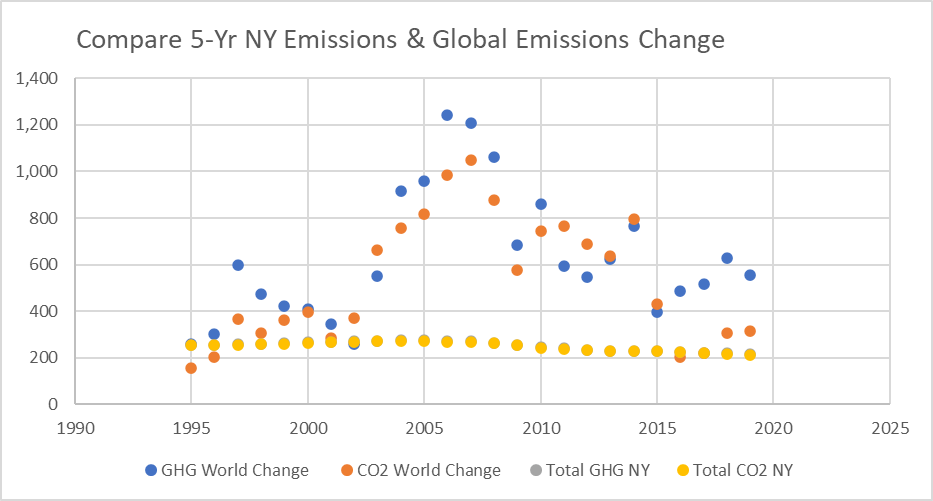
The following graph lists the five-year annual average GHG and CO2 NY emissions and the annual change in the five-year global GHG and CO2 emissions. Note that for most years the global change in emissions is greater than New York emissions. Anything New York does to reduce emissions will be supplanted by emission increases elsewhere in less than a year.
Conclusion
By any measure New York’s complete elimination of GHG emissions is so small that there will not be any effect on the state’s climate and global climate change impacts to New York. I previously showed that although New York’s economy would be ranked ninth relative to other countries, New York’s emissions are only 0.45% of global emissions which ranks 35th. This post graphically shows New York emissions are negligible compared to global emissions. The change to global warming from eliminating New York GHG emissions is only 0.01°C by the year 2100 which is too small to be measured much less influence any of the purported damages of greenhouse gas emissions. Finally, this post shows global emissions have increased more than New York’s total share of global emissions consistently since 1990. In other words, whatever New York does to reduce emissions will be supplanted by global emissions increases in a year.
The only possible conclusion is that the Climate Act emissions reduction program is nothing more than virtue-signaling. Given the likely significant costs, risks to reliability, and other impacts to New York society, I think that the schedule and ambition of the Climate Act targets needs to be re-assessed for such an empty gesture.
Richard Ellenbogen recently submitted comments as part of the record for the Department of Public Service Proceeding 15-E-0302 related to the net -zero mandate of the Climate Leadership and Community Protection Act (CLCPA), Last spring the New York State Public Service Commission (PSC) recently initiated an “Order initiating a process regarding the zero-emissions target” that will “identify innovative technologies to ensure reliability of a zero-emissions electric grid”. His comments discuss “a viable, affordable, and rapidly executable Plan B to assist NY State in reducing its carbon footprint using technologies that actually exist at scale, unlike the technologies proposed by the CLCPA which only exist at scale in the fantasies of its proponents.” I think it is important that his message gets out to all New Yorkers to try to avert the inevitable collision between aspiration and reality..
Ellenbogen is the President [BIO] Allied Converters and frequently copies me on emails that address various issues associated with the CLCPA. I have published other articles by Ellenbogen, a description of his keynote address to the Business Council of New York 2023 Renewable Energy Conference Energy titled: “Energy on Demand as the Life Blood of Business and Entrepreneurship in the State -video here: Why NY State Must Rethink Its Energy Plan and Ten Suggestions to Help Fix the Problems”, and another video presentation he developed describing problems with CLCPA implementation. There are only a few people in New York that are trying to educate people about the risks of the CLCPA with as much passion as I am, but Richard certainly fits that description. He comes at the problem as an engineer who truly cares about the environment and how best to improve the environment without unintended consequences. He has spent an enormous amount of time honing his presentation summarizing the problems he sees but most of all the environmental performance record of his business shows that he is walking the walk. The comments described here put his thoughts on the record.
CLCPA Overview
The CLCPA established a New York “Net Zero” target (85% reduction and 15% offset of emissions) by 2050. It includes an interim 2030 reduction target of a 40% reduction by 2030 and a requirement that all electricity generated be “zero-emissions” by 2040. The Climate Action Council (CAC) is responsible for preparing the Scoping Plan that outlines how to “achieve the State’s bold clean energy and climate agenda.” In brief, that plan is to electrify everything possible using zero-emissions electricity. The Integration Analysis prepared by the New York State Energy Research and Development Authority (NYSERDA) and its consultants quantifies the impact of the electrification strategies. That material was used to develop the Draft Scoping Plan. After a year-long review, the Scoping Plan recommendations were finalized at the end of 2022. In 2023 the Scoping Plan recommendations are supposed to be implemented through regulation and legislation.
Although vocal members of the Climate Action Council refused to acknowledge that not all the technology necessary for net-zero transition is available today the PSC zero-emissions target order recognizes that is not true. The Council ideologues ignored the fact that the Integration Analysis recognized that “as renewable resources and storage facilities are added to the State’s energy supply, additional clean-energy resources capable of responding to fluctuating conditions might be needed to maintain the reliability of the electric grid”. I published a post last summer summarizing the proceeding, including an overview of the questions raised by the PSC, and describing t comments I submitted.
I described the first set of comments for this Order submitted by Ellenbogen last summer. In order to make it easier for readers I have copied his submittal here. I converted his footnotes into inline references because footnotes do not lend themselves to blog posts.
About the Author
The first section of his comments describes his background and its relevance to the Proceeding.
Richard Ellenbogen an active party in the case , a resident of the State of New York, the CEO of Allied Converters, and welcomes the opportunity to provide comments as requested by the Commission in the above referenced proceeding, issued in the May 18, 2023 “Order Initiating Process Regarding Zero Target”.
I am a Former Bell Labs Engineer that has done work on the Utility System with NYSERDA and Con Ed. I also decarbonized my factory starting in 1999 and those measurements resulted in the Public Service Commissions Case 08-E-0751 to reduce power line losses. I was an invited speaker to a PSC Utility Conference in 2008 for that case on Line Loss Reduction that was initiated by Steven Keller based upon my work at the factory and a paper written at the request of Con Ed after a factory visit. I was the Keynote Speaker at the 2023 Business Council of NY Renewable Energy Conference and an invited speaker at the Dutchess County Chamber of Commerce meeting on Energy. I was an early adopter of renewable technologies going back to the 1990’s and decarbonized both my home and my business two decades ago. Between 2006 and mid-2023, the business recycled or repurposed 100% of its waste and sent nothing to a landfill. Over the past 20 years, the factory has generated between 60% and 85% of its electrical energy onsite with a carbon footprint approximately 30% lower than the Con Ed System, even prior to the closing of Indian Point.
I have lived live in an “electric” house since 2004 with a solar array and a geo-thermal heating system with 100% radiant heat using 95–100-degree water with a COP between 5.5 – 6.0, far more efficient than what most places will build under NY State guidelines, and I have driven an EV for six years. As all of the parameters in both the house and factory are measured three times per minute, I see firsthand what implementing the CLCPA will do to the load every day. The house was written up in the NY Times in November, 2008 under “Going Green: Still Challenging Turf” and the factory was written up in the Wall Street Journal under, “Westchester Plastics Maker Embraced Renewable Energy Decades Before The Gas Moratorium”.4 Additionally, I defeated Con Ed in a tariff hearing (NY State Public Service Commission Case 08-E-1426 Allied Converters, Inc. – Petition For a Declaratory Ruling on the Administration of Solar Net Metering Provisions at Locations Where Multiple (Hybrid) Energy Efficient Generation Technologies Are Installed) in 2008-2009 to allow additional interconnection of renewables and the factory became the first building in NY State with multiple sources of high efficiency grid connected generation.
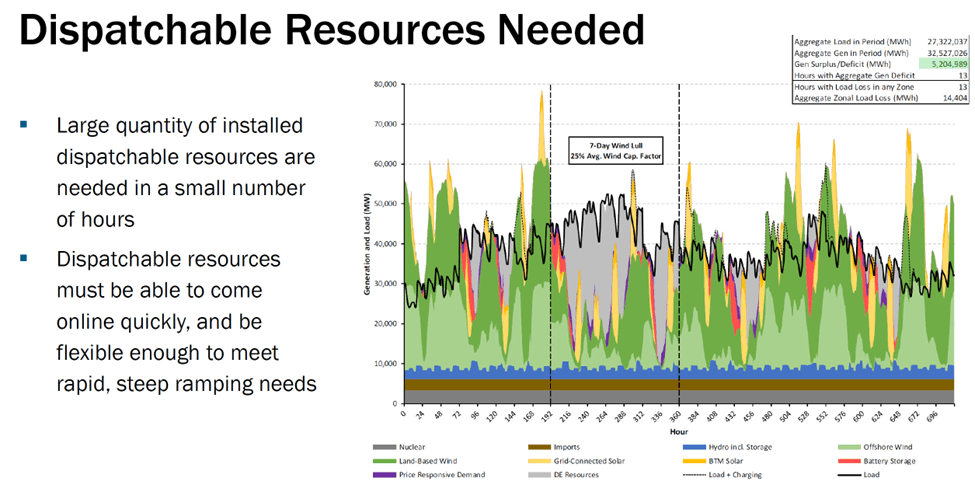
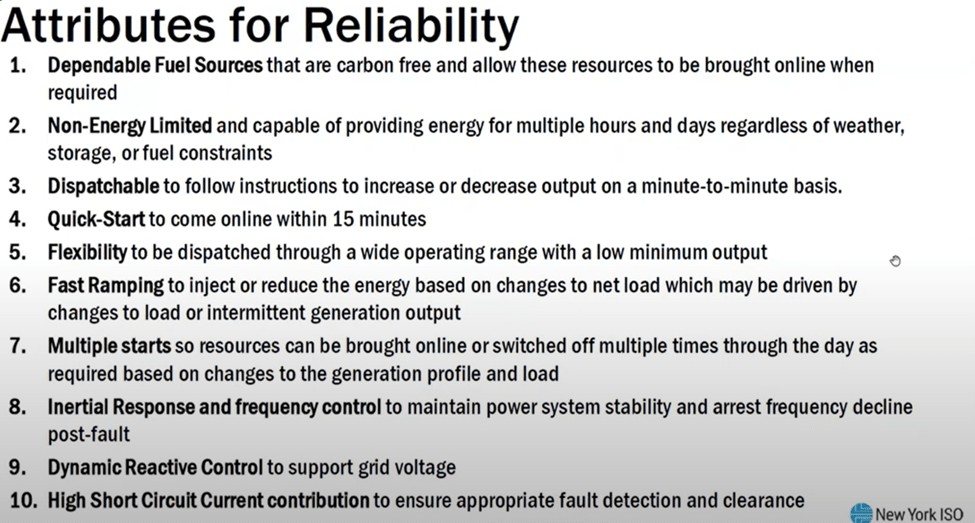
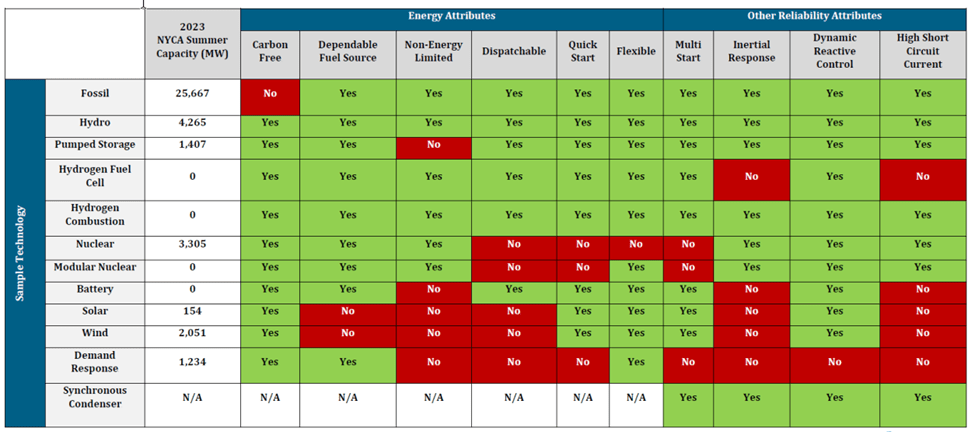
It is through this lens that I have developed an understanding of the shortcomings of renewables after over 20 years of living with them. They are a great way to reduce the reliance on fossil fuels but attempting to run the entire system on them is going to be an unmitigated disaster which will be documented in the following pages. The requirement in the CLCPA for 25 – 37 Gigawatts of Dispatchable Emission Free Generation (DEFR) by 2040 is problematic at best and is impossible to execute in the stated sixteen year time frame, especially when considering that a single 1.2 GW Power Cable will have taken nearly that long to plan, construct, and get operational (2011 – 2026). I recommend that this DEFR proceeding determine whether there is a dispatchable emissions-free resource that can provide sufficient baseload and, if not, recommend a Plan B.
Introduction
The introduction lays out reasons that things have changed since last summer that could affect the schedule and viability of the Scoping Plan list of control strategies.
Since the original filing was made in August, a lot has changed in the NY State energy landscape. Renewables projects requested $12 billion in infaltionary increases that were declined by the Public Service Commission and that led to the cancellation of numerous projects, including solar, offshore wind, and battery storage. Those resources are now being rebid, likely at a significantly higher price.
The NYISO has indicated that the peaker plants will be operating far longer than planned because of a lack of renewables needed to replace them. Champlain Hudson Power Express (CHPE) is running into issues with landholders in upstate NY and may have to make eminent domain filings for certain parcels. It will not cripple the project but may delay it.
As mentioned in the earlier filing, the NYSERDA 6 GW Energy Storage Report, on page 94 of the 104 pages documents a need for 1000+ hours of storage or 6000 GWh of storage. Text from page 94 follows in italics.
Solar output is highest in the summer and lowest in the winter, and wind output is complementary to solar, as shown in Figure 40. With seasonal storage (1000+ hours), the availability of a specific resource during critical weeks – or in between multiple critical weeks in a season matters less; instead, the cheapest form of energy, such as solar in the spring and summer, can be stored and discharged over multiple winter weeks.
Column C in Figure 1, below, shows the 6,000 GWh of storage on the same scale of generation and demand. It is almost non-existent relative to the loads and will be totally inadequate to support the system. Far more storage than that will be needed to support a renewable system, however the NYSERDA report also documents a cost of $560 per KWh. At that price, the 6,000 GWh will cost $3.4 trillion, or about 16 times NY State’s annual budget. Some have been proposing using EV batteries to support the system. Having driven an EV for six years, I am almost never near a charger except when I am charging so there would be no way to feed energy back into the system. Further, how many people will willingly use their car to support the utility when they find out they will rescive 20% less revenue for discharging than they paid for charging and that the more frequent cycling will shorten the battery life. There are also capacitive batteries now being manufactured that will have a longer life span and a greatly reduced fire risk, however that are not ready for mass distribution. They also have a much lower energy density which makes them larger. That will work for utility scale storage but not EV’s. However, the price is roughly comparable to Lithium-Ion batteries so they will still be prohibitively expensive if used to support the utility system..
The Renewable Generation shown in column D was based upon 2019 projections that are no longer applicable as several Offshore Wind contracts have been canceled and several land based solar and wind projects have been canceled and others are meeting local resistance.
Additional Issues
Ellenbogen explains that these are not the only issues.
We are reaching a crossroads in New York State whereby the cost of the renewable generation and other mandates included in the CLCPA may make it impossible to live or work here.
The New Jersey nuclear plants announced this past week that they no longer need state subsidies because of the Inflation Reduction Act (IRA) subsidies that are now available to them. This raises the question, what does nuclear generation cost relative to the renewables that NY State is having enormous difficulty getting installed? Is there a viable carbon free Plan B?
This link is from a paper from September, 2022, published by the Cato Institute, regarding the costs of different generating options and the effect of the IRA on the cost of nuclear generation.
If you look at Table 2 below, from the paper, in the lower left hand column (Baseline), you will see that the UNSUBSIDIZED HIGH CONSTRUCTION cost for nuclear generation is 14.4 cents per KWh. The expected bids for Offshore wind are expected to come in substantially higher than that and the earlier bids were nearly that large. The recently canceled wind bids in NY State varied from $107 per MWh to $118 per MWh, despite Wind generation in the United States being heavily subsidized.
The next table shows the recently canceled wind bids and their costs. The requested increase had an average cost of $167/MWh. These are going to be rebid at a higher price and many will not be available for over 6 years, at a minimum, if they are ever built. Also note that the total capacity listed is 5 GW short of NY State’s ultimate goals. I referred to the High-Cost nuclear construction scenario because that is approximately what the recently built Vogtle reactors costs correlate with. This is a worst-case comparison of nuclear generation compared to the renewable generation.
Bids For Offshore Wind In NY State
According to information developed by David Stevenson (described here) ) the new projects were approved by NYSERDA with an average nominal cost MWh of $145.07 which compares to $167.07 in the table above. The table prices were requested in December 2023 while the new projects bids were likely made in early 2023 and may not reflect the tine cost needed to obtain financing today. The projects in the table most likely would have started construction in 2025 while the new projects are slated to start in 2030. It is highly likely that by 2030 the projects could not be built at these prices and the developers will come back for higher prices.
A recent blog post presented by Parker Gallant Energy Perspectives and highlighted in a recent post by Roger Caiazza of The Pragmatic Environmentalist, analyzed the costs of various generation types in Ontario, Canada. The results are shown in the table below. In Ontario, Nuclear Generation is approximately 30% less expensive than wind and 40% less than solar despite the claims that wind and solar are less expensive. Combined cycle gas generation is slightly less than nuclear in Canada.
That shows that unsubsidized nuclear is less expensive than OSW and doesn’t kill any birds or people, despite the claims of the fear mongers. OSW and solar could cost NY State ratepayers 30% more than nuclear generation, not including the costs of the required batteries and the more extensive transmission lines needed for those technologies due to their low capacity factor. If batteries are added in to support the intermittent renewables, the costs will be higher still. As shown in the earlier analysis of battery costs based upon the NYSERDA Energy Storage Report, the required batteries will cost more than the nuclear generation, independent of the costs of the renewable generation.
Again, I have developed an understanding of the shortcomings of renewables after over 20 years of living with them. In my experience, I believe that they are a great way to reduce the reliance on fossil fuels but expectations that they can completely replace fossil fuels are misplaced. A primary concern is cost and maintaining public support for the process. Public support will evaporate quickly with the current projected costs of the wind, solar, and batteries.
Regarding “Cap and Invest”, Table 3 below is also from the Cato Paper. It shows the carbon taxes required to achieve parity between nuclear and fossil fuel generation. With the High Cost nuclear, the carbon tax required to bring nuclear into parity with combined cycle gas generation is $196 per Metric Ton of CO2. According to the EIA, combined cycle gas generation will yield 2.25 MWh per metric ton of CO2 (976 pounds per MWh). With wind being more expensive than nuclear by between 20% and 30%, it will cost between $235 – $275 per metric ton to bring wind and Combined cycle gas generation into parity. Doing the math, $235 / 2.25 to make wind cost effective when compared to natural gas, even with the current subsidies, the taxes would be over $100/MWh. It would double the cost of the energy in the entire downstate region. If electric heat is forced upon the downstate residents, a current doubling of operating costs will morph to a tripling or quadrupling of heating bills for downstate residents.
Keep in mind that natural gas prices have dropped since 2022 so the actual tax would have to be higher in 2024.
These are the kinds of taxes that Cap and Invest will have to assess to make the plan work and they are ludicrous. Even without Cap and Invest, these are the additional costs that are going to be incurred by NY State ratepayers if the CLCPA keeps progressing. What makes this situation even worse is that the state can’t effectively install generation that won’t be taxed, building owners don’t have space or can’t afford upgrades to avoid penalties from the mandates, and the proponents of this plan can’t define who is going to pay the tax, acting as if the ratepayers and the taxpayers are mutually exclusive. A Venn Diagram of NY State ratepayers and NY State taxpayers will have an enormous amount of overlap.
A Viable Low Carbon / Carbon Free Solution That Will Not Bankrupt NY State Residents and Businesses
Ellenbogen offers a pragmatic alternative.
As nuclear generation takes years to get approved and sited, new combined cycle natural gas generation that feeds the CO2 emissions into greenhouses will provide low carbon energy at a low cost for NY State ratepayers in the near term. It is the least expensive generation to build and at present, it is also the least expensive generation to operate. It can provide baseload generation so it will eliminate the cost of battery storage. As it operates with a capacity factor two to seven times higher than renewables, the cost per MWh of transmission will be that much less expensive. As an initial step, siting a large combined cycle generating plant in Central New York, near the Western end of CleanPath, would provide easy access to natural gas from Pennsylvania while also allowing CleanPath to be fully utilized, reducing its costs to taxpayers. Additionally, there is available land in Central NY that is already used for farming that would be ideal to support large greenhouses. Routes 81, 86, and 88 provide easy access for shipping the agricultural products to population centers in NY State within four hours.
As can be seen in the following graph (Figure 2) a comparison of the emissions of Long Island Generating plants, the newer Caithness plant, shown on the right, operates far more cleanly than the E F Barret Plant shown on the left. E F Barret, which is a conventional steam generating plant that is operating well past its useful lifetime because of flawed NY State policy, was supposed to be replaced by a combined cycle plant six years ago. However, the expectation that Offshore Wind would replace it has fallen flat and Long Island residents are suffering with higher emissions and twice the energy cost of what could have been built six years ago. The Offshore Wind, if it is ever built, will reduce the emissions but based upon the current cost structure, it will not improve upon the operating costs of the old plant. This issue was addressed at length in the earlier filing.
By feeding the CO2 output of the combined cycle plants into large greenhouses, it can be used to increase crop yield by providing a twelve month growing season for NY State farms and increase food security in the state while using less land and water than existing farms. It will also use far less land than renewable generation. Additionally, it will harden farming in NY State to the effects of climate change.
Unlike the 25–37 Gigawatts of as yet unknown and non-existent Dispatchable Carbon Free Generation fantasized about in the CLCPA, this technology exists now and the greenhouses will cost far less than the batteries while also generating revenue and extremely high crop yields. The greenhouses will also last well beyond the 10 year lifespan of the batteries so they are a far more cost effective capital investment to make.
Additionally, operating EV’s from combined cycle gas generation is far more energy efficient than using internal combustion engines and will greatly reduce harmful pollutant emissions in the population centers.
Conclusion
Ellenbogen concludes that an alternative that does not go to zero provides a better solution.
Interim Combined Cycle Natural Gas Generation phasing to nuclear over time is a far more cost effective and secure way to power the state than what the CLCPA is mandating. Recovering the Combined Cycle emissions in greenhouses will mitigate the negative effect of the carbon emissions. That will also provide energy security that renewables can’t, while simultaneously providing food security as climate change makes food production more challenging.
Pragmatic Environmentalist Conclusion
The Hochul Administration has supported the ideological insistence that the schedule is necessary, and that zero-emissions in the electric sector by 2040 is mandatory. This is a political construct that does not stand up to any realistic evaluation. I have shown that New York’s GHG emissions are less than one half of one percent of global emissions and that global emissions are increasing by more than one half of one percent per year. That fact destroys any urgency arguments. We have time to do this right. This also implies that not reaching zero will not influence the alleged impacts to global warming. Ellenbogen’s alternative does not meet the ideological mandates but would be affordable, reliable, and have fewer environmental impacts. I endorse his comments.
Offshore wind (OSW) is a key component of the Climate Leadership & Community Protection Act (Climate Act). This article highlights material on costs and the leasing process that suggests it is not going to end well. Affordability is a major concern of mine and the costs for offshore wind are extraordinarily high. David Stevenson prepared a summary of costs that deserves wider distribution. Bud’s Offshore Energy blog argued that unrealistic power generation deadlines should not be the focus of the Bureau of Ocean Energy Management (BOEM) leasing policy.
I have followed the Climate Act since it was first proposed, submitted comments on the Climate Act implementation plan, and have written over 400 articles about New York’s net-zero transition. The opinions expressed in this post do not reflect the position of any of my previous employers or any other organization I have been associated with, these comments are mine alone.
Overview
The Climate Act established a New York “Net Zero” target (85% reduction in GHG emissions and 15% offset of emissions) by 2050. It includes an interim 2030 reduction target of a 40% reduction by 2030 and a requirement that all electricity generated be “zero-emissions” by 2040. Because nothing says sound energy policy like one designed politicians, the Climate Act also includes a requirement for 9 GW of offshore wind by 2035. The Climate Action Council (CAC) is responsible for preparing the Scoping Plan that outlines how to “achieve the State’s bold clean energy and climate agenda.” In brief, that plan is to electrify everything possible using zero-emissions electricity. The Integration Analysis prepared by the New York State Energy Research and Development Authority (NYSERDA) and its consultants quantifies the impact of the electrification strategies. That material was used to develop the Draft Scoping Plan outline of strategies. After a year-long review, the Scoping Plan was finalized at the end of 2022. In 2023 the Scoping Plan recommendations were supposed to be implemented through regulation, PSC orders, and legislation. Not surprisingly, the aspirational schedule of the Climate Act has proven to be more difficult to implement than planned and many aspects of the transition are falling behind.
Offshore Wind Costs
Richard Ellenbogen recently submitted comments that compared nuclear costs to other proposed dispatchable emissions-free resources which I cover in another post. His analysis included an assessment of OSW, but he was unable to come up with good cost numbers. David Stevenson has some numbers available which are shown below. David has spent the last twelve years as the Director of the Center for Energy & Environment for the Caesar Rodney Institute, a bipartisan free market think tank. He has published over 150 analytic studies including major studies on the Regional Greenhouse Gas Initiative, the EPA Clean Power Plan, electric grid reliability, the public policy drivers of energy cost, offshore wind, electric vehicles, carbon capture, nuclear energy, and climate change.
But this recent growth in the offshore wind industry does not necessarily reflect its long-term health. Two substantial headwinds threaten to make projects uneconomical. One is the recent high inflation, which raised the costs of materials and labor across all industries, and the other is bottlenecked supply chains that are causing a bidding-up of the prices of materials and components needed for building wind turbines.
Hanley explained the ramifications to the OSW projects in New York and linked to the request for increases:
Stevenson produced this summary of the costs associated with these requests for more money.
At issue was a request in June by ACE NY, as well as Empire Offshore Wind LLC, Beacon Wind LLC, and Sunrise Wind LLC, which are putting up the offshore wind tower farms.
All told, the request, which was in the form of a filing before the PSC, represented four offshore wind projects totaling 4.2 gigawatts of power, five land-based wind farms worth 7.5 gigawatts and 81 large solar arrays.
All of these projects are underway but not completed. They have already been selected and are under contract with the New York State Energy Research and Development Authority, or NYSERDA, to help New York transition to a clean power grid, as called for in the Climate Leadership and Community Protection Act, approved by the state Legislature and signed into law in 2019.
Developer response suggests that “a number of planned projects will now be canceled, and their developers will try to rebid for a higher price at a later date — which will lead to delays in ushering in an era of green energy in New York”. Karlin also quotes Fred Zalcman, director of the New York Offshore Wind Alliance: “Today’s PSC decision denying relief to the portfolio of contracted offshore wind projects puts these projects in serious jeopardy,”
Later in October new projects were approved by NYSERDA with an average nominal cost/ MWh of $145.07 which compares to $167.07 in the table above. Stevenson explains that the table prices were requested in December 2023 while the new projects bids were probably made in early 2023 and may not reflect the true cost needed to obtain financing today. The original four projects cancelled most likely would have started construction in 2025 while the new projects are slated to start in 2030.
Here is what NYSERDA reported about the recent projects that include Attentive Energy One at 1,404 MW, Community Offshore Wind at 1,314 MW, and Excelsior Wind at 1,314 MW:
“The weighted average strike price of the awarded offshore wind projects over the (25 year) life of the contracts is $96.72 per megawatt hour in 2023 (real) dollars, which equates to a nominal weighted average strike price of $145.07 per megawatt hour. The strike prices comprising the weighted average cited above are subject to certain adjustments in accordance with the terms of the awarded contracts, including, in some cases, adjustments based on certain price indices, interconnection costs and/or receipt of qualifying federal support.”
Stevenson said “it looks to me that the award allows prices to increase 3% a year”. The strike price is the guaranteed price. The premium payment to the wind developer will be reduced by any revenue they receive from selling the wholesale power and any capacity value which might total about $60/MWh over the life of the projects so the net premium price might be about $85/MWh. In addition, there may be other inflation adders based on NYSERDA’s wording.
Soon after the Public Service Commission refused to approve the higher costs for four contracts last October, the Hochul Administration announced that expedited offshore wind solicitations for the state will be held early in 2024.
Projects that previously petitioned the New York State Public Service Commission for financial relief can choose to participate, though the solicitation will also emphasize competition between these and other projects, ensuring the integrity of the process and best value for New York electricity consumers, according to the press release.
The solicitations were announced in January and the deadline for submittals recently passed. The results will be announced soon.
Stevenson also provided cost estimated for two new projects have been approved in New Jersey that he expects will be similar to the expedited New York solicitations. The 2,400 MW Invenergy project will average $152.91/MWh, and the 1,342 MW Attentive One will average $187.83 over their twenty-year life considering their 2.5% and 3% per year allowed price increases. In addition, each of the 2032 startups expect 30% federal Investment Tax Credits, and New Jersey is allowing up to 15% additional inflation adjusters that could bring average costs to $175.84 and $216.01/MWh. The New York projects may have a similar inflator.
He notes that Attentive Wind One is projecting a ridiculously high 56% capacity factor. Most projects estimate capacity factors of 42% to 44%, like actual results from the five turbine Block Island and two turbine Coastal Virginia projects. Two factors suggest much lower capacity factors for larger projects. Below is the annual production curve for six years at Block Island. Notice the highest generation occurs in the spring and fall when electric demand is lowest. The Virginia turbines show a similar pattern. With many large projects all doing the same the regional grids will not be able to take all the power produced so turbines will have to be shut down, or curtailed. PJM expects average capacity factors will be 37% because of this curtailment.
European studies of offshore wind show a second impact known as the “Wake Effect”. The first row of turbines absorb wing power leaving succeeding rows with less wind energy. The impact could be to drop electric generation another 5% to 10%. Lower generation means higher guaranteed prices will be needed. We will most likely see future nominal strike prices routinely above $200/MWh.
Deadlines and Wind Deployment
Bud’s Offshore Energy blog points out that unrealistic power generation deadlines should not be the focus of the Bureau of Ocean Energy Management (BOEM) leasing policy. This argument also applies to the Climate Act’s arbitrary offshore wind deployment requirements. In reference to wind leasing issues in Oregon he explained:
As concerns about wind leasing mount, it is becoming increasingly apparent that the rush to hold auctions may not be in the best long-term interest of the wind program. The primary objective should be cost-effective and responsible development, not gigawatt deadlines.The administration’s vision for wind energy capacity, particularly the 15 GW goal for floating turbines by 2035, is unlikely to be achieved and rushing the process is not helpful.
The Confederated Tribes of Coos, Lower Umpqua and Siuslaw tribal council unanimously passed a resolution opposing offshore wind energy development off the Oregon coast.
“The federal government states that it has ‘engaged’ with the Tribe, but that engagement has amounted to listening to the Tribe’s concerns and ignoring them and providing promises that they may be dealt with at some later stage of the process. The Tribe will not stand by while a project is developed that causes it more harm than good – this is simply green colonialism.”
These two perspectives address my concerns about affordability and reliability. The Climate Action Council got bogged down in its Scoping Plan review with ideological discussions. For example, an inordinate amount of time was spent arguing whether natural gas should instead be called fossil gas in the Scoping Plan.. As a result, the Council never established criteria for affordability and reliability presuming that because the Integration Analysis projections supported their narrative that those issues would not arise.
I believe that the issues are rapidly approaching the fan of reality and they will hit soon. Soon the reality that the aspirational schedule is untenable, the costs are higher than admitted, and there are ramifications to reliability because no new fossil power are being built to replace the irreplaceable aging fossil plants before the magical resources are developed. There is a safety valve that can be used by the Public Service Commission that gives me hope that this mess can be averted. New York Public Service Law § 66-p (4). “Establishment of a renewable energy program” includes safety valve conditions for affordability and reliability. § 66-p (4) states: “The commission may temporarily suspend or modify the obligations under such program provided that the commission, after conducting a hearing as provided in section twenty of this chapter, makes a finding that the program impedes the provision of safe and adequate electric service; the program is likely to impair existing obligations and agreements; and/or that there is a significant increase in arrears or service disconnections that the commission determines is related to the program”. The political ramifications of employing this would be enormous but the impacts of the failure to pause this absurd energy plan would be much worse. I believe that the Public Service Commission should assure that New Yorkers can continue to have access to reliable and affordable electricity by defining standards for those affordability and reliability criteria.
Conclusion
I cannot over-emphasize how much I agree that the primary objective of offshore wind development “should be cost-effective and responsible development, not gigawatt deadlines”. With the addition of evolving development costs as supply chain and infrastructure support requirements become clear, it is not in the interests of New York to continue the mad rush to try to meet arbitrary gigawatt deadlines. This also applies to the development of ll solar and wind. Legitimate affordability, reliability, and environmental concerns are being ignored in the rush to build as much as possible as soon as possible.
I have been a persistent critic of the Hochul Administration’s consistent linking of any extreme weather event to climate change as rationale for the Climate Leadership & Community Protection Act (Climate Act). In my articles responding to the claims I explain that according to the National Oceanic and Atmospheric Administration’s National Ocean Service “Weather reflects short-term conditions of the atmosphere while climate is the average daily weather for an extended period of time at a certain location.” The referenced article goes on to explain “Climate is what you expect, weather is what you get.” This post is in respond to a friend who says that he has “grappled with this statement in the past, but still don’t fully understand it”
I have followed the Climate Act since it was first proposed, submitted comments on the Climate Act implementation plan, and have written over 400 articles about New York’s net-zero transition. The opinions expressed in this post do not reflect the position of any of my previous employers or any other organization I have been associated with, these comments are mine alone.
Overview
The Climate Act established a New York “Net Zero” target (85% reduction in GHG emissions and 15% offset of emissions) by 2050. It includes an interim 2030 reduction target of a 40% reduction by 2030 and a requirement that all electricity generated be “zero-emissions” by 2040. The Climate Action Council (CAC) is responsible for preparing the Scoping Plan that outlines how to “achieve the State’s bold clean energy and climate agenda.” In brief, that plan is to electrify everything possible using zero-emissions electricity. The Integration Analysis prepared by the New York State Energy Research and Development Authority (NYSERDA) and its consultants quantifies the impact of the electrification strategies. That material was used to develop the Draft Scoping Plan outline of strategies. After a year-long review, the Scoping Plan was finalized at the end of 2022. In 2023 the Scoping Plan recommendations were supposed to be implemented through regulation, PSC orders, and legislation. Not surprisingly, the aspirational schedule of the Climate Act has proven to be more difficult to implement than planned and many aspects of the transition are falling behind. In order to keep the public’s support for the transition the Hochul Administration links recent extreme weather events to climate change.
Weather vs. Climate
The link between extreme weather and climate is commonly made by the mass media egged on by climate activists. In response I have a page devoted to rebuttals to these claims. I also have another page addressing climate change attribution. I have noted that the standard climatological average is 30 years. In order to think about a change in today’s climate averages you really should compare the current 30 years against the previous 30 years. In order to get a trend, you need to look at as much data as possible. On the face of it that might seem easy but the reality is that the conditions for a representative trend are difficult to achieve. Ideally you need to use the same instruments, the same methodology, and keep the conditions around the observing location the same.
My reader friend still doesn’t understand why I am so dismissive of these claims. He wrote:
Perhaps there is a different way for you to say it that I will understand. It seems reasonable to conclude that an individual weather event can be plausibly linked to a changing climate, if the question can be asked: “But for ____ ______, would this have happened?”
I think that laypeople have heard the narrative that climate change is affecting weather today so often that it “seems reasonable that an individual weather event can be plausibly linked to a changing climate”. When I did a search on the term “what conditions can impact the weather” all that came up were articles arguing that there is a link. This story is everywhere so the presumption that there is a plausible link is logical. I show why that is wrong below.
My Response
I have given some thought to his perception relative to mine. For the record, I have a BS and a MS in meteorology, have been working in the field for 50 years, but have limited forecasting experience because my emphasis has been air pollution meteorology. I think that as a result of my background I know what is involved with weather forecasting and when I weigh all the parameters affecting a weather event relative to the limited effects associated global warming, I dismiss claims that climate change can cause any weather events. There might be a tweak in the observed observations but that is all.
Let me explain by considering what is involved with a weather forecast. Weather.US lists results from different weather forecast models. This link provides a response to the question what are weather forecast models?:
Numerical Weather Prediction
Weather models, known formally as “Numerical Weather Prediction” are at the core of modern weather forecasts. All the forecast information you see at weather.us is powered by weather models, do what are they and how do they work?
Weather models are simulations of the future state of the atmosphere out through time. Millions of observations are used as initial conditions in trillions of calculations, producing a three dimensional picture of what the atmosphere might look like at some time in the future. Massive computers are used to do these calculations at incredibly fast speeds to enable simulations to cover the entire globe, and extend up to two weeks into the future.
Global vs Regional models
There are two general types of weather models, global models and regional models. Global models produce forecast output for the whole globe, generally extending a week or two into the future. Because these models cover a wider area, and a longer timespan, they’re generally run at a lower resolution, both spatially (fewer forecast points per given area) and temporally (fewer time points get a forecast).
Regional models on the other hand have much higher resolutions, but only cover some part (region) of the globe, and only provide forecasts a couple days out in time. The advantage with these models is that their higher resolution lets them “see” features that the global models miss, most notably including thunderstorms.
Why are there so many models and how are they different?
Many different national weather centers have supercomputers that run weather models. Each of these is slightly different, using different equations to solve for various physical processes that shape our weather patterns. Many of them also have slightly different resolutions, and use slightly different combinations of initial data sources.
These slight differences multiply out through time because the atmosphere is a chaotic system. This also means any errors that the models make in the near term become exponentially larger with time. This is why the forecast for a week from now is far less accurate than the forecast for tomorrow.
Weather modelling centers attempt to control for the influence of chaos by running ensemble systems that each use slightly different initial conditions. Each ensemble “member” then produces a forecast as if its set of initial conditions were correct. This provides some way of quantifying how likely a given forecast outcome is, helping to show forecast uncertainty.
My education and background included an emphasis on measuring parameters that affect weather forecasts. The discussion above notes that models start with initial conditions that are based on these meteorological variables. The World Meteorological Organization Measurement of Meteorological Variables report describes measuring techniques for the following parameters that all affect weather forecasts:
Present weather
Past weather
Wind direction and speed
Cloud amount
Cloud type
Cloud-base height
Visibility
Temperature
Relative humidity
Atmospheric pressure
Precipitation
Snow cover
Sunshine and/ or solar radiation
Soil temperature
Evaporation
Keep in mind that the initial conditions must not only include the surface observations but also observations of wind, temperature, and humidity in layers above ground. As noted above, there are many different types of forecasts and the use of these parameters is determined by the type of forecast. For example, if I was forecasting the impacts of air pollution within 50 miles of a source, I would not be concerned about soil temperature and evaporation.
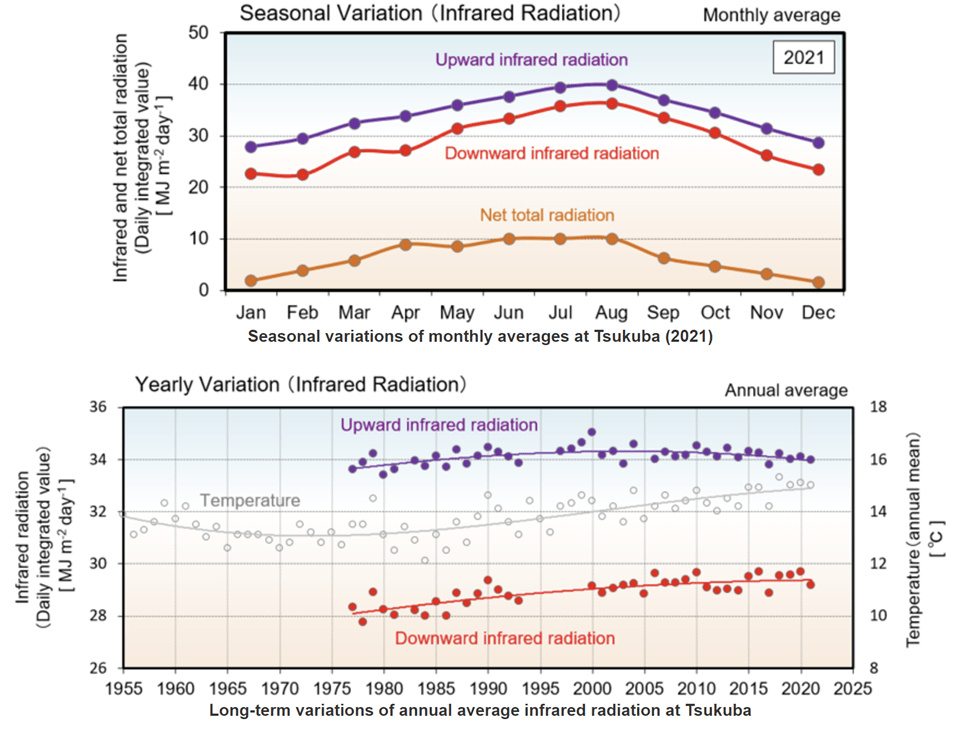
In this response I am addressing whether individual extreme weather events (less than a week) can be linked to climate change associated with the greenhouse gas (GHG) effect. Increased GHGs reduces long-wave radiation (earth surface temperature) creating warming. No weather forecast model incorporates long-wave radiation measurements because the variation is so small over a week. Claims that climate change is affecting weather events associated with the GHG effect presume that there is warming that affects the events.
Given all the parameters that affect weather forecasts I do not think that a tweak in temperature can be linked to the cause of a specific event for two reasons. The first is that the temperature effect associated with the greenhouse effect is only of many parameters associated with weather events and I don’t think it has a high impact on extreme events. The second reason is related to the discussion above about the chaotic atmosphere. It states that “Weather modelling centers attempt to control for the influence of chaos by running ensemble systems that each use slightly different initial conditions.” The change in atmospheric radiation due to GHG emissions is smaller than the initial conditions variation.
Given my lack of forecasting experience it is appropriate to consider another source. Presumably climate change would have the greatest impact on heat wave. Dr. Cliff Mass describes the effect of global warming on the Pacific Northwest Heatwave of 2021. His synopsis:
Society needs accurate information in order to make crucial environmental decisions. Unfortunately, there has been a substantial amount of miscommunication and unscientific handwaving about the recent Northwest heatwave, and this blog post uses rigorous science to set the record straight. First, the specific ingredients that led to the heatwave are discussed, including a high-amplitude ridge of high pressure and an approaching low-pressure area that “supercharged” the warming. Second, it is shown that global warming only contributed a small about (1-2F) of the 30-40F heatwave and that proposed global warming amplification mechanisms (e.g., droughts, enhanced ridging/high pressure) cannot explain the severe heat event. It is shown that high-resolution climate models do not produce more extreme high temperatures under the modest global warming of the past several decades and that global warming may even work against extreme warming in our region. Importantly, this blog demonstrates that there is no trend towards more high-temperature records. Finally, the communication of exaggerated and unfounded claims by the media, some politicians, and several activists are discussed.
Conclusion
The premise that it seems reasonable in the statement “It seems reasonable to conclude that an individual weather event can be plausibly linked to a changing climate, if the question can be asked: ‘But for ____ ______, would this have happened?’ “ is flawed. The greenhouse effect is only one of many parameters affecting weather and the change in atmospheric radiation due to GHG emissions is smaller than the initial conditions variation used to address chaotic atmospheric conditions means that there is no provable link. The suggestion that climate change causes unusual weather events ultimately is an unfalsifiable hypothesis because no test can ever show that it is not real because it cannot be detected.
On February 15, 2024 Governor Hochul announced $200 million in utility bill relief for 8 million New Yorkers. The press release quoted her as saying “Energy affordability continues to be a top priority in my clean energy agenda and this utility bill credit is just one of many actions New York is taking to reduce costs for our most vulnerable New Yorkers.” This post shows how some of the numbers given can be used to put implementation costs for the Climate Leadership & Community Protection Act (Climate Act) into context.
I have followed the Climate Act since it was first proposed, submitted comments on the Climate Act implementation plan, and have written over 400 articles about New York’s net-zero transition. The opinions expressed in this post do not reflect the position of any of my previous employers or any other organization I have been associated with, these comments are mine alone.
Overview
The Climate Act established a New York “Net Zero” target (85% reduction in GHG emissions and 15% offset of emissions) by 2050. It includes an interim 2030 reduction target of a 40% reduction by 2030 and a requirement that all electricity generated be “zero-emissions” by 2040. The Climate Action Council (CAC) is responsible for preparing the Scoping Plan that outlines how to “achieve the State’s bold clean energy and climate agenda.” In brief, that plan is to electrify everything possible using zero-emissions electricity. The Integration Analysis prepared by the New York State Energy Research and Development Authority (NYSERDA) and its consultants quantifies the impact of the electrification strategies. That material was used to develop the Draft Scoping Plan outline of strategies. After a year-long review, the Scoping Plan was finalized at the end of 2022. In 2023 the Scoping Plan recommendations were supposed to be implemented through regulation, PSC orders, and legislation. Not surprisingly, the aspirational schedule of the Climate Act has proven to be more difficult to implement than planned and many aspects of the transition are falling behind. In addition, the magnitude of the necessary costs is coming into focus despite efforts to hide them. A political reckoning is inevitable in my opinion.
Press Release
This section quotes the press release and includes my comments.
The introduction outlines the rebate plan:
Governor Kathy Hochul today announced that the New York State Public Service Commission adopted a $200 million New York State energy bill credit to be administered by the large electric and gas utilities on behalf of their customers. The energy bill credit is a one-time credit using State-appropriated funds to provide energy bill relief to more than 8 million directly metered electric and gas customers. With today’s action, more than $1.4 billion has been or will be made available to New York consumers to help offset energy costs in 2024.
The rebate totals $200 million and gives a one-time credit to 8 million directly metered electric and gas customers. Ry Rivard in the February 16 edition of Politico Pro NY & NJ Energy notes that “The money, which will be spread across eight million electric and gas customers, amounts to roughly a one-time bill credit of about $24.”
Hochul provides the rationale for the rebate:
“Every New Yorker deserves affordable and clean energy, which is why I fought to secure additional funds to provide financial relief for hardworking families,” Governor Hochul said. “Energy affordability continues to be a top priority in my clean energy agenda and this utility bill credit is just one of many actions New York is taking to reduce costs for our most vulnerable New Yorkers.”
In Albany there are always working groups, advisory councils, and other committees set up to deflect blame and/or claim benefits. In this instance the Energy Affordability Policy working group, “a group of stakeholders that included the most prominent consumer advocacy groups in the state” made the recommendations. The press release states:
The program, proposed by the Energy Affordability Policy working group, provides that the $200 million appropriation included in the FY24 State Budget will be allocated to customer accounts through a one-time credit within roughly 45 days of the utilities receiving budget funds. This utility bill relief builds on several other key energy affordability programs administered by New York State, including $380 million in energy assistance program (EAP) funding for consumers through utilities, $360 million in Home Energy Assistance Program (HEAP) funding, $200 million in EmPower+ funding through the State Budget, over $200 million in ratepayer funding to provide access to energy efficiency and clean energy solutions for low-to -moderate income (LMI) New Yorkers through the Statewide LMI portfolio and NY Sun, and more than $70 million annually through the Weatherization Assistance Program (WAP).
The Department of Public Service (DPS), in consultation with the Energy Affordability Policy working group, was tasked with designing a utility bill relief program related to the costs of utility affordability programs in recognition of energy commodity cost increases and the costs of utilities’ delivery rate increases. The working group considered multiple proposals over several months to effectuate the desired relief. The majority of the working group agreed to the staff proposal after several key modifications and recommended the PSC implement a one-time energy bill credit that would primarily benefit residential and small business electric and gas customers.
The Energy Affordability Policy working group is made up of leading consumer groups and advocates, municipalities, relevant state agencies, and utilities in New York.
Ry Rivard explains that the PSC was asked to divvy up the money in a few different ways:
New York City, for instance, urged the commission to provide different credits to gas customers depending on whether they used gas to heat their homes or just for cooking. And AARP, among others, argued the bill credits should be targeted to people who need the help most.
Ultimately, the PSC went with a simple, rough and ready way that gets money out the door quickly and just in time to help reduce winter heating bills: divide the money available by the number of customers.
A large section of the press release was devoted to congratulatory statements and descriptions of other ways the Hochul Administration wants to help:
PSC Chair Rory M. Christian said, “We applaud Governor Hochul for continuing to address the high cost of utility bills in New York State head on. While global commodity price volatility and utility delivery rate requests for increases, the Governor’s new and innovative energy affordability initiatives are coming at exactly the right time.”
Public Utility Law Project (PULP) Executive Director and Counsel Laurie Wheelock said, “PULP extends our sincere gratitude to Governor Hochul and the State Legislature for the allocation of a historic $200 million in the FY 2023-24 State Budget to address energy affordability. PULP and other stakeholders, including the Department of Public Service, Joint Utilities, and fellow consumer advocates, worked together to put forward a proposal that would provide relief to customers. The Commission’s decision today underscores a shared commitment to find ways to aid all New Yorkers, including our most vulnerable households, facing rising utility costs and volatile electric and natural gas prices. As we celebrate this milestone, PULP remains committed to identifying and advocating for additional measures to ensure energy is affordable in 2024 and beyond.”
In addition to the energy bill credit funds and EmPower+, New York State programs offer funding and technical assistance that can assist homeowners, renters, and businesses manage their energy needs. This includes:
Apply for HEAP: As of November 1, applications were being accepted for the Home Energy Assistance Program (HEAP) which can provide up to $976 to eligible homeowners and renters depending on income, household size and how they heat their home (e.g., family of four with a maximum monthly gross income of $5,838 can qualify). For more information visit NYS HEAP.
Energy Affordability Program/Low Income Bill Discount Program: This program provides income-eligible consumers with a discount on their monthly electric and/or gas bills, as well as other benefits, depending on the characteristics of the particular utility’s program. New Yorkers can be enrolled automatically if they receive benefits from a government assistance program. For more information, they should visit their utility website or links can be found at DPS Winter Preparedness.
Community-based Service Programs: Service organizations and local community agencies provide financial aid, counseling services and assistance with utility emergencies. New Yorkers can contact organizations like the American Red Cross (800-733-2767), Salvation Army (800-728-7825), and United Way (2-1-1 or 888-774-7633) to learn more.
Receive a customized list of energy-related assistance in the State: New York Energy Advisor can help income-eligible New Yorkers locate programs that help them spend less on energy and create healthier and more comfortable spaces. With New York Energy Advisor, consumers answer simple questions and get connected with energy-saving offers in New York State. Sponsored by NYSERDA and utilities, qualified New Yorkers can get help paying utility bills, receive special offers on heating assistance, and more.
EmPower+: Income-eligible households can receive a home energy assessment and no-cost energy efficiency upgrades through the EmPower+ program, administered by NYSERDA. Get more information about the program, including information on how to apply at https://www.nyserda.ny.gov/All-Programs/EmPower-New-York-Program.
Weatherization Assistance Program (WAP): Administered by New York State Homes and Community Renewal, WAP provides income-eligible households with no-cost weatherization services. Rental properties can also be served, though there are additional requirements for owners of rental properties. For more information on WAP, including how to apply, visit https://hcr.ny.gov/weatherization-applicants.
The press release ends with a bragging reference to the Climate Act. Not mentioned here is how the Climate Act initiative will affect consumer costs. It is the same oft-repeated drivel seen before so I will not comment here.
New York State’s Nation-Leading Climate Plan
New York State’s nation-leading climate agenda calls for an orderly and just transition that creates family-sustaining jobs, continues to foster a green economy across all sectors and ensures that at least 35 percent, with a goal of 40 percent, of the benefits of clean energy investments are directed to disadvantaged communities. Guided by some of the nation’s most aggressive climate and clean energy initiatives, New York is on a path to achieving a zero-emission electricity sector by 2040, including 70 percent renewable energy generation by 2030, and economywide carbon neutrality by mid-century. A cornerstone of this transition is New York’s unprecedented clean energy investments, including more than $40 billion in 64 large-scale renewable and transmission projects across the state, $6.8 billion to reduce building emissions, $3.3 billion to scale up solar, nearly $3 billion for clean transportation initiatives, and over $2 billion in NY Green Bank commitments. These and other investments are supporting more than 170,000 jobs in New York’s clean energy sector as of 2022 and over 3,000 percent growth in the distributed solar sector since 2011. To reduce greenhouse gas emissions and improve air quality, New York also adopted zero-emission vehicle regulations, including requiring all new passenger cars and light-duty trucks sold in the State be zero emission by 2035. Partnerships are continuing to advance New York’s climate action with 400 registered and more than 100 certified Climate Smart Communities, nearly 500 Clean Energy Communities, and the State’s largest community air monitoring initiative in 10 disadvantaged communities across the State to help target air pollution and combat climate change.
Discussion
In this section I will put some context around these numbers: rebate totals $200 million and gives a one-time credit to 8 million directly metered electric and gas customers which “amounts to roughly a one-time bill credit of about $24.” In my opinion it is disappointing that this rebate apparently is being given to everyone and not limited to those who can least afford high energy costs. I calculated the rebate as function of the number of household percentiles. Using 7.5 million households as the state total and dividing by the $200 million rebate gives $26.67 per household. If only half the households are eligible for the rebate the $200 million is divided by 3,375,000 the rebate goes up to $53.33. The numbers quoted earlier are different simply because a different number of households was used.
Last year legislation mandated that auction funds from the New York Cap-and-Invest (NYCI) program be allocated to the Consumer Climate Action Account (CCAA) as part of the overarching investment framework established for the New York Cap-and-Invest (NYCI) program A recent webinar on plans for NYCI noted that the first 37% of revenue generated by NYCI auctions is “set aside for the affordability accounts, the Consumer Climate Action Account, the industrial small business climate action account and administrative expenses.” The Consumer Climate Action Account itself is supposed to get 30% of the revenues. Recall that 2030 total revenue is “estimated to be between $6 and $12 billion per year” so the Consumer Climate Action Account should get between $3.3 and $1.5 billion in 2030.
The amount of CCAA rebates to individual households is a function of the set-aside and the number of households eligible for the rebate. I previously found an overview of New York household income at Statistical Atlas that I used to estimate income percentiles and number of households at different levels in the following table. Note that the total number of households from this source is slightly different than what was used before. The NYCI webinar presentation stated that there will be no benefit for households in the top 20% which according to the table corresponds to an income exceeding $126,900. There are six million households under that threshold which means that around 1.5 million households in the top 20% of income will get no benefit. Low-income households are those below $35,000 and there are 2.3 million households in that category. There are 2.1 million households above $35,000 but below $75,000. Middle income is identified as the income band that contains the median annual household income in NYS, i.e., $50-75,000 for the purpose of the NYCI analysis. That leaves 1.6 million households with income between $75,000 and $126,900.
The following table lists the CCAA rebates for the four income categories described above. I assumed that the rebates would be assigned across the income categories included for the two NYCI revenue categories ($6 to $12 billion). If the auction revenues are distributed only to low-income households with incomes less than $35K, then each household will get between $774 and $1547 per year. At the other end of the range where every household with incomes less than the 80th percentile gets an equal share then the CCAA rebate will be between $300 and $600. I think it is more equitable to focus benefits on the lower brackets. The lower table apportions the rebates so that the upper bracket gets 20% while the lower two brackets each get 40%. In this example, rebates range from $225 to $619 per year.
Hochul’s press release noted “Energy affordability continues to be a top priority in my clean energy agenda and this utility bill credit is just one of many actions New York is taking to reduce costs for our most vulnerable New Yorkers.” This program is a $200 million appropriation coming from some never mentioned pot of money in the 2024 budget. This utility bill relief builds on several other key energy affordability programs administered by New York State: $380 million in energy assistance program (EAP); $360 million in Home Energy Assistance Program (HEAP) funding; $200 million in EmPower+ funding through the State Budget; over $200 million in ratepayer funding for energy efficiency and clean energy solutions for low-to -moderate income (LMI) New Yorkers; and more than $70 million annually through the Weatherization Assistance Program (WAP).
The hypocrisy of this press release is astonishing. It claims a total of $1.41 billion for programs that help with energy affordability. Today energy affordability is affected by the energy policy of the Hochul Administration and in the future those costs will increase much more. The Administration has never quantified how these investments will affect global GHG emissions. My analysis has shown that while there is interannual variation, the five-year annual average increase in global GHG emissions has always been greater than 0.79% until the COVID year of 2020. I also found that New York’s share of global GHG emissions is 0.42% in 2019 so this means that global annual increases in GHG emissions are greater than New York’s total contribution to global emissions. Anything we do will be supplanted by emissions elsewhere in less than a year. In that context, it is appropriate to ask whether the Climate Act transition plan is appropriate because it is forcing over a billion dollars to help reduce the cost impacts of the transition. Eventually all this money must come out of the pockets of New Yorkers for no quantifiable benefit to global emissions.
Conclusion
The Hochul Administration has never admitted how much households can expect to pay to implement the Climate Act net-zero transition plan. The plan is to electrify as much energy use as possible. That means we will be required to electrify home heating, cooking, and hot water as well as moving to electric vehicles. Recent electric rate cases have included double digit increases needed so support the Climate Act transition. I have no doubt that the costs of the transition for households will far exceed these rebates described in the press release. I urge all New Yorkers to demand an open and transparent accounting of the costs so we can all decide if we are willing to foot the enormous bills coming our way. There is no way the State can rebate its way to prevent those who can least afford the regressive increases in energy prices to not be adversely affected.
To her credit Susan Arbetter, the host of Spectrum News Capital Tonight program, has tried to expose viewers to issues related to the Climate Leadership & Community Protection Act (Climate Act). Unfortunately, she allows speakers from the Hochul Administration to constantly conflate extreme weather with climate change and misleadingly claim that the costs of inaction are more than the costs of action. In this post I comment on her February 12 interview with Basil Seggos on the climate transition.
I have followed the Climate Act since it was first proposed, submitted comments on the Climate Act implementation plan, and have written over 400 articles about New York’s net-zero transition. The opinions expressed in this post do not reflect the position of any of my previous employers or any other organization I have been associated with, these comments are mine alone.
Overview
The Climate Act established a New York “Net Zero” target (85% reduction in GHG emissions and 15% offset of emissions) by 2050. It includes an interim 2030 reduction target of a 40% reduction by 2030 and a requirement that all electricity generated be “zero-emissions” by 2040. The Climate Action Council (CAC) is responsible for preparing the Scoping Plan that outlines how to “achieve the State’s bold clean energy and climate agenda.” In brief, that plan is to electrify everything possible using zero-emissions electricity. The Integration Analysis prepared by the New York State Energy Research and Development Authority (NYSERDA) and its consultants quantifies the impact of the electrification strategies. That material was used to develop the Draft Scoping Plan outline of strategies. After a year-long review, the Scoping Plan was finalized at the end of 2022. In 2023 the Scoping Plan recommendations were supposed to be implemented through regulation, PSC orders, and legislation. Not surprisingly, the aspirational schedule of the Climate Act has proven to be more difficult to implement than planned and many aspects of the transition are falling behind. In addition, the magnitude of the necessary costs is coming into focus despite efforts to hide them. A political reckoning is inevitable in my opinion.
Seggos Interview: Climate transition will be ‘the toughest thing we ever do’
The video of the interview is available but I am going to concentrate on two paragraphs from the cover story on the Capital Tonight webpage:
The cost of the doing nothing on climate will far outweigh the cost of a climate transition for New York, according to state Department of Environmental Conservation (DEC) Commissioner Basil Seggos, who addressed concerns on Capital Tonight.
“I just want to make sure viewers are clear. People are already paying for the impacts of climate change. That is a certainty. We spent $36 billion to recover from Superstorm Sandy,” Seggos said. “We see a $55 billion bill, potentially, if we don’t do the right things in New York, just on adaptation over the next 10 years.”
The political slogan “the cost of the doing nothing on climate will far outweigh the cost of a climate transition” is repeated as often as possible by representatives of the Hochul Administration. It is a deeply flawed argument for multiple reasons.
It is misleading because it refers to the costs in the Scoping Plan that do not include the costs of “already implemented” programs that exist solely to reduce GHG emissions. In other words, it does not include all the costs to reach net zero Climate Act targets only the costs of programs started after the Climate Act itself. The two biggest programs not included in the cost side of the slogan are the Zero-emission vehicle mandate (8% LDV ZEV stock share by 2030) and the Clean Energy Standard (70×30), including technology carveouts: (6 GW of behind-the-meter solar by 2025, 3 GW of battery storage by 2030, 9 GW of offshore wind by 2035, 1.25 GW of Tier 4 renewables by 2030). These programs, among others, are listed in Section 5.3: Scenario Assumptions in New York State Climate Action Council Scoping Plan Appendix G: Integration Analysis Technical Supplement Section I page 130.
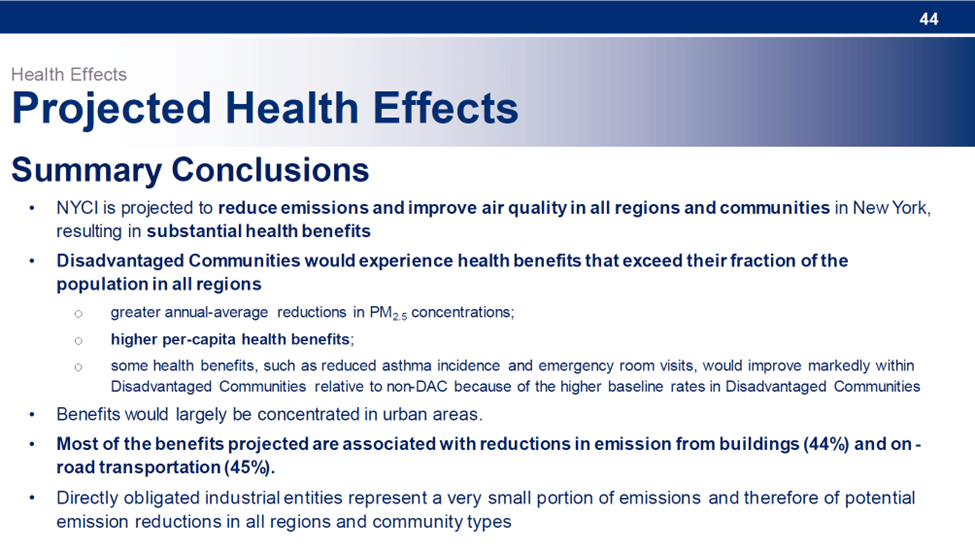
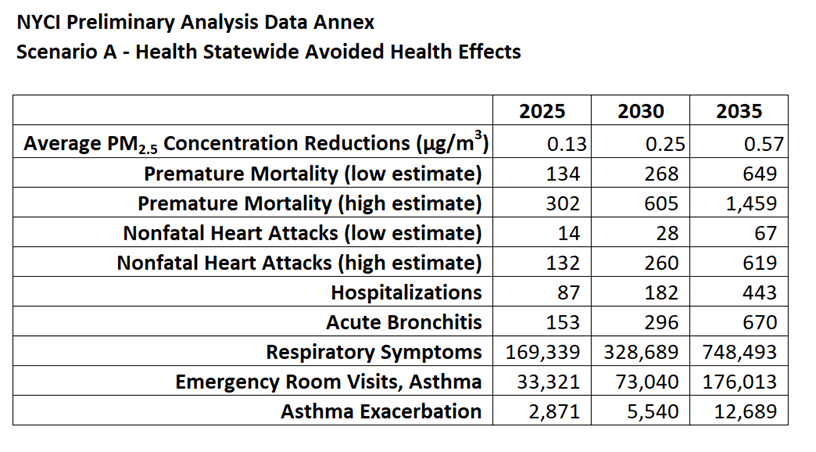
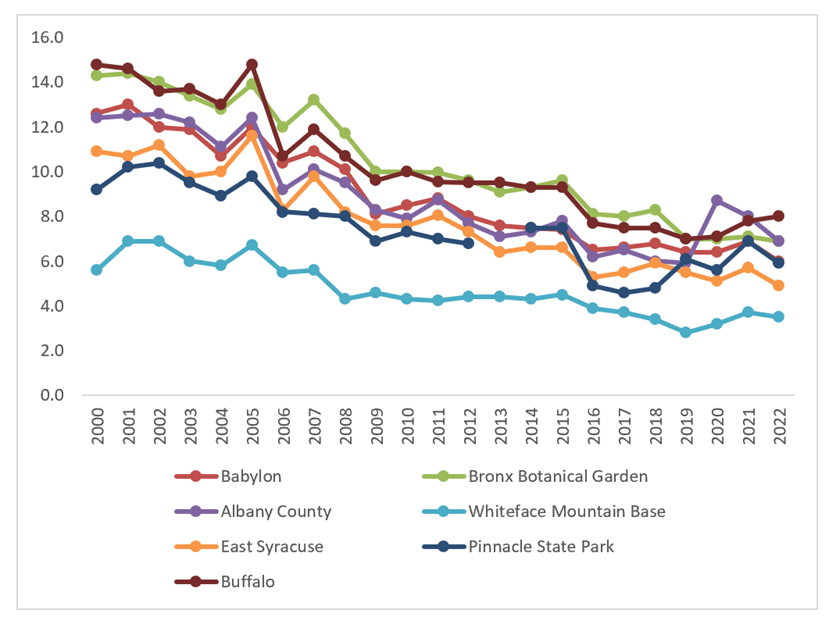
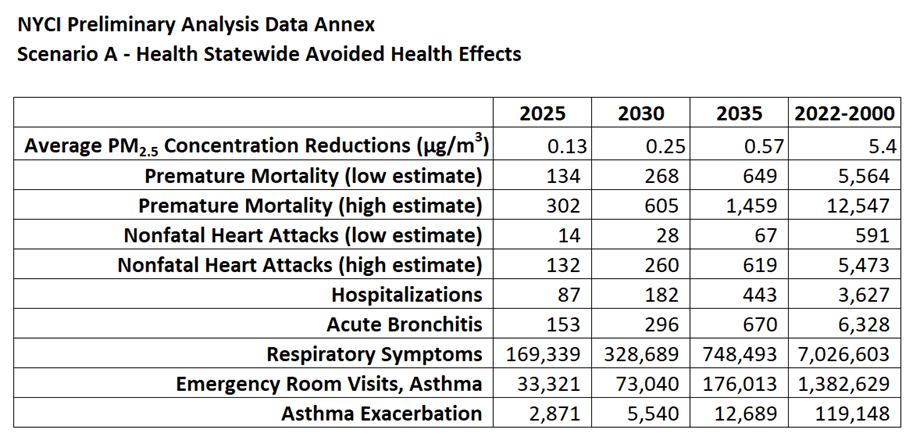
The ”cost of doing nothing” does not include benefits of GHG emission reductions. The basis for the benefits are described in the Scoping Plan Costs and Benefits white paper documents. The actual numbers in that document have been updated since its release. The Plan describes health benefits due to improvements in air quality but observed improvements in recent years are 16 times greater than those projected for the Climate Act. If the State can show that the health benefits projected have been observed comparable to those observed then these benefits are supportable but there has never been any attempt to validate the estimates.
The benefits include a couple of tenuous estimates. The first is for “active transportation”. The active transportation health theory claims that as people are forced out of their personal vehicles some will switch to walking and biking. Those activities are healthier so there is a benefit. The increased active transportation benefit of $39.5 billion is based on a first-order approximation based on state-wide numbers but the benefits will likely only occur in certain areas. As a result, the benefit estimate is far too high. The second is for energy efficiency interventions benefits in low- and middle-income homes. The majority of the health benefits claimed are the result of “non-energy interventions”. The Climate Act intends to transform the energy sector so it is disingenuous to claim health benefits not directly related to energy efficiency programs themselves. Of the $8.7 billion in benefits claimed $3 billion is due to reduction in asthma-related incidents resulting from better ventilation not directly due to energy efficiency. The $2.4 billion in benefits from reduced trip or fall injuries and reduced carbon monoxide poisoning benefits are non-energy interventions and should not be claimed as benefits for GHG emission reduction programs.
The final reason that the slogan is flawed is the biggest. There are issues with the benefits for the societal avoided cost of GHG emissions known as the social cost of carbon or value of carbon. The values used are determined by a wide range of value judgements and economic projections. The Climate Act manipulates emissions to increase benefits and uses a lower discount rate than current Federal guidance resulting in societal benefits of GHG emission reductions that are 4.5 times higher for 1990 emissions and 5.4 times higher for 2019 emissions than other jurisdictions. The largest manipulation of these benefits is caused by incorrect guidance for calculating benefits. In particular, the benefits of reductions are counted multiple times. If only that error is corrected the total benefits do not outweigh the projected costs.
Another Climate Act narrative tactic is to claim that people are already paying for the impacts of climate change. Seggos said “We spent $36 billion to recover from Superstorm Sandy” implying that climate change was responsible for those costs. The difference between weather and climate is constantly misunderstood by Climate Act proponents that make this simplistic argument.
According to the National Oceanic and Atmospheric Administration’s National Ocean Service “Weather reflects short-term conditions of the atmosphere while climate is the average daily weather for an extended period of time at a certain location.” The referenced article goes on to explain “Climate is what you expect, weather is what you get.” Seggos consistently claims that extreme weather is proof of climate change but the interview showed he has no meteorological expertise whatsoever. More than once when described implementation challenges he stated that the state is facing trade winds but the appropriate term is head winds.
If, in fact, Superstorm Sandy was connected to climate change then the weather over extended periods of time should show increased hurricane activity and there should be a trend in disaster losses. Roger A. Pielke, Jr, specializes in tracking these parameters so I checked his work.
He posted information in June 2022 on hurricane trends on Atlantic hurricane activity. He noted that:
1. The Intergovernmental Panel on Climate Change, in its latest report, concluded that there remains “no consensus” on the relative role of human influences on Atlantic hurricane activity.
Here is what the IPCC says exactly:
“[T]here is still no consensus on the relative magnitude of human and natural influences on past changes in Atlantic hurricane activity, and particularly on which factor has dominated the observed increase (Ting et al., 2015) and it remains uncertain whether past changes in Atlantic TC activity are outside the range of natural variability.”
One reason for the inability to unambiguously attribute causality to Atlantic hurricane activity is the large interannual and interdecadal variability.
Pielke, Jr. argues that in order to assess disaster loss trends ”it is necessary to normalize disaster losses by taking into account changes in exposure and vulnerability.” He explains that:
The UN Sendai Framework recommends looking at disaster losses as a proportion of GDP as a method of normalization.
Since 1990, the toll of disasters as a proportion of the global economy has gone down from about 0.25% of GDP to less than 0.20%. That is good news and indicates progress with respect to the goals of the Sendai Framework.
Some quick questions and answers.
Can we conclude from this data that climate change is making disasters more frequent or costly? No
Can we conclude from this trend that climate change signals are not detectable in trends in various extreme events? No
What can we say about climate change by looking at this graph? Nothing
What about those journalists and campaigners who claim that economic losses from disasters indicate the detection and attribution of trends in extreme weather? They are wrong
How would we know if disasters are becoming more costly due to climate change? Follow this methodology
Needless to say the Scoping Plan ignored these recommendations and observations when it justified the Climate Act. It is also obvious that these inconvenient results are routinely ignored by apologists for the Climate Act.
There is one final aspect of the slogan “the cost of the doing nothing on climate will far outweigh the cost of a climate transition” that needs to be considered. The implication is that New York’s investments for the climate transition will make a difference. I recently updated my post Climate Act Emission Reductions in Context that documented how New York GHG relate to global emission increases. I found CO2 and GHG emissions data for the world’s countries and consolidated the data in a spreadsheet. There is interannual variation, but the five-year annual average has always been greater than 0.79% until the COVID year of 2020. The Statewide GHG emissions inventory came out in December but the comparable GWP-100 data that I used from Open Data NY through 2021 are not available. This analysis relies on last year’s data. New York’s share of global GHG emissions is 0.42% in 2019 so this means that global annual increases in GHG emissions are greater than New York’s total contribution to global emissions. Our actions will have no effects on the next superstorm because the increase in annual global emissions are greater than our total emissions. Implying other wise is disingenuous.
With all due respect to Commissioner Seggos, his cost benefit rationale for the Climate Act transition or his claim that climate change is affecting costs now do not stand up to scrutiny. Consider that the largest benefit claimed is based on counting benefits multiple times. If I managed to lose five pounds and keep it off for five years I cannot claim that I lost 25 pounds but that is what the basis for the slogan is doing. The IPCC science directly contradicts the insinuation that hurricane trends are outside the range of normal variability.
Conclusion
Seggos claimed that the climate transition will be ‘the toughest thing we ever do’. I think it might be the worst thing we ever do. The Climate Act transition plan is poorly documented, results are obfuscated, and there are no transparent cost estimates. As a result, I do not believe that the Hochul Administration has made a persuasive case that the transition is feasible with regards to affordability and reliability. I am disappointed that the media does not call them out on this.
Dennis Higgins passes on his commentaries associated with New York’s Climate Leadership and Community Protection Act (Climate Act). I asked his permission to present his status analysis of the transmission system components of the Climate Act net-zero transition that was published in AllOtsego. I also became aware of a puff piece claiming all is well by Basil Seggos, co-chair of the Climate Act’s Climate Action Council that provides the State’s story. Comparing the two pieces I don’t see how this will end well.
Dennis taught for just a few years at St Lawrence and Scranton University, but spent most of my career at SUNY Oneonta, teaching Mathematics and Computer Science. He retired early, several years ago, in order to devote more time to home-schooling his four daughters. (Three will be in college next year and the youngest opted to go to the local public school, so his home schooling is ending this June.) Dennis and his wife run a farm with large vegetable gardens. They keep horses and raise chickens, goats, and beef. He has been involved in environmental and energy issues for a decade or more. Although he did work extensively with the ‘Big Greens’ in efforts to stop gas infrastructure, his views on what needs to happen, and his opinions of Big Green advocacy, have served to separate them.
The game plan for the Climate Act public narrative is to point to a recent weather event and claim that is proof of climate change. The difference between weather and climate is never acknowledged and there has never been any estimate of how much Climate Act implementation will affect the alleged weather impacts. Seggos follows the script:
As made clear by the recent storms that ravaged many Long Island communities, time is running short to comprehensively address the flooding, erosion, and regional economic damage being wrought by increasingly common extreme weather events. We are witnessing the impacts of the climate crisis in real time, both here in New York and across the planet. It’s time for bold action at every level of society.
The next item in the usual script is to tout some new effort and its alleged benefits. That is the primary purpose of this article:
With the ongoing leadership of Governor Kathy Hochul, New York State is taking sweeping actions to reduce the many sources of greenhouse gas emissions that cause climate change. And in her recent State of the State Address and 2024-25 Executive Budget, Governor Hochul proposed a suite of actions to address climate change’s effects – including $435 million for initiatives to support long-term resiliency projects and protect communities across the state.
The funding will help create a new ‘Resilient & Ready Program’ with resources for low- and moderate-income households experiencing flood damage to assist with necessary repairs in the aftermath of storms, as well as improvements to prevent future damage.
The Governor also proposes a ‘Blue Buffers’ Voluntary Buyout Program to compensate residents in communities most vulnerable to flooding so they can relocate to another area with lesser flood risk. This not only saves taxpayer dollars when inevitable flooding occurs, it spares households the tangible and emotional losses that come with each rising tide and record rainfall.
Supported with $250 million from the $4.2 billion Clean Water, Clean Air and Green Jobs Environmental Bond Act, Blue Buffers would first educate property owners on the benefits of relocating homes and businesses regularly affected by high water, sea-level rise, and storm surges, and then partner with willing sellers on projects that could be eligible for buyouts. Purchased properties then revert to becoming permanently protected as open space, serving as a buffer against future flooding and benefiting the resiliency of the surrounding community.
Building on past investments, Governor Hochul is bolstering New York’s efforts to mitigate the effects of climate change with new proposals to repair aging flood control projects and remove hazard dams. The Governor also directed an update of Coastal Erosion Hazard Area maps essential to the protection of beaches, dunes, and bluffs that maintain and enhance flood resilience, and to overhaul building codes design to create higher standards for resistance to wind, snow, and temperature extremes.
As many Long Islanders know, since Superstorm Sandy, New York aggressively stepped-up efforts to boost targeted investments for critical infrastructure, flood-proofing, shoreline restoration, and disaster response. The response included ongoing work with federal and local partners to use every tool at our disposal.
The recent U.S. Army Corps of Engineers determination of eligibility for the process to assess, fund, and repair their damaged coastal projects on Fire Island, as requested by the Governor and Department of Environmental Conservation (DEC), is welcome news. It is one of many projects that DEC will continue to help implement to protect homes, critical infrastructure, and shorelines.
Climate change is here. With the ongoing cooperation and collaboration of Long Islanders, New York’s comprehensive approach to adaptation and resiliency will help ensure the Empire State is prepared for the gathering storm.
As far as I can tell the only way for the State to meet the Climate Act targets is magical game-changing technology. I do not see anything in these projects that makes me think that these programs are game changers. Another component of the narrative is to never discuss the status of the transition and the component programs. The question whether the existing programs are having any sort of an effect are not mentioned and no issues associated with recently proposed programs are ever addressed.
Flawed Energy Plan Moves Forward
On the other hand, Dennis Higgins’s article Flawed Energy Plan Moves Forward in AllOtsego takes a critical look at one new effort. This one is associated with transmission development.
Legislation proposed in Albany would create “RAPID,” a new department in the Office of Renewable Energy Siting to accelerate transmission buildout. Per megawatt-hour—amount of energy moved—those new lines will be very expensive. We must build full nameplate transmission for wind, which has a capacity factor under 25 percent. Solar has a capacity factor of under 14 percent: Although full capacity generation might occur mid-day in summer, much of the rest of the time solar yields little or no energy. Transmission for hundreds of solar and wind resources represents a lot of expensive wire to buy and install and maintain; wire which will need to be run across private land; wire that mostly will move nothing at all.
With each of New York’s staggering missteps in decarbonization efforts, we reflect on the mess we’re in. ORES itself has stalled out in efforts to site intermittent resources. Solar and wind builders cancelled contracts late last year when the state would not simply award them more money. They are rebidding, and the state will make new, more expensive, awards. Upstate communities are pushing back at the state’s efforts to locate solar and wind projects where local laws say “no” to industrial development.
New York gets about 20 percent of its baseload energy from hydroelectric on the St. Lawrence and Niagara rivers. Solar and wind currently account for about 7 percent of total state electricity. The fast approaching 70-by-30 goal in the Climate Leadership and Community Protection Act requires that 70 percent of the state’s electricity come from renewables. In other words, 50 percent of the state’s capacity must come from solar and wind. The state must multiply all the installed solar and wind built over the last 20 or more years by seven- or eight-fold in the next six years. Hochul has no ruby slippers and no magic wand, so press releases can safely be ignored. The 70-by-30 CLCPA goal is not going to happen.
Still, the state has decided lack of transmission must be the culprit. Let’s take a closer look at some of the problems with the state plan.
In its 20-year “Outlook” report, the grid operator NYISO detailed transmission constraints across Long Island, the Southern Tier and Finger Lakes. These will prevent energy moving from intermittent resources to downstate through this decade, and maybe the next. Can we fix the state plan by building high-voltage lines over rural New Yorkers’ objections to support energy resources that may never exist?
In its 2023 Power Trends, NYISO indicated that most—70 percent, or about 17,000 megawatts—of the state’s fossil-fuel capacity will need to be available after 2030. NYISO has already determined that peakers, which CLCPA says must be shut down, will need to be kept online. The storage projected in state planning, a hundred times the largest lithium-ion battery on earth and costing many billions of dollars, if fully charged, would not power New York City for a day. Alberta Canada, like Texas, recently issued energy alerts to its citizens as it discovered that wind power does not work well when it is very cold. Of course, solar generates almost nothing in the winter. Assuming we could get anyone in Albany to listen, is there some sort of broader lesson in all this?
California—following the same wacky blueprint New York is using—has had 20 years to build out its solar and wind assets, including transmission lines to move generated energy. California gets twice the electricity from every panel that New York could hope to get. California has deserts to site intermittent resources and transmission, while New York must sacrifice its farmland and forest. California exports solar to Nevada at a loss to avoid curtailment, yet still dumped something like three terawatt-hours of energy in 2023, enough to keep the lights on in New York City for a week. California has struggled to reduce reliance on fossil fuels: It has built new gas plants and still needs to import coal-fired electricity to ensure reliability.
The 2015 Mark Jacobson publication—which was in part the model for New York’s energy plan—was soundly debunked by about two dozen climate scientists two years before the CLCPA was enacted. The Jacobson paper is nevertheless a sort of bible to the Big Greens. As noted in MIT’s technology review, that paper “contained modeling errors and implausible assumptions that could distort public policy and spending decisions.” Consequently, the CLCPA and the resulting scoping plan, following similar flawed analysis, have already led to “wildly unrealistic expectations” and “massive misallocation of resources.”
“Jacobson and his coauthors dramatically miscalculated the amount of hydroelectric power available and seriously underestimated the cost of installing and integrating large-scale underground thermal energy storage systems…They treat U.S. hydropower as an entirely fungible resource. Like the amount [of power] coming from a river in Washington state is available in Georgia,instantaneously… )“
Following this flawed plan, it always looks like there is a transmission problem, since the grid is not one big copper plate.
In fact, no new energy solution or gigantic storage mechanism is needed at all. New York only needs to look around the world at those places that have successfully decarbonized their grids. New York only needs to look in the mirror: the downstate grid is over 90 percent “dirty,” powered by gas and oil. Upstate is over 90 percent emission free, and like those large economies that have cut fossil-fuel use, it is powered by hydro and nuclear.
But don’t tell Albany: New York is intent on pursuing an expensive land-hungry plan which we already know will fail.
Discussion
The Hochul Administration is not addressing the implementation issues associated with their Climate Act net-zero transition. Instead, we get a barrage of slick announcements claiming that we have to do something and here’s a whole new pile of “something” that we think might work, will appeal to the constituencies that demand action, and likely provide political payola to some politically connected constituency.
Dennis Higgins provides the other side of the story. He describes numerous issues with the transition and relates them to the fundamentally flawed Jacobsen/Howarth transition plan. The fact is that if New York State is serious about de-carbonizing the electric grid nuclear power must be part of the solution. Dennis advocates for that position but to little avail. Without a commitment to nuclear this will never work.
Conclusion
Higgins noted that his piece was incomplete: “The mess is so big you can’t say it all — fiscally irresponsible/unsound engineering and, already failed where it’s been tried.” He noted that he did not have the space to make the point that RAPID will give developers authority to use eminent domain for transmission. He thinks that this is something we all need to push back on with local and state elected reps.
I agree with Dennis that “New York is intent on pursuing an expensive land-hungry plan which we already know will fail.” He speaks to reality and in the end reality always wins.
I have been following the. Climate Leadership & Community Protection Act (Climate Act) since it was first proposed and most of the articles described below are related to the net-zero transition. I have devoted a lot of time to the Climate Act because I believe the ambitions for a zero-emissions economy embodied in the Climate Act outstrip available renewable technology such that the net-zero transition will do more harm than good. The opinions expressed in this article do not reflect the position of any of my previous employers or any other company I have been associated with, these comments are mine alone.
Videos
Energy and Illusions: Power density – Lots of resources going in, not much energy coming out means a resource that is never going to work
Isuru Seneviratne from Nuclear New York suggested a video series that I also highly recommend.
This 5-piece docu-series as ESSENTIAL as we advocate for climate policies that do not disproportionately harm the poor. It’s a riveting wake-up call made by independent thinkers who dig deep beneath the gaslighting that goes on from Enron to German “Greens.”
Juice: Power, Politics, And The Grid is a five-part documentary series produced by two Austin-based filmmakers, Tyson Culver and Robert Bryce, that follows the success of their first film: Juice: How Electricity Explains the World, which is now available on streaming platforms around the world.
The series takes viewers from Texas to Tokyo to expose the perils facing our electric grid. It shows how we can improve the reliability of our most important energy network and address climate change by embracing nuclear energy.
Juice: Power, Politics & The Grid features interviews with top thought leaders, including historian Patty Limerick, political scientist Roger Pielke Jr., journalist Michael Shellenberger, civil rights leader Robert Apodaca, World Nuclear Association director Sama Bilbao, Sacramento County Sheriff Jim Cooper, Canadian nuclear activist Chris Keefer, author Meredith Angwin, former IEA director Nobuo Tanaka, Campaign for a Green Nuclear Deal founder Madi Hilly, and many others.
While offering a sober assessment of the challenges facing the $5 trillion-per-year global electricity business, the series concludes with a hopeful look at the future — and the future of climate change — by featuring the activists who are helping fuel renewed interest and investment in nuclear power here in the U.S. and around the globe.
Electric Vehicles
I have planned to put together a post on electric vehicles for weeks but did not get around to it. This post at Irina Slav’s substack Irina Slav on energy summarizes most of the points I wanted to make in my planned article better than I would have done. She sums up the issues:
In a commentary piece for MarketWatch earlier this month, former White House director of economic policy Todd G. Buchholz compared EVs to electric bread makers, arguing that, just like bread makers, EVs are a fad that will eventually fade.
“The 1990s bread-machine fad never benefited from public subsidies, government mandates or furious discounting to gain market share. If it had, perhaps it would have continued for a few more years,” Buchholz wrote, going on to quote President Dwight Eisenhower as saying that “you don’t lead by hitting people over the head: That’s assault, not leadership.”
Another topic that I have been meaning to address is the current state of offshore wind.
Bud’s Offshore Energy (BOE) “Energy Production, Safety, Pollution Prevention, and More” delves into the details of offshore wind development. He recently reviewed the Bureau of Ocean Energy Management and National Oceanic and Atmospheric Administration Fisheries North Atlantic Right Whale and Offshore Wind Strategy. His key takeaways:
The document effectively summarizes the dire state of the North Atlantic Right Whale.
The BOEM/NOAA strategy is to monitor and further assess the impacts.
The need for mitigation will be determined through collaborative processes.
This industry-friendly strategy contrasts sharply with the restrictive operating requirements proposed for the more speculative Rice’s whale expanded area in the Gulf of Mexico.
He describes the status of the Right Whales:
NARW status (pages 7-14):
Roughly 237 NARWs have died since the population peaked at 481 in 2011, exceeding the potential biological removal (PBR) level on average by more than 40 times for the past 5 years (Pace III et al. 2021).
Human-caused mortality is so high that no adult NARW has been confirmed to have died from natural causes in several decades (Hayes et al. 2023).
Most NARWs have a low probability of surviving past 40 years even though the NARW can live up to a century.
There were no first-time mothers in 2022.
About 42% of the population is known to be in reduced health (Hamilton et al. 2021)
A NASEM study confirmed that offshore wind has the potential to alter local and regional hydrodynamics
“Effects to NARWs could result from stressors generated from a single project; there is potential for these effects to be compounded by exposure to multiple projects.” (p. 14)
I cannot imagine any scenario where a species this stressed will survive when hundreds of massive wind turbines are built across the migration routes. See the figure showing where the turbines will be built and the whales are for March.
David Wojick describes three events affecting offshore wind development. Last year a number of developers cancelled their contracts to provide offshore wind power but now the first to come back to the trough seeking more money was approved in New Jersey. Wojick expects that other states will follow that lead. On the other hand a major new lawsuit has just been filed. He explains that the suit alleges that the” Federal agencies that have quickly issued the offshore wind permits have simply ignored the destructive environmental effects. This is especially true for the collective impact of combinations of nearby projects.” New York has similarly ignored the cumulative environmental impact of the proposed resources for the Climate Act. Finally, he notes that “One of the plaintiffs is the Save the Right Whale Coalition. Here, the narrow issue is the threat posed by enormous offshore wind development to the severely endangered North Atlantic Right Whale.” He includes a link to “a good picture of one of the unbelievably huge monopiles driven into the sea floor to hold up an offshore wind turbine generator” that shows what the whales are up against. Imagine the energy needed and noise created when these monstrosities are driven into the sea floor.
The mad rush to offshore wind will not just affect whales. Craig Rucker writing at Cfact describes the stress on commercial fisherman. He points out issues observed elsewhere and the lack of analysis before development occurs here.
This assessment deserves more attention and when the Climate Act implementation issues settle down I will return to this “scientific investigation into how climate change is affecting the communities, ecosystems, infrastructure, and industries of the Empire State.” If you are looking for an unbiased analysis of climate change in New York look elsewhere.
Without even looking hard this finding sets baloney alarms off:
Summary Finding 4: Sea level along New York State’s coastline has risen almost 1 foot in the past century and is projected to increase by another 1 to 2 feet by midcentury. Sea level rise will make chronic flooding more common in low-lying coastal neighborhoods, lead to intrusion of salt water into groundwater and freshwater coastal ecosystems, and yield more destructive storm surge during coastal storms. Coastal communities will benefit from planning and design that accounts for future sea levels.
They say that one foot in the past century has been observed. They are claiming that 1 to 2 feet additional sea-level rise will occur in half a century. For that to happen the sea level rise rate must at least double. There is no indication of such an accelerated sea-level rise rate. They have no shame hyping the most extreme estimates for climate models.
Ed Reid, Jr. writing at Right Insight does a nice job summarizing reasons why the fantasy that “intermittent renewable generation combined with electricity storage provides a reliable energy system at lower energy cost than the predominantly fossil fueled energy system it would replace.” He explains:
This fantasy is a complete and utter fraud, since those promoting it know that the generation technology they are promoting is intermittent and that the storage that they suggest would be required to overcome this intermittency and provide a reliable energy grid is inadequate, extremely expensive and unsuitable for the application.
Thomas Shepstone points out that proponents of the net-zero transition don’t want a discussion. Jo Nova brings it all together in an excellent post at her site titled “One third of UK teenagers think climate change is deliberately exaggerated.” She describes a perfect example of this in a recent article in the left-wing Guardian. The article claims that arguments that “climate solutions do not work, climate science and the climate movement are unreliable, or that the effects of global heating are beneficial or harmless” should be banned.
In January 2023 I wrote an article describing Dr. Robert Howarth’s statement supporting his vote to approve the Climate Leadership and Community Protection Act (Climate Act) Scoping Plan. Roger Pielke, Jr. recently did an interesting piece on the Biden Administration decision to halt the permitting of the continued expansion of U.S. liquified natural gas (LNG) export capacity that featured a link to Howarth and his position on methane. It provides more evidence that a “Professor of Ecology & Environmental Biology” is unqualified to be considered an expert on methane emissions. His misleading guidance adversely impacts the New York Cap-and-Invest program.
I have followed the Climate Act since it was first proposed, submitted comments on the Climate Act implementation plan, and have written over 400 articles about New York’s net-zero transition. The opinions expressed in this post do not reflect the position of any of my previous employers or any other organization I have been associated with, these comments are mine alone.
Overview
The Climate Act established a New York “Net Zero” target (85% reduction in GHG emissions and 15% offset of emissions) by 2050. It includes an interim 2030 reduction target of a 40% reduction by 2030 and a requirement that all electricity generated be “zero-emissions” by 2040. The Climate Action Council (CAC) is responsible for preparing the Scoping Plan that outlines how to “achieve the State’s bold clean energy and climate agenda.” In brief, that plan is to electrify everything possible using zero-emissions electricity. The Integration Analysis prepared by the New York State Energy Research and Development Authority (NYSERDA) and its consultants quantifies the impact of the electrification strategies. That material was used to develop the Draft Scoping Plan outline of strategies. After a year-long review, the Scoping Plan was finalized at the end of 2022. In 2023 the Scoping Plan recommendations were supposed to be implemented through regulation, PSC orders, and legislation. Not surprisingly, the aspirational schedule of the Climate Act has proven to be more difficult to implement than planned and many aspects of the transition are falling behind, and the magnitude of the necessary costs is coming into focus.
Howarth and the Climate Act
Howarth takes pride in his role in the Climate Act. I previously explained that the statement of Robert W. Howarth, Ph.D., the David R. Atkinson Professor of Ecology & Environmental Biology at Cornell University was very illuminating relative to the motives of the Climate Act authors. He reiterated his claim that he played a key role in the drafting of the Climate Act, developed the methane requirements, and credited one politician for getting the Act passed:
Assembly Person Steven Englebright was hugely instrumental in the passage of the Climate Leadership & Community Protection Act that established the Climate Action Council. I thank him for his leadership on this, and particularly for his support of the progressive approach on greenhouse gas emissions that is a central part of the CLCPA. I originally proposed this to Assembly Person Englebright in 2016, and he enthusiastically endorsed and supported it through multiple versions of the bill that finally led to passage of the CLCPA in 2019. In this accounting for greenhouse gases, a major government for the first time ever fully endorsed the science demonstrating that methane emissions are a major contributor to global climate change and disruption. Further, in passing the CLCPA New York recognized that consumption of fossil fuels (and not simply geographic boundaries) is what matters in addressing the climate crisis. New York wisely banned the use of high-volume hydraulic fracturing (“fracking”) to develop shale gas in our State. But since the time of that ban, the use of fossil natural gas has risen faster in our State than any other in the Union. Methane emissions from this use of shale gas are high, but much of that occurs outside of our boundaries in the nearby states of Pennsylvania, West Virginia, and Ohio. Through the CLCPA, the citizens of New York are taking responsibility for these out-of-state emission caused by our use of fossil fuels, particularly for fossil natural gas. The way to reduce these emissions is to rapidly reduce our use of fracked shale gas.
Unfortunately, Howarth’s influence on Climate Act implementation also extended into the Climate Action Council. As a member of the Climate Action Council, Howarth was considered a subject matter expert and most members unquestioningly accepted whatever he said. This deference to his concerns is also apparent in the Integration Analysis and Scoping Plan. In my previous article I explained why many of his claims were not supportable.
Methane
At the time the Climate Act was written it incorporated unique emissions accounting requirements that elevate the importance of methane to Climate Act compliance. In particular, the Climate Act specifies that the global warming potential (GWP) must be calculated over a 20-year time horizon. The Inter-governmental Panel on Climate Change (IPCC) describing time horizons and the GWP[1] notes:
“The GWP has become the default metric for transferring emissions of different gases to a common scale; often called ‘CO2 equivalent emissions’ (e.g., Shine, 2009). It has usually been integrated over 20, 100 or 500 years consistent with Houghton et al. (1990). Note, however that Houghton et al. presented these time horizons as ‘candidates for discussion [that] should not be considered as having any special significance’. The GWP for a time horizon of 100 years was later adopted as a metric to implement the multi-gas approach embedded in the United Nations Framework Convention on Climate Change (UNFCCC) and made operational in the 1997 Kyoto Protocol. The choice of time horizon has a strong effect on the GWP values — and thus also on the calculated contributions of CO2 equivalent emissions by component, sector or nation. There is no scientific argument for selecting 100 years compared with other choices (Fuglestvedt et al., 2003; Shine, 2009). The choice of time horizon is a value judgement because it depends on the relative weight assigned to effects at different times.”
Howarth and others argued that it was necessary for the Climate Act to use 20-year global warming potential (GWP) values because methane is estimated to be 28 to 36 greater than carbon dioxide for a 100-year time horizon but 84-87 GWP over a 20-year period. Because of these high potentials they assumed that meant that the effect of methane on expected warming would be significant.
I have noted that this irrational obsession with methane that is incorporated in the Climate Act is inappropriate. The fundamental flaw with the basis for vilifying methane is that it is based on selective choice of the science and ignores inconvenient aspects of radiation physics which indicate that the laboratory measurements of global warming potential do not translate to the atmosphere where it counts.
LNG Export Terminal Pause
I originally was going to include this link in my fortnightly “Articles of Note” post but decided to elevate it into a focused post because of a reference to Howarth. Roger Pielke, Jr did an interesting piece on the Biden Administration decision to halt the permitting of the continued expansion of U.S. liquified natural gas (LNG) export capacity. He describes the activist rationale for the LNG export expansion halt “included in a letter to President Biden from a group of activists, including the University of Pennsylvania’s Michael Mann and Stanford’s Mark Jacobson”:
Taken together, if all U.S. projects in the permitting pipeline are approved, they could lead to 3.9 billion tons of greenhouse gas emissions annually, which is larger than the entire annual emissions of the European Union. A forthcoming study by Cornell University climate scientist Robert Howarth shows that, even in the best-case scenarios, LNG is at least 24 percent worse for the climate than coal. Increasing LNG exports will mean increased extraction of fossil fuels and climate pollution and directs us away from a renewable energy future.
[1] Reference: Myhre, G., D. Shindell, F.-M. Bréon, W. Collins, J. Fuglestvedt, J. Huang, D. Koch, J.-F. Lamarque, D. Lee, B. Mendoza, T. Nakajima, A. Robock, G. Stephens, T. Takemura and H. Zhang, 2013: Anthropogenic and Natural Radiative Forcing. In: Climate Change 2013: The Physical Science Basis. Contribution of Working Group I to the Fifth Assessment Report of the Intergovernmental Panel on Climate Change [Stocker, T.F., D. Qin, G.-K. Plattner, M. Tignor, S.K. Allen, J. Boschung, A. Nauels, Y. Xia, V. Bex and P.M. Midgley (eds.)]. Cambridge University Press, Cambridge, United Kingdom and New York, NY, USA.
Pielke, Jr. writes that this policy decision raises three concerns.
“The Biden Administration made a decision before producing the evidence on which such a decision is supposed to be based.
The Biden Administration decision ignores the “geopolitical and security implications of the decision”.
Finally, there appears to be no consideration of the economic impacts of the decision.
I recommend reading the article in its entirety.
The reason I turned this into a focused post is because Pielke, Jr. included a previously unknown to me reference regarding Howarth. His quote from the activist letter mentions a forthcoming study by Howarth which Pielke, Jr. described as follows:
The study referenced above suggesting that LNG is worse than coal in terms of greenhouse gas emissions is by Robert Howarth of Cornell University, and is both contrary to a broad scientific consensus on this issue and a lone outlier.
Of particular interest is the footnote associated with the “lone outlier” label. Pielke, Jt. states:
The story behind the new Howarth study is for another day. I’ll just note here that in 2012 Howarth told a reporter that he was performing anti-fracking research for hire — The reporter explained: “In an interview, Howarth told me his goal was to make the anti-fracking movement mainstream and fashionable. He said he met with the Ithaca-based [Park] foundation two years ago, agreeing to produce a study challenging the conventional wisdom that shale gas is comparatively clean…Howarth hired an aggressive PR firm, the Hastings Group, to promote his politicized viewpoint.”
This is smoking gun evidence that New York’s unique characterization of methane and Climate Act policy requirements is based on the politicized and financially advantageous work of a for hire scientist.
Discussion
On January 23, 2024, the New York State Department of Environmental Conservation (DEC) and the New York Energy Research & Development Authority (NYSERDA) hosted the first webinar of this year’s New York Cap-and-Invest (NYCI) Program stakeholder engagement process. One of the points made in the first webinar was that under Governor Hochul’s direction, New York’s cap & invest program will incorporate these guiding principles:
Affordability. Craft a program to deliver money back to New Yorkers to ensure energy affordability
Climate Leadership: Catalyze other states to join New York, and allows linkage to other jurisdictions
Creating Jobs and Preserving Competitiveness: Protect existing jobs and support new and existing industries in New York
Investing in Disadvantaged Communities: Ensure 35%+ of investments benefit Disadvantaged Communities
Funding a Sustainable Future: Support ambitious clean energy investment
There are ramifications of the reliance on Howarth’s work for the first two principles: affordability and climate leadership links to other jurisdictions.
Last spring I described a Climate Act Revisions Kerfuffle when the Hochul Administration floated the suggestion to revise the emissions accounting methodology to use the Global Warming Potential over 100 years instead of 20 years because of a concern with cost. Climate Action Council co-chairs Doreen Harris and Basil Seggos argued that:
“First and foremost, the governor is trying to maintain New York’s leadership on climate. It’s a core principle that she brought into office and we have been carrying that out for several years,” said Seggos.
But Gov. Hochul instructed both the DEC and NYSERDA to look at the affordability of Cap & Invest.
“We began running the numbers on that, based on some of the metrics being used by Washington state and some of our own, and revealed some…potentially extraordinary costs affiliated with the program,” Seggos explained. “So that’s really what this is. It isn’t a focus necessarily on methane itself, or any particular pollutant. It is how do we implement the CLCPA in a way that doesn’t put extraordinary costs on the pockets of New Yorkers.”
The climate activist organizations went ballistic and the Administration bowed to the pressue. Activists claimed:
“When Governor Hochul tried to sneak in a fossil-fueled methane accounting method that would gut New York State’s Climate Act during the final push of budget negotiations, New York’s climate and environmental justice movement responded swiftly and powerfully. NY Renews is proud to stand with a movement that stopped—for now—changes to New York’s progressive 20-year methane accounting method as written in law.”
When considering emission sources only within New York State and using a GWP100, CO2 is a much greater component of total emissions (Figure 3). The main difference is the CLCPA’s focus on shorter-lived methane and HFCs, which appear much larger using the 20-year GWP, although the actual mass of these emissions has not changed. The other key difference between the accounting frameworks is out-of-state emissions. Over time, New York State has imported more natural gas and has exported more waste. Methane is a major source of emissions for both the natural gas system and waste management.
In 2021 total GHG emissions were 367.87 million metric tonnes of CO2 equivalent using the Climate format (GWP-20) and to the best of my review of the data (it does not appear to match Figure 3) the GWP-100 total is 214.4 million metric tonnes of CO2 equivalent. If the allowance costs per ton for NYCI remain the same, then costs to the state will be 72% higher using the Howarth inspired accounting.
The second Hochul principle is “climate leadership” which is described as “catalyze other states to join New York and allow linkage to other jurisdictions”. I think it is a heavy lift to catalyze other states to join New York if most of the rest of the world is using a different accounting system, particularly when the rationale for that approach does not stand up to scrutiny. I know that it will likely be impossible for New York to link to the California/Quebec and Washington cap-and-invest programs. The different accounting methodology is a high hurdle and when combined with the upstream emissions accounting with the potential for double counting, it just won’t happen.
Conclusion
With all due respect to Dr. Howarth, it is appropriate to consider why a “Professor of Ecology & Environmental Biology” is qualified to be an expert on methane emissions. Combined with the revelation that he set out to “make the anti-fracking movement mainstream and fashionable” in conjunction with the Park Foundation, the motives for his methane obsession suggest his analyses are biased to get a particular answer. The State of New York has failed to rein him in so reconciling the inconsistencies with his pseudo-science and Hochul’s principles is a problem of their own making. It matters to all New Yorkers because it will increase costs directly and indirectly because links to other jurisdictions could make the allowance market stronger and cheaper.
On January 26, 2024 the New York State Department of Environmental Conservation (DEC) and the New York Energy Research & Development Authority (NYSERDA) hosted the third webinar (slides and recording) of this year’s New York Cap-and-Invest (NYCI) Program stakeholder engagement process. I described the first webinar “The Role of Cap and Invest” in an earlier post. This post presents my initial impressions of the third webinar of the series, “Preliminary Scenario Analyses”, with particular emphasis on the projected costs.
I have followed the Climate Leadership & Community Protection Act (Climate Act) since it was first proposed, submitted comments on the Climate Act implementation plan, and have written over 380 articles about New York’s net-zero transition. The opinions expressed in this post do not reflect the position of any of my previous employers or any other organization I have been associated with, these comments are mine alone.
Overview
The Climate Act established a New York “Net Zero” target (85% reduction in GHG emissions and 15% offset of emissions) by 2050. It includes an interim 2030 reduction target of a 40% reduction by 2030 and a requirement that all electricity generated be “zero-emissions” by 2040. The Climate Action Council (CAC) is responsible for preparing the Scoping Plan that outlines how to “achieve the State’s bold clean energy and climate agenda.” In brief, that plan is to electrify everything possible using zero-emissions electricity. The Integration Analysis prepared by the New York State Energy Research and Development Authority (NYSERDA) and its consultants quantifies the impact of the electrification strategies. That material was used to develop the Draft Scoping Plan outline of strategies. After a year-long review, the Scoping Plan was finalized at the end of 2022. In 2023 the Scoping Plan recommendations were supposed to be implemented through regulation, PSC orders, and legislation. Not surprisingly, the aspirational schedule of the Climate Act has proven to be more difficult to implement than planned. Many aspects of the transition are falling behind, and the magnitude of the necessary costs is coming into focus. When political fantasies meet reality, reality always wins.
Cap-and-Invest
The Climate Action Council’s Scoping Plan recommended a market-based economywide cap-and-invest program. The program works by setting an annual cap on the amount of greenhouse gas pollution that is permitted to be emitted in New York: “The declining cap ensures annual emissions are reduced, setting the state on a trajectory to meet our greenhouse gas emission reduction requirements of 40% by 2030, and at least 85% from 1990 levels by 2050, as mandated by the Climate Leadership & Community Protection Act (Climate Act).” In addition to the declining cap, it is supposed to limit potential costs to New Yorkers, invest proceeds in programs that drive emission reductions in an equitable manner, and maintain the competitiveness of New York businesses and industries. The stakeholder engagement process will refine the proposal over the next several months, DEC will and NYSERDA will propose regulations by summer, and the final rules are supposed to be in place by the end of the year.
The reality is different particularly because the proposal changes components that have worked in other jurisdictions and environmental activists want to remove certain components that have made similar programs work in the past. The proposed regulations keep many of the necessary features but still make changes that threaten viability. Further background information is available at my carbon pricing initiative page.
Preliminary Scenario Analysis Webinar
The slides and recording for the webinar are available. Note that in the following text there are links to sections of the webinar recording corresponding to specific topics.
The entire webinar was scripted. Each presenter read their remarks and it even appeared that the responses to questions were vetted. Vlad Gutman-Britten (NYSERDA) read the script that gave an overview of the webinar outline. The goal of this webinar was to describe the preliminary scenario analysis that projects how the NYCI allowance market will operate, present expected costs to households, and describe potential benefits of associated emission reductions. I focus on the costs to households in this post.
NYCI Modeling
The preliminary scenarios analysis relies on econometric models. The presentation was pretty vague on exactly which models were used and who did the work. It appears that it relies heavily on the analyses done for the Scoping Plan. If that is true then note that there was no suggestion that those analyses had been updated since they were done in 2022.
To give context for the cost results I briefly describe the modeling. The analyses must project allowance supply and demand. Gutman-Britten described the following slide that gives an overview of the analysis approach.
Allowance supply is based on the statewide greenhouse gas emissions cap:
The cap was defined by interpolating between 2025 starting point emissions (described subsequently) and the 2030 emissions limit, and then interpolating between 2030 and 2050 limits. The modeling employs non-linear interpolation, with gradual reductions at first followed by acceleration to the target year. The cap is economywide covering all sectors. The State would retire allowances for all non-obligated emissions.
In general, the allowance budget represents the allowable number of tons for each year of the emissions cap. However, the NYCI proposal treats different sectors of the economy differently to address distinctions between the sectors. To appease particular political constituencies, specific exemptions to all or part of sector allowance requirements have been incorporated into the proposed plan.
The modeling analysis balances the cap with expected emissions to estimate allowance demand for each sector. All the obligated entities will be required to “surrender emissions allowances following a three-year compliance period, the first one being 2025-2027.” For each ton emitted they must submit one allowance. The modeling estimates the expected emissions based on “technology pathways”. I think this technological jargon hides the fact that feasibility is not incorporated into these modeling results.
The final aspect of this modeling is financial sector participation: “The model assumes that “the financial sector participates in the market freely by arbitraging on changes in the price of allowances.” This is an aspect of the modeling where I think theory is not fully aligned with what actually happens in a market-based pollution control program.
The point I wanted to make in this summary of the modeling is that all these projections are subject to enormous uncertainty. There are many aspects of each energy sector transition that are subject to interpretation and the biases of the modelers. As a result, it is easy to get results that coincide with the pre-determined outcomes consistent with the political narrative.
At this time, the modeling analyses for the auction project that 2030 total revenue is “estimated to be between $6 and $12 billion per year ($4-8 billion available for investments).” Sparse details for this calculation were provided and I was not able to reproduce those numbers.
Household Costs
The projected costs from the modeling analysis are included for three scenarios described by Gutman-Britten in the following slide. The analysis modeled three different price ceiling trajectories. The price ceiling value represents the allowance price that triggers a safety valve that would make additional allowances available “for buyers until demand is fully met limited to actual emissions.” The scenarios “follow similar paths but have different price levels for each one.” No explanation was provided justifying the initial price ceiling for each scenario or the timing of the jump step in allowance prices in 2027.
I have always maintained that the primary concern of the general public is Climate Act costs. This presentation does not provide comprehensive cost estimates. In the following table I list the ceiling prices by year for the different scenarios and the corresponding gasoline cost adder as an example of potential costs. According to the US Energy Information Administration, 17.86 lbs of CO2 are emitted per gallon of finished motor gasoline which means that 112 gallons burned equals one ton.
At first glance the 2025 gasoline price adder is not that large. However, the market price for allowances has always been noticeably higher at the start of all allowance trading programs. The uncertainty of a new program lead to higher prices that typically fall back as the program matures. I think the actual price adder at the start of the program will be higher. The other notable feature is the step change increase in 2027. The values listed in 2027 are comparable to the California/Quebec and Washington program allowance prices so I think those prices are more reasonable for eventual New York prices. I suspect there is a connection between the proposed low ceiling prices through 2026 and the 2026 gubernatorial election year that explains the timing of the step change in 2027.
Last year legislation mandated that funds be allocated to the Consumer Climate Action Account (CCAA) as part of the overarching investment framework established for NYCI. As noted in the following slide and explained by Guttman-Britten the first 37% of revenue generated by NYCI auctions is “set aside for the affordability accounts, the Consumer Climate Action Account, the industrial small business climate action account and administrative expenses.” The Consumer Climate Action Account itself is supposed to get 30% of the revenues. Recall that 2030 total revenue is “estimated to be between $6 and $12 billion per year” so the Consumer Climate Action Account should get between $3.3 and $1.5 billion in 2030.
In the summary of the modeling overview Gutman-Britten read the script claiming that NYCI has the ability to effectively manage total costs:
Initial analysis shows that millions of households would break even after NYCI, especially lower income and low energy use households.
Although some households, especially high fossil fuel users, are likely to have residual costs after benefits, total cost impacts may be managed for a very large percentage of households.
In addition to driving emission reductions, NYCI investments are an essential affordability strategy. The program’s support for EV, heat pump, transit, and other related incentives and programs reduces cost exposure for households across New York, with a growing share receiving more benefits than costs.
The analysis relies on the 30% of revenues allocated to the CCAA to offset much of the cost. Insufficient detail was provided in the webinar to evaluate those claims and if the past is any guide there will never be sufficient documentation to verify them. In my opinion this modeling was designed to get specific answers consistent with the Hochul Administration narrative.
Household Impacts
James Wilcox read the script for the Household Impacts discussion. His presentation emphasized the point that these estimates were illustrative examples and not a formal proposal. The following slide is an overview and makes the point that these results are “focused on the impact of NYCI on affordability for low and middle- income households”. Those households are defined as follows:
Low income is identified as all income bands entirely below 60% of state median annual household income, i.e., below $35,000 for the purpose of this analysis.
Middle income is identified as the income band that contains the median annual household income in NYS, i.e., $50-75,000 for the purpose of this analysis.
The illustrative benefit design flow chart from the key assumptions slide deserves more discussion especially because if you are like me these numbers have no context. I found an overview of New York household income at Statistical Atlas that included two graphs. I combined data from the income percentiles and webinar income distribution graphs in the following table. The webinar assumes that there will be no benefit for households in the top 20% which according to the table corresponds to an income exceeding $126,900. There are six million households under that threshold which means that 1.5 million households in the top 20% of income will get no benefit. Low-income households are those below $35,000 and there are 2.3 million households in that category. There are 2.1 million households above $35,000 but below $75,000. Middle income is identified as the income band that contains the median annual household income in NYS, i.e., $50-75,000 for the purpose of the NYCI analysis. That leaves 1.6 million households with income between $75,000 and $126,900. No information for expected benefits was provided for this last category. Left unsaid was how the CCAA funds are distributed across these categories.
I have not been able to find a reference for the expected CCAA monthly distribution. The household numbers can be used to guess at the distribution. Previously I noted that the CCAA should get between $3.3 and $1.5 billion in 2030. According to this table about six million households are eligible for a CCAA distribution so if every eligible household gets the same share, then the monthly distributions will range between $45 and $21 per month.
The script for the household impacts by type, location, and income slide described the monthly program net impacts for the first year of the program. The title “monthly program net impact” says that the values are netted out from something, but it is not clear what. It is likely that these are net relative to the costs less the CCAA benefit. It is also possible that the values are relative to the Reference Case. However, the Reference Case includes the costs of New York City Local Law 97 and the advanced clean car rule among other things. It is not clear how those could be separated out in the analysis. The net impact costs table is excerpted below.
This is a busy slide that describes the monthly net cost impacts. The rows list the regions (NYC, Downstate, and Upstate) including the low- and middle-income household categories. There are four categories of columns. The first column covers households that use gasoline vehicles and heat with fossil fuels. The second column covers households that use gasoline vehicles but use “green” electric heating. One of the unexplained details is whether using electricity for heating was limited to heat pumps or includes resistance heating. The third column is households that do not use gasoline vehicles but use fossil heating. Another detail is whether hybrid vehicles that are not zero-emissions vehicles are considered green. The fourth column is for the small number of households that do not use gasoline vehicles or fossil heat. Within each of those four columns the results for the three allowance scenarios are shown.
The script explanation for the first column stated that:
Depending on the household income level and the part of the state, the cost may range. From as little as $12 a year to up to $180 with net impacts lower under Upstate scenarios B and C.
Infuriatingly, the script description describes annual benefits, but the graph lists monthly values. For example, the Scenario A monthly net cost impact ranges from $1 per month ($12 a year) for Downstate, Low Income to $15 per month ($180 per month) for Upstate, Middle Income. Inconsistent nomenclature makes it difficult to figure out exactly what is proposed.
The script narrative is that as people transition away from fossil fuels people will be financially better off. In the rightmost column for both green alternatives the Scenario A monthly benefits range from $11 to $28 per month or $132 to $336 per year. Presumably this represents an incentive to convert but it is left unsaid whether converting to an EV and a heat pump will cost less than this program benefit.
The script for this concludes that “It’s essential to remember that NYCI investments will be designed to move state households from the right column to the left column.” This appears to be a mis-statement because the left column is all fossil and the right column is all “zero-emissions” so the goal should be opposite direction. The narrative also argues that revenues raised will provide support for households to electrify their homes and cars and the CCAA rebates will be an additional incentive.
Wilcox provides a couple of more slides that break out the household impacts. The following is the second slide that describes the Upstate “middle-income household journey” to decarbonized nirvana as envisioned by this modeling. For a household with two internal combustion vehicles and a home that is not weatherized and uses gas heating the slide describes two decarbonization scenarios: moderate and increased decarbonization. The graphs list the NYCI program impact per month (Real $ 2022) for the net program impact faced by household; increases cost due to NYCI; the surplus benefit; decreased cost for efficient appliances, weatherization, switching one of two cars to an electric vehicle and switching to a heat pump; and program impact covered by differentiated distribution.
I cannot say that I can fully explain these household impacts values. The script states:
This household sees an initial net cost. The consumer climate action account offsets approximately two thirds of the total NYCI impact.
The increase in NYCI price is $78 which I assume is the total NYCI impact. The sum of the net program impact faced by household ($15) and program impact covered by differentiated distribution ($28) is $43 and that is about two thirds of the total NYCI impact. But the graph states that the net program impact is $15. I cannot figure out what the program impact covered by differentiated distribution represents. Recall that if every eligible household gets the same share the monthly distributions will range between $45 and $21 per month in 2030 but the 2025 estimated revenues were not provided.
The graphic and the script describe the household journey:
However, under a moderate decarbonization journey where this household installs efficient appliances, weatherizes their home, and switches one of the 2 cars to an EV.
They nearly break even. Facing a small net cost of $2 after receiving an illustrative consumer climate action account benefit.
The graphic claims that efficient appliances save $7 a month, weatherizing the home saves $10, and switching one of the 2 cars to an EV saves $36 for a total of $53 in savings per month. In 2030 the sum of the net program impact faced by household ($2) and program impact covered by differentiated distribution ($66) is $68. In this instance the differentiated distribution is described as the “illustrative consumer climate action account benefit” but that estimate is at odds with my calculated CCAA benefits of around $45 per month. This is another inconsistency that I cannot explain.
The script goes on to say:
Again, in addition to NYCI offering direct support for energy affordability, program revenue can be used to reduce the cost to households of investments like residential heat pumps and EVs.
This is an addition, and this applies to both slides to support from federal programs to the Inflation Reduction Act.
While others will see some costs that the consumer climate action count helps to manage. However, taking even moderate steps to decarbonize by 2030 leads to surplus benefits in nearly every region and income level analyzed, while taking increased measures leads to significant surplus benefits across all regions and income levels analyzed.
I have not been able to reproduce these claims. Note that the claim that there are “surplus benefits in nearly every region and income level analyzed” ignores the fact that the 1.6 million households with incomes lower than the no-benefit threshold and above the middle-income $75K threshold are not addressed in their presentation of results.
Wilcox summarized the cost impact results in the following slide. The script says that this “illustrative distribution of the Consumer Climate Action Account shows that millions of households break even due to NYCI, especially low-income households and those that rely on clean energy like EVs, transit, and heat pumps.” These are average values. The distribution of impacts that would describe costs for those households that do not have the option for EVs, transit, and heat pumps is not available. The summary claims that the “Consumer Climate Action Account has the potential to manage impacts for a very large percentage of households in New York” but does not quantify that percentage. The modeling analysis notes that the building and transportation sector modeling was custom built. Optimistic implementation assumptions can easily be used to torture the data into the result desired. Without complete documentation I do not think that the results are credible, so I am reserving judgement on these claims.
Discussion
I have always maintained that the primary concern of the general public is Climate Act costs. As far as I can tell the Hochul Administration deliberately hid those costs in the Scoping Plan and that politically motivated approach is apparent in this webinar.
The Energy Policy Institute at the University of Chicago did a poll in early 2023 poll with “the Associated Press–NORC Center for Public Affairs Research” explored Americans’ attitudes on climate change, their views on key climate and energy policies, and how they feel about electric vehicles and the policies to encourage them. The following chart from that report shows that 38% would be willing to pay an additional $1 a month for a fee to combat change and only 21% would be willing to pay $100 a month.
This webinar talked about a single component of the total cost of the net-zero transition. When NYCI starts auctioning allowances the price of energy is guaranteed to go up. The Upstate “middle-income household journey” states that households in that category will pay at least $73 a month before the rebates are applied. The rebates are subject to the whim of Albany politicians, so the rebate amounts are not guaranteed. In addition, the electric bill supply costs are not included in these modeled costs. I recently discussed the Central Hudson revisions to its double-digit gas and electric delivery rate increases. The public outcry has been intense and the costs described here are in addition to the rate case costs. There is insufficient documentation available to determine exactly what costs were included in the heat pump and electric vehicle examples given.
The Energy Policy Institute poll described above found that less than a third of respondents were willing to pay even $10 a month. The willingness to pay at other levels in the poll shows that less than a third are willing to pay as little as $10 a month for a carbon fee. Little wonder that the true costs are a closely guarded secret.
The Climate Action Council’s Scoping Plan has been described as a “true masterpiece in how to hide what is important under an avalanche of words designed to make people never want to read it.” Similarly, the modeling analysis portrayal in this webinar uses an avalanche of technical jargon and impressive sounding phrases to suggest credibility and discourage questions. In reality, all the modeling relies on guessing how society will react to incentives and regulations using parameters that can lead to wildly different results depending upon the biases of the model developer. John von Neumann allegedly summed up the problem with parameters stating that “With four parameters I can fit an elephant, and with five I can make him wiggle his trunk”[1]. In other words, he could develop a mathematical model that described an elephant simply by fudging the parameters. In this instance the model parameters produce the politically correct result that people will, for example, switch to electric vehicles in response to the incentives but don’t account for the many people who have weighed the pros and cons of an electric vehicle and decided never.
Conclusion
“A goal without a plan is just a wish.”, Antoine de St. Exupery. The Scoping Plan should properly be called the Scoping Goals because there is no plan. There has been no accountability for proving that the control strategies proposed are feasible on the schedule mandated by the Climate Act and that the costs of all the components of the energy system that must be changed to achieve the net-zero transition will maintain current standards of affordability. It is just wishing.