

On December 30,2021 the New York State Department of Environmental Conservation (DEC) released “New York’s first-ever, statewide greenhouse gas emissions report compliant with state’s climate law”. This is an overview post of this greenhouse gas (GHG) inventory and the games played using that inventory to “prove” that there are societal benefits for the emission reduction programs needed to meet the Climate Leadership and Community Protection Act (Climate Act) targets.
I have summarized issues with the Climate Act and written extensively on implementation of it because I believe the solutions proposed will adversely affect reliability and affordability, will have worse impacts on the environment than the purported effects of climate change, and cannot measurably affect global warming when implemented. The opinions expressed in this post do not reflect the position of any of my previous employers or any other company I have been associated with, these comments are mine alone.
Background
According to the 12/30/2021 press release:
New York State Department of Environmental Conservation (DEC) Commissioner and Climate Action Council Co-Chair Basil Seggos today announced the release of the State’s first-ever statewide greenhouse gas emissions report compliant with the Climate Leadership and Community Protection Act (CLCPA). The report describes statewide greenhouse gas (GHG) emissions for 1990 through 2019, and will be produced annually as required by New York’s nation-leading climate law. The release of the report is a milestone in the State’s efforts to meet the requirements of the CLCPA.
“The release of the first CLCPA-compliant, statewide report on greenhouse gas emissions advances New York’s efforts to implement our nation-leading Climate Law by providing a snapshot of greenhouse gas emissions, which will help ensure we achieve our aggressive target of net-zero emissions by 2050,” said Commissioner Seggos. “This annual report shows that while New York State has reduced emissions from several sectors over the last three decades, emissions from some sectors, including transportation, have increased, revealing that enormous challenges remain in our ongoing work to meet our emission-reduction targets. The report is a critical resource as we continue to act on climate and advance a just transition to clean energy that creates good jobs and supports a green economy for the future.”
Inventory Games
One way to help “prove” that the Climate Act implementation programs are cost-effective is to increase the inventory as much as possible. This inventory does two things that maximize emissions: it includes upstream emissions and it changes the global warming potential time period. Obviously if upstream emissions are included then the total increases but at the same time it makes the inventory incompatible with everybody else’s inventory. Global warming potential (GWP) weighs the radiative forcing of a gas against that of carbon dioxide over a specified time frame so that it is possible to compare the effects of different gases. Almost all jurisdictions use a 100-year GWP time horizon but the Climate Act mandates the use of the 20-year GWP.
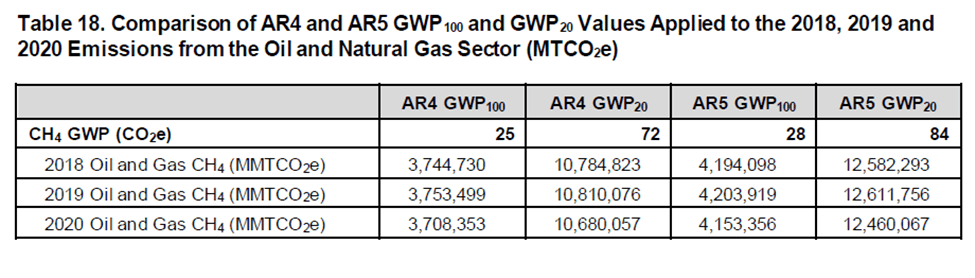
The DEC inventory report does not break out the effects of these metrics on emissions so that the New York inventory can be compared to the inventories developed by other jurisdictions. However, some insight is provided in the recently released New York State Oil and Gas Methane Emissions Inventory: 2018-2020 Update that includes a couple of tables describing emissions that are a component of the DEC inventory. One update in this report is a revision to use more recent Intergovernmental Panel on Climate Change emission factors from report AR5 rather than AR4. Table 18 in the report compares AR4 and AR5 GWP100 and GWP20 values. Using the GWP20 instead of GWP100 increases the emissions by a factor of 3.36.
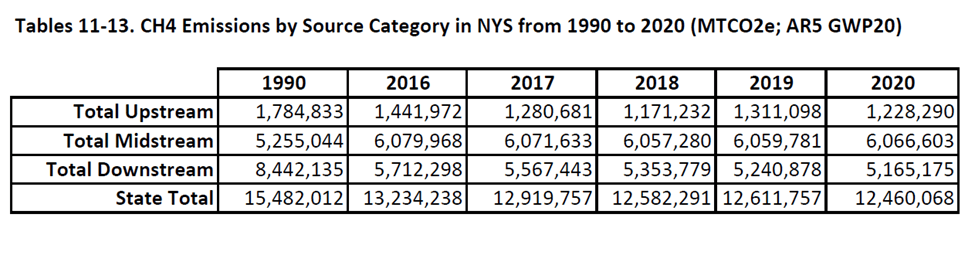
Tables 11 through 13 in the methane inventory update list emissions by source category from 1990 to 2020. I summed the emissions to get totals for representative years for upstream, midstream and downstream emissions. Someday I will delve into those categories in detail but for now note that upstream emissions are roughly 10% of the total emissions for methane.
Implications
According to the DEC GHG report: “Total statewide gross emissions in 2019 were 6% below 1990 and 17% below 2005 levels, when assessed using CLCPA accounting”. Figure ES.1 in the DEC GHG inventory shows the annual statewide emissions from 1990 to 2019. It is disappointing DEC did not provide the actual numbers used to generate this graphic. The only numbers provided are the 1990 baseline value of 402.54, the maximum in 2005 of 458.55 and the 2019 value of 379.43. All these values are in million metric tons of carbon dioxide equivalent in terms of GWP20. The only reference to values comparable to other inventories states “As a point of comparison, when applying the conventional, or UNFCCC, format for governmental accounting, emissions declined 21% percent from 1990 to 2019, or from a net emission rate of 210.43mmt to 165.46 mmt CO2e GWP100”.
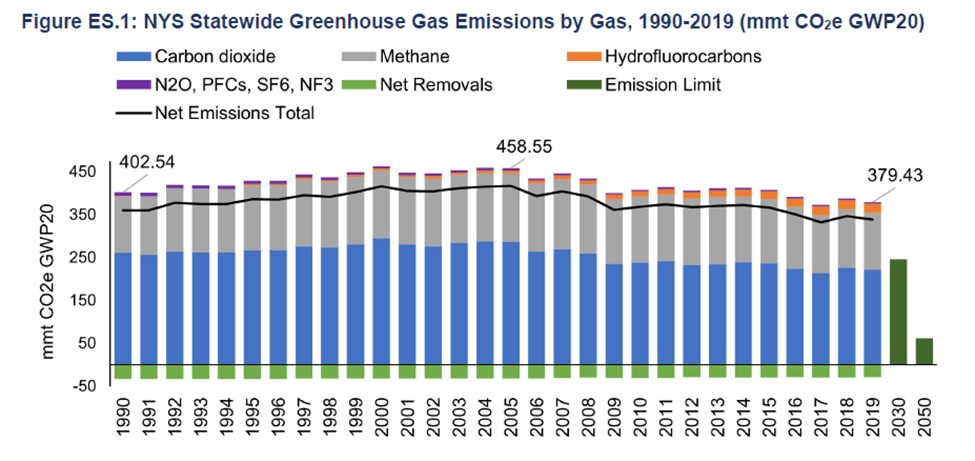
In order to claim that the Climate Act emission reductions provide societal benefits the Social Cost of Carbon (SCC) or Value of Carbon is used. The metric is a measure of the avoided costs from global warming impacts out to 2300 caused by reducing a ton of today’s emissions. In a recent post I discussed New York’s use of this parameter for claiming benefits. I believe that the societal benefit for NY reductions should use one and only one of the three values in Figure ES.1. Using the maximum rather than the baseline makes sense if you want to get credit for New York’s biggest impacts and using the most recent value could be argued as appropriate because it represents the actual value of the Climate Act itself.
The following table lists the societal benefits for the three different discount rates listed in New York’s Value of Carbon guidance. The state recommends using the 2% discount rate which gives societal benefits ranging between $46.7 billion and $56.4 billion using the 2021 values depending on which emission value used. However, consider that most other jurisdictions, including the Federal government are using conventional, or UNFCCC, format for governmental accounting and the 3% discount rate. That drops the social benefits to $8.6 to $10.9 billion but still includes some additional upstream emissions.
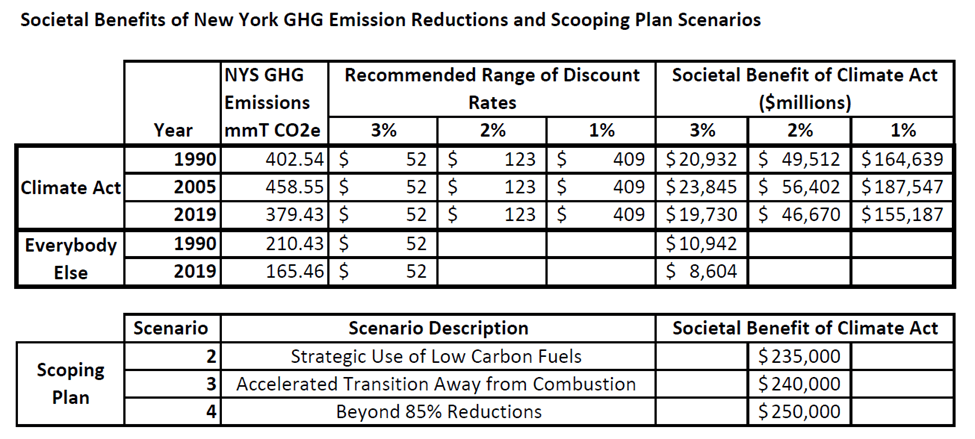
Incredibly, it gets worse because all the tricks they used to manipulate the emissions and social cost of carbon values as much as possible were still not enough to make the benefits higher than the Integration Analysis costs for three mitigation scenarios. In a recent post I explained that State guidance explicitly says that “the value of carbon is applied to each year, based on the reduction from the no action case”. The Draft Scoping Plan contains three mitigation scenarios and claims avoided GHG benefits ranging from $235 billion to $250 billion. However, the guidance methodology used is simply not correct because it applies the social cost benefit multiple times for each ton reduced. I checked my understanding of the use of lifetime savings with social cost of carbon expert Dr. Richard Tol who confirmed that “The SCC should not be compared to life-time savings or life-time costs (unless the project life is one year)”.
Conclusion
There are a couple of obvious implications with the GHG emissions report data. In 2030 New York State GHG emissions have to meet the Part 496 limit of 60% of the 1990 baseline. Using the Figure ES.1 emissions of 402.54 that translates to a limit of 241.52 mmt CO2e GWP20. That means that GHG emissions have to be reduced 36% in 11 years. Emission reductions from the peak year in 2005 have come down 17% in 15 years. I don’t think it is very likely that the State will be able to double the reduction rate to meet the 2030 target.
I hope readers understand the point that the State has contrived higher estimates for societal greenhouse gas emission benefits so much that their valuation is around five times higher than other jurisdictions using conventional methodology. I also showed that this manipulation was not sufficient to “prove” that societal benefits were greater than the costs for the Scoping Plan mitigation scenarios so they relied on state guidance that mistakenly over counts the benefits. That gamesmanship results in New York societal benefits more than 20 times higher than benefits using everybody else’s methodology. In June 2021 I explained that I had submitted comments on this topic to DEC and NYSERDA. They eventually responded: “We ultimately decided to stay with the recommendation of applying the Value of Carbon as described in the guidance as that is consistent with how it is applied in benefit-cost analyses at the state and federal level.” They did not say I was wrong they said they wanted to be consistent. I believe that was because they knew they needed larger societal benefits to claim this was cost-effective.
