

On April 4 I published an article about the Hochul Administration’s proposal to make some changes to the greenhouse gas emissions accounting approach in the Climate Leadership & Community Protection Act (Climate Act). After a “firestorm of opposition from environmentalists” the proposal to use a different global warming potential value was removed from budget negotiations but the topic will still be addressed later this year. This post provides information on this Climate Act component to try to clear up some misconceptions that I noticed in the recent dustup and to explain what the two methodologies mean to required emission reductions.
I have been following the Climate Act since it was first proposed. I submitted comments on the Climate Act implementation plan and written over 300 articles about New York’s net-zero transition because I believe the ambitions for a zero-emissions economy embodied in the Climate Act outstrip available renewable technology such that the net-zero transition will do more harm than good. The opinions expressed in this post do not reflect the position of any of my previous employers or any other company I have been associated with, these comments are mine alone.
Climate Act Background
The Climate Act established a New York “Net Zero” target (85% reduction and 15% offset of emissions) by 2050 and an interim 2030 target of a 40% reduction by 2030. The Climate Action Council is responsible for preparing the Scoping Plan that outlines how to “achieve the State’s bold clean energy and climate agenda.” In brief, that plan is to electrify everything possible and power the electric gride with zero-emissions generating resources by 2040. The Integration Analysis prepared by the New York State Energy Research and Development Authority (NYSERDA) and its consultants quantifies the impact of the electrification strategies. That material was used to write a Draft Scoping Plan. After a year-long review the Scoping Plan recommendations were finalized at the end of 2022. In 2023 the Scoping Plan recommendations are supposed to be implemented through regulation and legislation.
Global Warming Potential
The recent controversy involved changes to the Greenhouse Gas (GHG) emissions accounting approach used by the Climate Act to account for methane or natural gas emissions. The Environmental Protection Agency (EPA) explains that the Global Warming Potential (GWP) was “developed to allow comparisons of the global warming impacts of different gases”. EPA explains that GHGs affect the rate at which energy from the surface escapes to space. The explanation notes:
Different GHGs can have different effects on the Earth’s warming. Two key ways in which these gases differ from each other are their ability to absorb energy (their “radiative efficiency”), and how long they stay in the atmosphere (also known as their “lifetime”).
The EPA explanation goes on to state:
Specifically, it is a measure of how much energy the emissions of 1 ton of a gas will absorb over a given period of time, relative to the emissions of 1 ton of carbon dioxide (CO2). The larger the GWP, the more that a given gas warms the Earth compared to CO2 over that time period. The time period usually used for GWPs is 100 years. GWPs provide a common unit of measure, which allows analysts to add up emissions estimates of different gases (e.g., to compile a national GHG inventory), and allows policymakers to compare emissions reduction opportunities across sectors and gases.
- CO2, by definition, has a GWP of 1 regardless of the time period used, because it is the gas being used as the reference. CO2 remains in the climate system for a very long time: CO2 emissions cause increases in atmospheric concentrations of CO2 that will last thousands of years.
- Methane (CH4) is estimated to have a GWP of 27-30 over 100 years (Learn why EPA’s U.S. Inventory of Greenhouse Gas Emissions and Sinks uses a different value.). CH4 emitted today lasts about a decade on average, which is much less time than CO2. But CH4 also absorbs much more energy than CO2. The net effect of the shorter lifetime and higher energy absorption is reflected in the GWP. The CH4 GWP also accounts for some indirect effects, such as the fact that CH4 is a precursor to ozone, and ozone is itself a GHG.
- Nitrous Oxide (N2O) has a GWP 273 times that of CO2 for a 100-year timescale. N2O emitted today remains in the atmosphere for more than 100 years, on average.
- Chlorofluorocarbons (CFCs), hydrofluorocarbons (HFCs), hydrochlorofluorocarbons (HCFCs), perfluorocarbons (PFCs), and sulfur hexafluoride (SF6) are sometimes called high-GWP gases because, for a given amount of mass, they trap substantially more heat than CO2. (The GWPs for these gases can be in the thousands or tens of thousands.)
EPA also explains that there are alternatives to using the 100-year GWP:
The United States primarily uses the 100-year GWP as a measure of the relative impact of different GHGs. However, the scientific community has developed a number of other metrics that could be used for comparing one GHG to another. These metrics may differ based on timeframe, the climate endpoint measured, or the method of calculation.
For example, the 20-year GWP is sometimes used as an alternative to the 100-year GWP. Just like the 100-year GWP is based on the energy absorbed by a gas over 100 years, the 20-year GWP is based on the energy absorbed over 20 years. This 20-year GWP prioritizes gases with shorter lifetimes, because it does not consider impacts that happen more than 20 years after the emissions occur. Because all GWPs are calculated relative to CO2, GWPs based on a shorter timeframe will be larger for gases with lifetimes shorter than that of CO2, and smaller for gases with lifetimes longer than CO2. For example, for CH4, which has a short lifetime, the 100-year GWP of 27–30 is much less than the 20-year GWP of 81–83.
Climate Act Global Warming Potential
The ideologues who wrote the Climate Act chose to use GWP measured over 20 years rather than 100-years. I believe that this was a deliberate choice to emphasize the “value” of methane and natural gas reductions. At the time the Act was passed this was a unique choice and since then only one jurisdiction (the state of Maryland) has chosen this approach. Everybody else, all the other states, the EPA, and the Intergovernmental Panel on Climate Change, all use GWP measured over 100 years. The proposal to change this accounting was greeted with vociferous opposition from New York’s environmental community because it was perceived as reducing the value of reductions of oil, gas, and bio-fuels.
For example, in what was billed as an “explanation of the painfully nerdy, incredibly important methane math problem that roiled New York’s budget process this week” Lisa Harris writing for “The River – Hudson Valley Newsroom” wrote:
Even if you were paying attention, you might have missed this one: While the bail reform battle was occupying the spotlight, and with the budget fight playing out mostly behind closed doors, Gov. Kathy Hochul tried to push through a major change to the way New York does climate math.
Here’s what we know: Armed with outsized budget-season power, and with the support of the natural gas industry, Hochul threw her weight behind an obscure bill introduced late in the budget session by Senator Kevin Parker and Assemblymember Didi Barrett, who chair the energy committees in their respective houses. The bill, S6030, proposed a couple of sweeping changes to the method New York uses to count its greenhouse gas emissions.
If adopted, S6030 would cast New York’s newly-adopted climate plan into limbo by changing the figures that provide the foundation for its 400-plus pages of policy recommendations. It would also have brought New York’s accounting in line with the way methane is counted by most other states and the federal government — a method climate scientists say is outdated, and that underestimates the outsized impact that natural gas leaks and other major methane sources have on climate change.
If I had the time, I would respond to the entire article because it exemplifies the rationale of the NY environmental community relative to this issue. Unfortunately, there are too many issues on my plate to address all of it. However, the last sentence quoted above must be addressed. As I noted previously both the EPA and the IPCC use GWP-100. It is hypocritical for activists to demand that New York follow the “Science” as espoused by the IPCC except when it is inconvenient. The claim that “a method climate scientists say is outdated” cherry picks a limited number of scientists. In New York that would be Robert Howarth Ph.D. who has repeatedly claimed that he played a key role in the drafting of the Climate Act.
Dr. Howarth is a biogeochemist and ecosystem scientist who has assumed the mantle of venerated Climate Scientist™. Everything he says is taken as holy writ by New York climate activists. It is not clear to me why the David R. Atkinson Professor of Ecology & Environmental Biology at Cornell University is considered a climate scientist with impeccable qualifications that preclude any criticism of his arguments. I have no doubts of his expertise related to methane chemistry and the comparison to carbon dioxide in the laboratory. However, his understanding and that of the New York climate activist community, on the role of methane on global warming is flawed. I charitably ascribe his incorrect views to his lack of background in atmospheric physics. I have summarized the methane issues ignored by Howarth. It boils down to one issue that even the EPA description overlooks. The GWP values are based on laboratory molecular measurements which are only appropriate in that setting. In the atmosphere where the effect on global warming actually occurs, the relative differences between carbon dioxide and methane due to concentrations, the particular wavelengths affecting the out-going radiation, and the saturation effect all mean that carbon dioxide is much more important than methane. If considered properly the EPA and IPCC approach is appropriate and the use of the 20-year GWP is not justified as mandated in the Climate Act
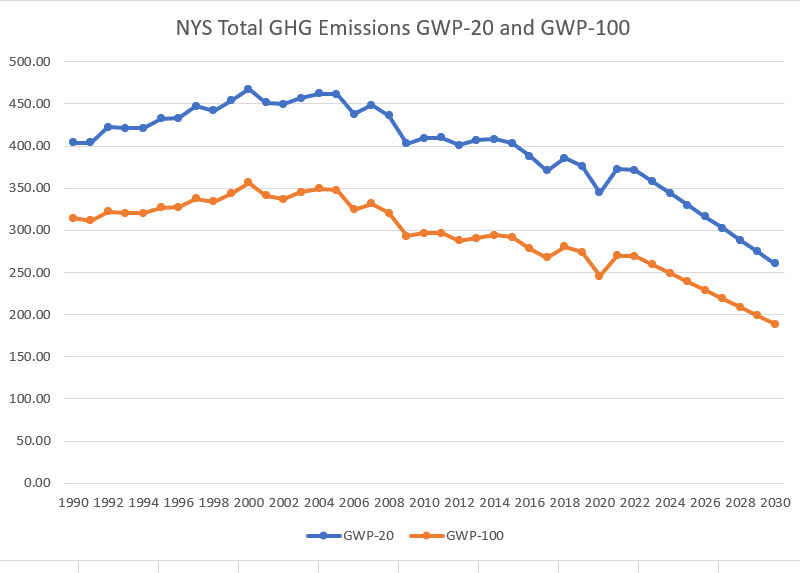
New York State GHG Emissions Inventory GWP-20 and GWP-100
The primary purpose of this post is to document the differences between the emissions associated with the two global warming potential methodologies. The differences are being portrayed as hugely important. Marie French writes:
But the numbers — and previous work by state staff — show that New York would be required to take less aggressive action to slash greenhouse gasses if Gov. Kathy Hochul, despite dropping an immediate push for it Wednesday, ultimately cuts a deal with lawmakers to change the climate law, an effort first reported by POLITICO. “Overall, you’re saying we don’t need to reduce emissions as much,” said Bob Howarth, a Cornell University professor and member of the Climate Action Council that was set up to chart a path to achieving the state’s climate goals. “This is a big retrenchment from the climate goal, particularly on the use of natural gas.”
In order to look at the numbers I developed a spreadsheet that uses the NYS GHG emissions by Global Warming Potential for 20-year and 100-year time frames. The observed data from 1990 to 2020 are from the 2022 Statewide GHG Emissions Report and the associated data on Data NY for Statewide GHG Emissions.
My spreadsheet also makes projections for 2021-2030. I made some educated guesses for the 2021 and 2022 emissions. Electricity sector emissions in 2021 and 2022 are available from EPA. I assumed that the ratio of direct CO2 emissions to all the other GHG emissions in the sector for the last three years would be the same as for 2021 and 2022 to estimate the total electricity sector emissions. The emissions from all the other sectors are the average of the last three years. On the long list of unresolved questions is how the emission reduction target of 2030 will be apportioned amongst the different sectors. A portion of the agricultural and industrial sector emissions are off the table. Does that mean the other sectors have to produce reductions to make up the difference? For this analysis I just assumed that all sectors have to reduce their emissions 40% less than their 1990 baseline emissions. I assumed a linear reduction from 2022 to 2030 to estimate the annual emissions.
The total emissions shown in the following graph shows that GWP-20 values are significantly higher than GWP-100 values. In the baseline year of 1990 the total GWP-20 emissions were 404 million metric tons of carbon dioxide equivalent (MMT CO2e) and the GWP emissions were 314 MMT CO2e or 29% higher. In the last year of observed data, 2020, the GWP-20 emissions were 345 MMT CO2e and the GWP emissions were 245 MMT CO2e or 41% higher. Does that mean that changing to GWP-100 will the State can take less aggressive action to reduce emissions? Between 1990 and 2020 the total GWP-20 emissions dropped 15%. In order to meet the 2030 targets GWP-20 emissions will have to be reduced 29% almost double the reductions observed over 30 years. On the other hand, GWP-100 emissions dropped 23% between 1990 and 2020 and will “only” have to be reduced a further 22% to meet the
mandated reduction of 40% of total GHG emissions by 2030. It does appear that less aggressive action is needed but as shown below I don’t think the 2030 target is achievable for either accounting system.
One other feature of the plots needs to be discussed before we can address the question whether the target is likely for either accounting approach. The last year of observed emissions was 2020 and that value is sharply lower than the general trend because of the pandemic shutdown of society. I chose not to make any sophisticated attempt to adjust emissions for that outlier. However, note that emissions in 2021 are higher than 2019 despite the general downward trend. That is entirely due to the State’s misguided shutdown of Indian Point and the resulting increase in emissions.
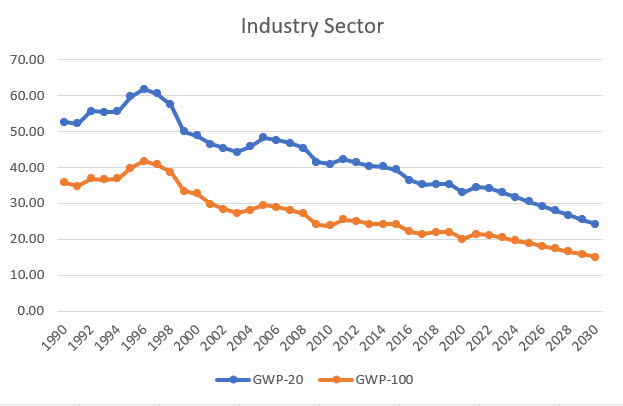
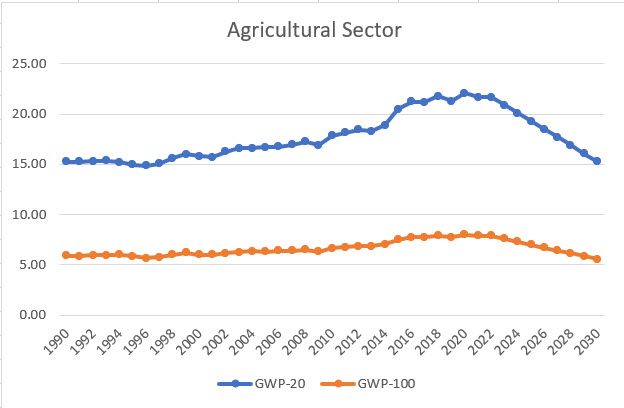
To gain a perspective of the relative importance of sector specific emissions I list the emissions by sector for each GWP accounting methodology below:


One of my biggest concerns with the Scoping Plan is that it did not include a feasibility analysis. This is particularly troublesome with regards to the schedule for the mandated targets. If we consider the following graphs for each sector specifically looking at the rate of reductions required compared to historical emissions it does not appear to me that the targets are achievable.
I am most familiar with the electric sector. The following graph shows the GWP-20 and GWP-100 emissions for just that sector. The increased emissions associated with the shutdown of Indian Point and resulting fossil fuel generation emissions increase to replace that zero-emissions resource is clearly visible. The first reaction looking at the emission trends could be that the slope of both emission trajectories from 2006 to 2018 is roughly consistent with the trend necessary to meet the 2030 target from 2022 to 2300. There is a problem with that perception however. The observed reductions from 2006 to 2018 were primarily due to fuel switching away from coal and residual oil to natural gas. There are no more opportunities for fuel switching emission reductions. In order to reduce electric sector emissions, zero-emissions wind and solar resources must be deployed to displace fossil generation at the same time load is expected to increase due to the electrification of other sectors. I believe that the lack of a feasibility analysis to prove this is possible will prove problematic by 2030.

I am not familiar with the control strategies for other sectors but the same unsettling emission trajectory reduction rates are apparent. The biggest source of emissions using GWP-20 is buildings. Because GWP-20 accentuates the effect of natural gas, there will have to be a real concerted effort to switch existing building sector gas away from natural gas. In my opinion neither emission reduction trajectory rate looks realistic relative to historical emissions but the GWP-20 rate (31% between 2020 and 2030) is more unlikely.

Transportation is the next highest emitting sector for GWP-20 accounting and is greater than buildings for GWP-100. From 2010 to 2018 both emission trajectories were very similar. Clearly the emission reductions necessary in this decade are considerably faster than anything observed in the past. I am not aware of any indications that the public is ready to embrace electric vehicles at the rate necessary to meet this reduction trajectory.
The industrial sector emissions reductions have been steadily decreasing since the mid 1990’s. Unfortunately, that is more a reflection of the business climate of New York rather than any clean energy strategy. The Climate Act includes provisions that are supposed to prevent further reductions in this sector to save jobs but no details have been provided. This is another instance where it may be decided that other sectors must provide reductions so that the state GHG emissions meet the 2030 target.
The waste sector emissions trends are interesting. I did not try to figure out what was going on between 2008 and 2009 when there is an obvious step change in GWP-20 emissions from 43 MMT to 38 MMT CO2e. In my experience with emission inventories any change that drastic was caused by some error in my work. More importantly, a 30% emissions reduction (12.6 MMT CO2e) is required from 2020 to 2030 in order to meet the 40% reduction from the 1990 baseline mandate. Note, however that while the GWP-100 required emission reduction is only 4.6 MMT CO2e it still represents a 30% reduction. I am not aware of any control technology that can be expected to provide that kind of reduction.

I include the agricultural sector for completeness but caution that I don’t know how the emissions will be handled. I know that some emissions are exempt but exactly how many I do not know. In any event the effect of the methane bias is obvious. It also is obvious that expecting the agricultural sector to make its share of emission reductions is unlikely.
Discussion
I do not think the proponents of the Climate Act understand how difficult it is to reduce GHG emissions. In the electric sector the only readily available emission reduction approach is to switch to a lower emitting fuel. There are no more opportunities to fuel switch in New York and there is no add-on cost-effective control option available. As a result, the only control option left is to reduce operations. The Scoping Plan presumes that wind and solar will be deployed such that the fossil generators will be displaced as required by the Climate Act schedule. However, the Integration Analysis did not include a feasibility study to prove that would be possible while current reliability standards are maintained.
As difficult as it is for the electric sector to reduce GHG emissions, that is the sector where reductions are most feasible. In general, the problem with all the “clean energy” solutions is that they don’t work all the time and the time when they don’t work is the time, they are needed the most. For example, in the building sector, air source heat pumps are touted as the replacement for fossil-fired furnaces. Despite the claims that they work fine, there is a point when air source heat pumps do not provide sufficient heat in really cold weather. That issue can be addressed by upgrades to the building shell but that in turn requires upgrades to the ventilation system. In order to provide a system as resilient as a fossil-fired furnace the costs of all the additions to the home will be so great that they are not saving enough energy to make the investments cost effective. The Integration Analysis did not include a feasibility study to demonstrate what would be needed to maintain the same level of resiliency for residential home heating or any of the other components of the net zero transition.
Conclusion
According to NY Renews:
When Governor Hochul tried to sneak in a fossil-fueled methane accounting method that would gut New York State’s Climate Act during the final push of budget negotiations, New York’s climate and environmental justice movement responded swiftly and powerfully. NY Renews is proud to stand with a movement that stopped—for now—changes to New York’s progressive 20-year methane accounting method as written in law.
Based on these numbers I don’t disagree that using the 100-year GWP makes the emission reductions less problematic. However, the emission reduction rate trajectories necessary to meet the 2030 40% reduction mandate are so much greater than anything in the past that I do not think the accounting approach is going to matter. As a result, the over-the-top rhetoric about the importance of the 20-year GWP accounting approach is unwarranted.
The Hochul Administration lost control of the Climate Action Council and allowed naïve and uneducated ideologues to control the narrative. The global warming potential issue is one example of a technical consideration that was chosen based on emotion rather than a full understanding of the ramifications. In this instance the one unarguable negative aspect of the 20-year GWP is that it precludes New York from joining any other emissions market program with other jurisdictions. If New York cannot join other jurisdictions, then they will have to develop all the infrastructure for their system on their own.
Inevitably, there will be another flash point issue. The lack of a feasibility analysis to prove that reductions at the rate necessary for any sector to meet the 2030 targets kicked the problem down the road. The insistence that the Climate Action Council could not consider a “plan B” if targets could not be met means there is no contingency plan in place. When the reality that the 2030 40% reduction mandate cannot be met becomes obvious that will incense New York’s climate and environmental justice movement who will undoubtedly demand that the targets must be met. As explained above the ultimate control strategy is to stop burning fossil fuels. Hochul will have to choose between keeping the lights on, gasoline obtainable at the pump, and natural gas available for homes against meeting the arbitrary emissions reduction mandate of the Climate Act.

I also got caught up in the S6030 frenzy, but finally this weekend, I had a chance to read some of Howarth’s papers. Below is a note I sent to some of my colleagues.
CLCPA requires that emission accounting include two categories of emissions that occur outside of the State’s jurisdictional boundaries, emissions which are not typically included in governmental greenhouse gas accounting. These are the emissions associated with imported electricity and with the “extraction and transmission” of imported fossil fuels.
The CLCPA assumptions for methane emissions from fossil fuels are three times the methane estimates by NOAA. CLCPA assumed over 50% of methane emissions are attributable to fossil fuels. NOAA attributes only 15% of methane emissions to fossil fuels. With such a huge difference between CLCPA and NOAA estimates for methane emissions from fossil fuels, it’s unlikely a consensus can be easily reached regulating methane.
Bob Howarth, professor of ecology and environmental biology at Cornell and a member of the state’s Climate Action Council, states in the conclusion of his paper, “Shale gas and global methane,” published August 14, 2019,
“We conclude that increased methane emissions from fossil fuels likely exceed those from biogenic sources over the past decade (since 2007). The increase in emissions from shale gas (perhaps in combination with those from shale oil) makes up more than half of the total increased fossil-fuel emissions. That is, the commercialization of shale gas and oil in the 21st century has dramatically increased global methane emissions.”
NOAA, in an April 5, 2023 press release, “Greenhouse gases continued to increase rapidly in 2022,” states,
“A 2022 study by NOAA and NASA scientists suggests that as much as 85% of the increase from 2006 to 2016 was due to increased microbial emissions generated by livestock, agriculture, human and agricultural waste, wetlands and other aquatic sources. The rest [15%] of the increase was attributed to increased fossil fuel emissions.”
DEC states that the IPCC approach does not include the CLCPA emission categories, and DEC is unaware of similar analyses in any governmental greenhouse gas report. The DEC’s 2022 NYS Greenhouse Gas Emissions Report, Sectoral Report #1, Energy, states:
“The methodology used in this section of the sectoral report is unique because it encompasses a large, complex set of infrastructures that are not located in New York and are not subject to New York State laws or reporting requirements.”
“There is also no comprehensive federal data source that can provide all of the necessary information. The closest source of information are lifecycle models, which attempt to estimate emissions associated with a product across all stages, from the extraction of raw materials through the final end-use of the product.”
Given the lack of agreement and data about methane emissions, it’s possible any regulation of methane could be challenged as arbitrary and capricious.
Kenneth S. Panza, Woodstock, NY
Supervisor’s Liaison, Climate Smart Communities
LikeLike