

The Climate Leadership & Community Protection Act (Climate Act) net-zero transition plan mandates a 40% reduction in Greenhouse Gas (GHG) emissions from a 1990 baseline. It is not clear how that target is supposed to be interpreted and much less clear what resources need to come on-line in order to make those targets. For the electric sector, however, there is a resource that provides a projection of future generating resource deployments. This post looks at that data and whether it can be used to simply estimate the status of wind and solar development relative to Climate Act targets.
I have been following the Climate Act since it was first proposed. I submitted comments on the Climate Act implementation plan and have written over 300 articles about New York’s net-zero transition. The opinions expressed in this post do not reflect the position of any of my previous employers or any other company I have been associated with, these comments are mine alone.
Climate Act Background
The Climate Act established a New York “Net Zero” target (85% reduction and 15% offset of emissions) by 2050 and an interim 2030 target of a 40% reduction by 2030. The Climate Action Council is responsible for preparing the Scoping Plan that outlines how to “achieve the State’s bold clean energy and climate agenda.” In brief, that plan is to electrify everything possible and power the electric gride with zero-emissions generating resources by 2040. The Integration Analysis prepared by the New York State Energy Research and Development Authority (NYSERDA) and its consultants quantifies the impact of the electrification strategies. That material was used to write a Draft Scoping Plan. After a year-long review the Scoping Plan recommendations were finalized at the end of 2022. In 2023 the Scoping Plan recommendations are supposed to be implemented through regulation and legislation.
Interconnection Queue
The electric power grid is the world’s largest machine. New York’s electric system is connected to the Eastern Interconnection which spans the country from Nova Scotia to Louisiana and Key West Florida to Saskatchewan. The complications associated with ever increasing dependence upon intermittent wind and solar is a major reason why I am skeptical about the Climate Act. When any new generating resource wants to connect to the New York transmission system, the New York State Independent System Operator (NYISO) must go through a detailed interconnection process to ensure compatibility between the new resource and the existing system. One product of that process is a list of all proposed projects in the Interconnection Queue available at the interconnection process website. The spreadsheet lists the projects by electrical output, type of resource and fuel used, the location, the licensing and approval status, and the proposed in-service date.
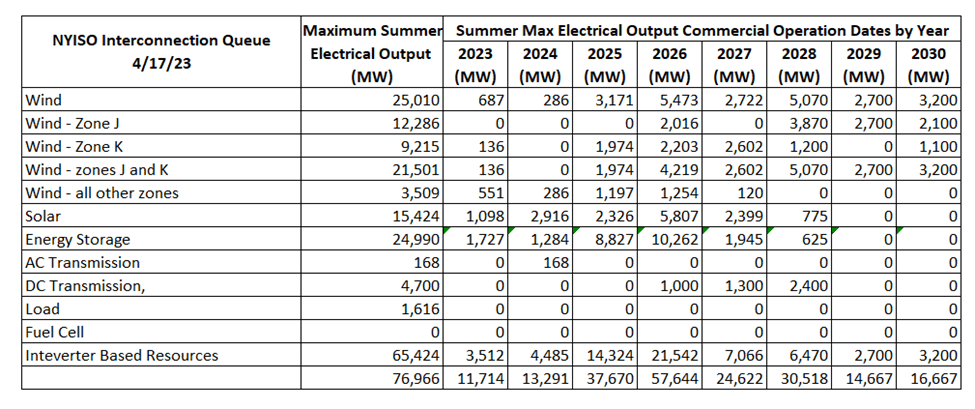
I downloaded the interconnection queue data in mid-April and summarized the current status of expected new resources. I eventually figured out that the queue included all interconnections from proposed generating resources not just one interconnection per development so I could not simply sum up the resource capacity totals. This primarily affected the offshore wind facilities that hookup to the transmission system in multiple locations. In order to address this, I manually went through the queue spreadsheet and removed projects that I thought represented multiple connections. The following table shows the generation capacity in MW expected to be developed for projects in the queue and the expected power capacity by in service year. There are relevant caveats to this information for our purpose. There is no distinction between onshore and offshore wind but all the wind proposed to interconnect in Zone J (New York City) and Zone K (Long Island) is offshore wind so the onshore wind component is the difference between the total and the sum of those zones. The NYISO process is only concerned with utility-scale solar resources that connect directly to the grid so the solar total does not include distributed solar.
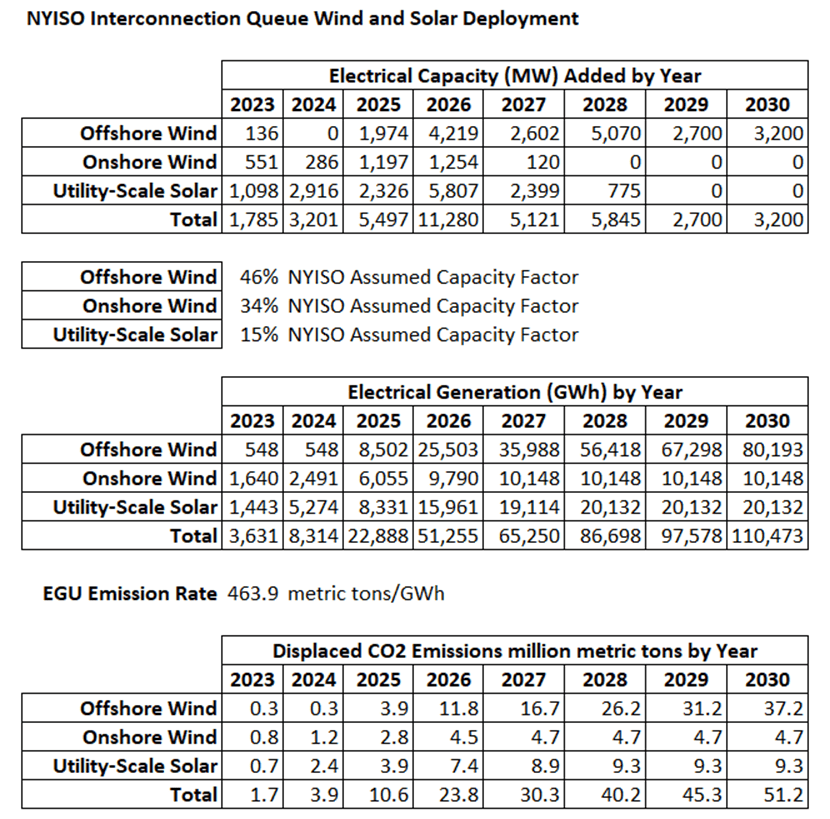
The question for this post is whether this information can be used to simply estimate the status of wind and solar development relative to Climate Act targets. If we assume that the development of these resources directly displaces fossil-fired resources then we can compare the results to the target. In order to displace existing fossil-fired generation the power capacity must be converted to energy. The following tables consider only the wind and utility-scale solar power capacity (MW) in the interconnection queue accumulated by year. I converted this capacity (MW) to energy GWh by using the NYISO assumed capacity factors. The capacity factor is the average expected energy production divided by the maximum possible energy production. The cumulative expected electric generation per year is shown in the next table. Assuming that every GWh produced by these renewable resources displaces fossil generation that emits 463.9 metric tons per GWH enables an estimate of the annual displacement per year can be made. Using this methodology, the wind and solar resources in the interconnection queue will displace 51.2 million metric tons of CO2 in 2030.
Electric Sector Emissions and Targets
I estimated the 2030 target by using data from the DEC annual GHG emission inventory. The latest inventory of the Statewide GHG Emissions Report (available at this website) was published in December 2022 and contains data for 2020. The emission information is also available for download from Open Data NY. The Climate Act mandates unique emissions accounting procedures that include emissions from imported electricity, imported fossil fuels, and electric transmission as well as the direct emissions of CO2.
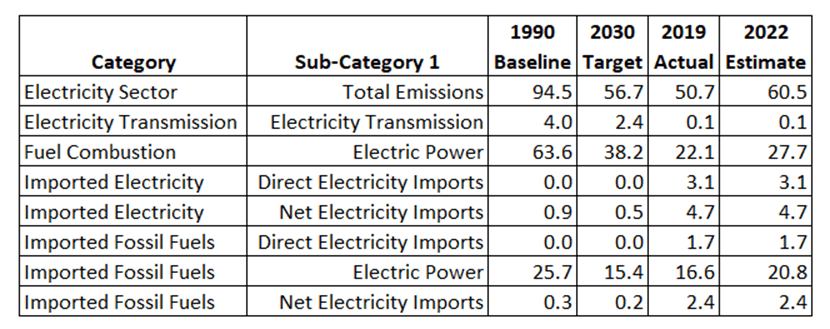
The following table lists the 1990 baseline, the 2030 target (40% reduction of the baseline, and the observed emissions data from the most recent inventory. DEC makes the point that the 2020 emissions were not representative and suggests using 2019 data for the current status. The electric sector total baseline emissions were 94.5 million metric tons of CO2e (MMT CO2e) so the 2030 40% reduction target is 56.7. In 2019 the total sector emissions were 50.7 MMT CO2e. Emissions for all the subsectors including the Open Data NY data are also shown. However, New York State shut down 2,000 MW of zero emissions nuclear generation at Indian Point and that increased direct fuel combustion emissions to 27.7 MMT CO2e. Assuming that the imported fossil fuels for electric power would increase in proportion to the 2019 to 2022 change in emissions and that all the other sub-sector emissions stays the same results in an overall estimate of 60.5 MMT CO2e for 2022.
Open Data NY Greenhouse Gas Emissions Electricity Sector Emissions
The previous section estimated the emissions from generation displaced by the development of the wind and solar resources in the NYISO interconnection queue. According to this crude estimate the new resources will displace fossil generation expected to produce 51.2 MMT CO2e for the fuel combustion in the electric power subsector. That is more than the combined 2022 fuel combustion and imported fossil fuels for electric power subsectors which implies that if these resources get built that compliance will be ensured. Unfortunately, this approach does not tell the whole story because it relies on averages.
Problem with Averages
In September 2021, Terry Etam wrote an article that I think clearly explained the problem with using averages like I did in the analysis above. While his predictions that there would be a European energy shortage in the winter of 2021 -2022 did not turn as he predicted, the concepts he described are relevant.
His article introduced the problem:
Well, maybe I’d like to talk about statisticians, as in the old joke about the one that drowned because he forded a river that was only three feet deep, on average. See, isn’t that better than politics already? However, as funny as a drowned statistician may be, there is a serious side to the problem with relying on averages. You really can die, for starters.
Before getting back to death and/or politics again (redundancy, I know), let’s think about the use of averages. A car may be designed for the average – one doesn’t find the tallest person on earth and design an interior to accommodate them. The exceptions get to either bang their shins or dangle their feet, but that’s the way it has to be.
In other areas, it can’t work that way. Do you insulate your house for average conditions? No, of course not. Do you install an air conditioner for average conditions? Same. And on it goes. When the risk of harm goes up, we design for the extremes, not the averages. Or we should.
A whole world of trouble will come your way if your plans are built on averages but you cannot live with the extremes. Or even with substantial variations. Europe, and other progressive energy parts of the world, are finding this out the hard way.
Etam then explained how this issue is relevant to the net-zero transition:
In the race to decarbonize the energy system, wind and solar have taken a dominant lead. Nuclear is widely despised. Hydrogen has potential, but is a long way out, as a major player. On the assumption that Hydrocarbons Must Go At Any Cost, wind and solar are the winners. Bring on the trillions. Throw up wind turbines everywhere. Blanket the countryside in solar panels.
The media loves the wattage count as fodder for headlines; big numbers dazzle people. “The United States is on pace to install record amounts of wind and solar this year, underscoring America’s capacity to build renewables at a level once considered impossible…The U.S. Energy Information Administration expects the U.S. will install 37 gigawatts of new wind and solar capacity this year, obliterating the previous record of almost 17 GW in 2016,” bleated the ironically named Scientific American website. Wow, gigawatts. No idea what those are but they sound huge.
What is the problem with all that capacity? Well, how good is it? Let’s see…at a 33 per cent capacity factor (used by the US government as apparently reasonable), that 37 GW is just over 12 GW of power contributed to the grid, on average. The assumption seems to be then that 12 GW of dirty old hydrocarbons have been rendered obsolete, and, for the energy rube, the number is an even more righteous 37 GW, because, you know, some days it is really windy all over.
But, what happens when that load factor is…zero? Because it happens.
This is the critical point. In the existing system outages are independent of each other. If there are five 100 MW gas turbines each with an 80% capacity factor it is reasonable to expect that four of the turbines will be available at any one time. That is not the case for solar and wind. None of the solar resources will be available at night. With regards to wind, it turns out that the reason for light winds is a high-pressure system and those systems are typically bigger than New York so when one wind turbine is producing low power due to light winds, odds are most of the others are too. Etam explains what has happened in Great Britain:
The current poster child for the issue is Great Britain. The UK has 24 GW of wind power installed. The media loves to talk about total renewable GW installed as proof of progress, and the blindingly rapid pace of the energy transition.
However over the past few weeks wind dropped almost to zero, and output from that 24 GW of installed capacity fell to about 1 or 2 GW.
Ordinarily, that would be no problem – just fire up the gas fired power plants, or import power from elsewhere.
But what happens when that isn’t available?
More pertinently, what happens when the likelihood of near-zero output happens to coincide with the times when that power is needed most – in heat waves, or cold spells? That brings us to the current grave situation facing Europe as it heads towards winter. Gas storage is supposed to be filling rapidly at this time of year, but it’s not, for a number of reasons.
This happens everywhere. It is exactly the issue that the Integration Analysis, New York Independent System Operator (NYISO), and New York State Reliability Council all said required an entirely new generating resource to solve but the Climate Action Council chose to ignore because one Council member with an out-sized influence but little relevant experience claimed was not an issue. Etam goes on to pull no punches when he describes the resulting impacts.
Let’s drive this energy conundrum home a little better for all these people who are, as Principal Skinner put it on the Simpsons, “furrowing their brows in a vain attempt to comprehend the situation.”
The world has been sold a faulty bill of goods, based on a pathetically simplistic vision of how renewable energy works. A US government website highlights the problem with this example: “The mean turbine capacity in the U.S. Wind Turbine Database is 1.67 megawatts (MW), At a 33% capacity factor, that average turbine would generate over 402,000 kWh per month – enough for over 460 average U.S. homes.”
Thus armed, bureaucrats and morons head straight to the promised land by multiplying the number of wind turbines by 460 and shocking-and-awing themselves with the results. Holy crap, we don’t need natural gas anymore (as they tell me in exactly those words).
So they all start dismantling the natural gas system – not directly by ripping up pipelines, but indirectly by blocking new ones, by championing ‘fossil-fuel divestment campaigns’, by taking energy policy advice from Swedish teenagers – and then stand there shivering in dim-witted stupor when the wind stops blowing, and the world’s energy producers are not in any position to bring forth more natural gas.
It’s not just Britain that is squirming. A Bloomberg article (which I cannot link to as I will never willingly send Bloomberg a cent) notes the following unsettling news: “China is staring down another winter of power shortages that threaten to upend its economic recovery as a global energy supply crunch sends the price of fuels skyrocketing. The world’s second biggest economy is at risk of not having enough coal and natural gas – used to heat households and power factories – despite efforts over the past year to stockpile fuel as rivals in North Asia and Europe compete for a finite supply.”
In my opinion this is a good representation of the situation facing New York State as a result of the Climate Act.
Conclusion
The assumption that an overall capacity factor can be used with the projected new generation capacity in the interconnection queue to estimate the displacement of fossil fuel resources is wrong because of the strong correlation between all the solar resources and all the wind resources in New York. The only way to address this is with detailed resource modeling like the analyses from the NYISO. I don’t even think that the NYISO resource adequacy modeling is currently capable of completely addressing the problem of the correlated renewable generating resources for the worst case. I know that the wind and solar variability issue is a priority for improvements. In the meantime, the NYISO modeling is the best resource we have and should be used to determine how the wind and solar resources in the queue will displace fossil-fired resource emissions. Clearly, the state deserves an analysis that shows where we stand relative to these targets using the NYISO model results.
Etam goes on to make the point that this mis-understanding is going to lead to energy shortages in worst case situations that will result if the Climate Act implementation fails:
Hundreds of millions of people without adequate heating fuel in the dead of winter is not particularly funny. If a cold winter strikes, all the yappiest energy-transition-now dogs will fade into the woodwork, distancing themselves from the disinformation they’ve propagated and the disaster they’ve engineered. People in position of responsibility will have no choice but to speak out loud the words they’ve dared not utter for a decade: you need hydrocarbons, today, tomorrow, and for a very long time yet. So start acting like it.
