

A recent article by Ed Reid prompted me to put together this post. Reid compared different Offshore Wind (OSW) developer estimates of the capacity factor of a couple of projects and found inconsistencies. This article compares his results with Climate Leadership & Community Protection Act (Climate Act) OSW projections. I also address energy storage implications associated with OSW.
I have followed the Climate Act since it was first proposed, submitted comments on the Climate Act implementation plan, and have written over 350 articles about New York’s net-zero transition. I have devoted a lot of time to the Climate Act because I believe the ambitions for a zero-emissions economy embodied in the Climate Act outstrip available renewable technology such that the net-zero transition will do more harm than good by increasing costs unacceptably, threatening electric system reliability, and causing significant unintended environmental impacts. The opinions expressed in this post do not reflect the position of the New York State Reliability Council, the Extreme Weather Working Group, any of my previous employers or any other organization I have been associated with, these comments are mine alone.
Climate Act Background
The Climate Act established a New York “Net Zero” target (85% reduction and 15% offset of emissions) by 2050. It includes an interim 2030 reduction target of a 40% reduction by 2030 and a requirement that all electricity generated be “zero-emissions” by 2040. The Climate Action Council is responsible for preparing the Scoping Plan that outlines how to “achieve the State’s bold clean energy and climate agenda.” In brief, that plan is to electrify everything possible using zero-emissions electricity. The Integration Analysis prepared by the New York State Energy Research and Development Authority (NYSERDA) and its consultants quantifies the impact of the electrification strategies. That material was used to develop the Draft Scoping Plan. After a year-long review, the Scoping Plan recommendations were finalized at the end of 2022. In 2023 the Scoping Plan recommendations are supposed to be implemented through regulation and legislation.
Off Shore Wind (OSW) is supposed to be a major renewable resource in the “zero-emissions” electric energy system. The Climate Act mandates 9,000 MW of Off Shore Wind (OSW) generating capacity by 2035. The Integration Analysis modeling used to develop the Scoping Plan projects OSW capacity at 6,200 MW by 2030, 9,096 MW by 2035 and reaches 14,364 MW in 2040. On the other hand, the New York Independent System Operator 2021-2040 System & Resource Outlook expects 5,036 MW in 2030 and 9,000 MW in 2035 with no additional development after that. By 2030 the Integration Analysis predicts that 14% of the electric energy (GWh) produced will come from OSW and the Resource Outlook predicts nearly as much (12%). This is an extraordinary build-out for a resource that is currently non-existent.
Capacity Factors
The capacity factor is a useful metric to understand and compare electric generation resources. The annual capacity factor equals the actual observed generation (MWh) divided by maximum possible generation (capacity (MW) times 8,760 hours. At sea the wind resource higher capacity factors are higher than onshore wind resources, primarily because there are no hills and vegetation to slow down wind. Supporters of OSW tout the higher capacity factors of this resource as a big benefit.
Ed Reid writing at The Right Insight describes issues with Offshore Wind (OSW) data used for claiming benefits. Reid described developer claims for two projects:
Orsted’s recently approved Ocean Wind 1 development, to be located off the New Jersey coast near Atlantic City and Ocean City, would consist of one hundred 11MW wind turbine generators, for a total capacity of 1,100 MW. This would suggest annual generation, at a 100% capacity factor, of 9,600 GWh. The International Energy Agency uses a capacity factor of 50% for offshore wind. We will use that figure here, since there is no offshore wind capacity factor data for the US East Coast. This suggests annual production of approximately 4,800 GWh for Ocean Wind 1.
……………………..
Dominion Energy’s proposed Coastal Virginia Offshore Wind (CVOW) development, to be located off the Virginia coast near Norfolk, would consist of one hundred seventy-six 15 MW wind turbine generators, for a total capacity of 2,600 MW. This would suggest annual generation, at a 100% capacity factor, of approximately 22,800 GWh, or approximately 11,400 GWh at a 50% capacity factor.
The US Energy Information Administration reports average US residential electricity consumption as 10,600 kWh per year. The developers describe the output of their projects in terms of the number of homes served. Reid estimates capacity factors for both projects using that information. Orsted projects that Ocean Wind 1 would serve 500,000 homes. Based on these numbers, Ocean wind would have to generate 5300 GWh per year, or a capacity factor of approximately 55%. Dominion projects that CVOW would serve 660,000 homes. Using the same approach, the annual capacity factor of the Dominium CVOW would be 30%. Thar is far lower than the IEA figure.
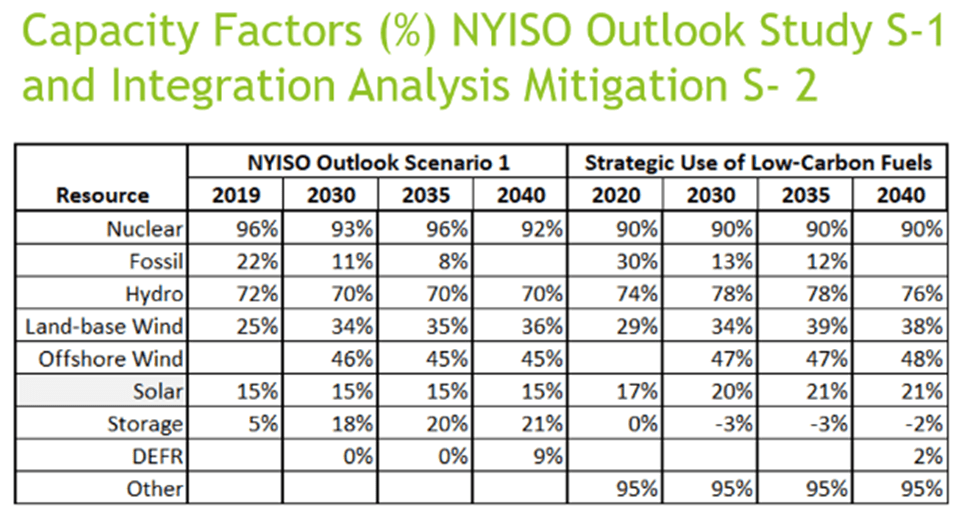
I compared the New York Independent System Operator (NYISO) 2021-2040 System & Resource Outlook modeling analysis with the Integration Analysis modeling and determined the capacity factors used. The following table lists the capacity factors for different generating resources including offshore wind. There is no question that OSW resources have higher capacity factors than onshore wind or solar. The NYISO annual projections are around 45% while the Integration Analysis projects slightly higher estimates no greater than 48% These estimates are closer to the International Energy Agency capacity factor of 50% than either Ocean 1 or CVOW. Note that the renewable resources capacity factors represent the best they can do but that the fossil capacity factor is low because, in part, they are displaced by wind and solar.
Estimates and Averages
Reid describes average estimates used for the OSW developer claims:
The estimates above are based on a number of averages: average wind resource; average capacity factor; average maintenance and repair allowances; and, average residential electricity consumption. The available wind resource varies on time scales from minutes to hours to days to seasons, as does residential energy consumption and demand. The use of averages loses a lot of the detail of the match between customer load and generator output.
He explains that intermittent generation from wind turbines shifts the resources used in the grid:
Since each of these industrial wind installations would be connected to a grid with a far larger customer base than the claimed number of residential customers served, above average output would be absorbed by other loads on the grids, displacing a portion of the output from some form(s) of conventional generation. Below average generator output would require support from some form(s) of conventional generation.
In my opinion, the intermittency of wind and solar projects should be addressed by the developer. As it stands now somebody else must provide supporting conventional generation or energy storage so wind and solar get a free ride. Reid explains the problem:
Arguably, fluctuations in generator output and customer load could also be compensated for by additions to and withdrawals from some type of energy storage capacity. However, there is no energy storage capacity included in either of the wind projects discussed above. The issue of storage can be deferred as long as there is sufficient excess conventional generating capacity available to compensate for the fluctuation of the output of the wind facilities and maintain a capacity reserve margin. However, as conventional generating capacity is retired due to age or regulation, and additional intermittent renewable generating capacity is added, addressing the issue of storage cannot be avoided.
Extremes
All issues related to the net-zero transition are more complicated than expected at first glance. In order to address this complexity, more explanation and analysis are required. For example, in this instance Reid wrote a short article addressing average fluctuating wind resources. He did not call out the extreme case when the wind resource is essentially zero for extended periods probably because it would have made the story too long. However, I think this is a critical consideration. Since the beginning of the Climate Act implementation process, lulls of renewable energy production, what I call the ultimate problem, has been a concern.
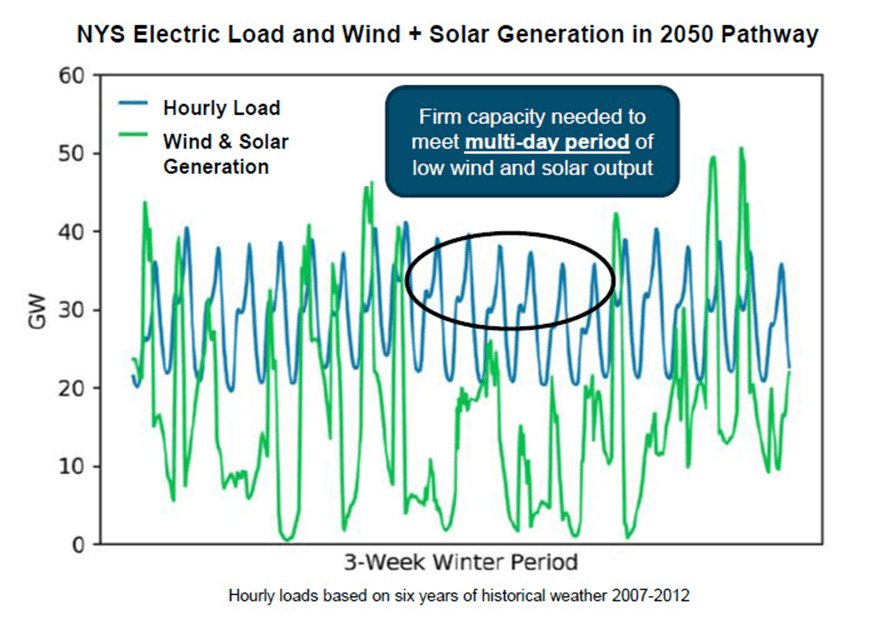
In their presentation to the Power Generation Advisory Panel on September 16, 2020 Energy + Environmental Economics (E3) noted that: “The need for dispatchable resources is most pronounced during winter periods of high demand for electrified heating and transportation and lower wind and solar output”. They also noted that: “As the share of intermittent resources like wind and solar grows substantially, some studies suggest that complementing with firm, zero emission resources, such as bioenergy, synthesized fuels such as hydrogen, hydropower, carbon capture and sequestration, and nuclear generation could provide a number of benefits.” Of particular interest is the graph of electric load and renewable generation because it shows that this problem may extend over multiple days.
Since the time of this presentation, the New York State Independent System Operator (NYISO), New York State Reliability Council, and Public Service Commission in the Order Initiating Process Regarding Zero Emissions Target in Case 15-E-0302 all have been considering the ramifications of this problem. The New York State Reliability Council Extreme Weather Working Group (EWWG) was established to “identify actions to preserve New York Control Area reliability for extreme weather events and other extreme
system conditions” and create a corresponding action plan to “evaluate the potential need for
new resource adequacy and transmission planning design rules for planning the system to meet
extreme weather and other extreme conditions.” Wind lulls are one of the extreme weather events being considered by the EWWG.
The EWWG looked at the observed correlation of the frequency and duration of low-wind episodes across the entire state, including the offshore wind development areas. This summer they finalized a report titled Off Shore Wind Data Review – NYSRC Preliminary Findings (“OSW Report”) that is relevant to this discussion. The OSW Report analysis was based on an NYISO analysis that made available 21 years of hourly wind data at seven wind development sites (Figure 1), extending from New Jersey to Rhode Island, prepared by its consultant DNV. DNV performed analysis of wind data translating meteorological data into detailed power profiles for each site including loss considerations. The report describes frequency analysis and interregional impacts.

Figure 1: Seven Wind Development Sites Analyzed
The OSW Report wind lull analysis is relevant to this discussion. The analysis defined wind lulls as periods of each hour of wind output of less than 5%-20%. For extended periods of 24 hours or longer, lulls occur about 30 times per year on average. Wind lulls of 48 hours or longer occur on average about seven times per year, and wind lulls of 72 hours or longer occur on average two times per year. About 70% of these wind lulls over the 21-year period occurred during the current peak load four-month summer period from June to September.
Of note, is the following finding:
Lastly an analysis was performed to identify the most persistent wind lull experienced in the 20-year wind data with net capacity factor less than 10% for the entire period across all seven wind sites. Analysis indicates wind lulls of up to 86 hours with an average energy output of approximately 5% net capacity factor occurring across all seven sites were observed in the DNV dataset (this compares to an average annual net capacity factor of approximately 45%). While data associated with longer periods than 21 years were not readily available it may be appropriate to characterize this as a 1 in 20 year extreme weather event.
Reid explained that compensating load can be provided by adjoining transmission operators. This report addresses this concern relative to the OSW resource:
NY relies on emergency assistance from neighboring regions to achieve reliable system design, thus continued availability of surplus power from these areas is an important consideration. Similar to NY, policy makers from PJM and New England are also moving forward with policies to install large scale wind power to address decarbonization and planned shutdown of thermal units, with proposals in each region also totaling tens of thousands of MW. As noted in Section 3.0, OSW off the coast of the state of New Jersey is targeted at 7.5 GW by 2035 increasing to 11.0 GW by 2040, and similarly OSW off the coast of Rhode Island/ Massachusetts is targeted at 8.0 GW by 2035. In total PJM member States have announced off shore wind targets totaling 24 GW by 2035, and 32.7 GW by 2040.
The OSW Report compares the output from all seven wind sites during an interregional wind lull event which occurred August 8, 2017 – August 13, 2017. Over that time period the following graph shows that the fraction of wind output from all the sites clearly correlates. The implication is that compensating load will not be available from adjoining transmission operator’s OSW resources in periods like this.

The OSW Report concludes:
It is noted reliability of the traditional interconnected power system design relies on diversity of forced outage rates and independence of outage events. Correlation of interregional wind lulls eliminates diversity of loss of power output events associated with OSW and alters this aspect of system design.
Interregional wind lulls simultaneously impacting tens of thousands of MWs of interregional OSW located in PJM, NY and NE could reduce reserve sharing and emergency assistance available for support from neighboring control areas significantly impacting operational reliability and resource adequacy.
The most important point of this article is that the OSW Report documents correlation of interregional wind lulls. I believe this problem extends to onshore and wind and solar resources. I have looked at enough New York onshore wind data to be certain that this correlation extends to all the onshore wind resources in New York and adjoining regions. When it comes to solar, cloudiness affecting New York State solar may not be as highly correlated with wind but at night every single solar facility will not be producing any power.
One of the challenges faced by the EWWG is trying to determine the worst-case renewable resource lull. NYISO has had DNV do a similar analysis for onshore wind and solar resources in New York using the same 21-year data set. Metrological experts on the EWWG have suggested using as long an input meteorological dataset as possible for an analysis to obtain a fuller understanding of range and return period of events.
Finally, there is one more complication. The meteorological conditions that lead to the lowest wind resource availability are associated with the coldest and hottest periods of the year. Those periods cause the peak annual loads. Wind and solar may provide power most of the time but when electricity is needed the most, they are expected to provide their lowest output. I think this is an enormous challenge to the proposed “zero-emissions” electric grid that can only be addressed by using nuclear power.
Energy Storage Implications
To always provide reliable electricity, energy storage is needed to cover periods when solar and wind are not available. Obviously, energy storage is needed to cover the daily variation of solar. Energy storage duration is not a large issue for this requirement. On the other hand, there is a seasonal variation of solar irradiance and resulting power output that needs a long-duration storage solution. There are no commercially available long-duration storage systems that can be expanded to meet New York’s requirements. There are also seasonal variations in wind resource availability that require a long duration system. The biggest problem is the worst-case renewable resource lull. The EWWG analysis found a one in twenty-year resource deficiency which is something that no long-duration storage system could ever effectively address.
There are serious energy storage technological hurdles that have not been resolved. Francis Menton writing at the Manhattan Contrarian summarizes energy storage problems in a recent post on a new British Royal Society report “Large-scale energy storage.” Menton explains (my emphasis added):
Having now put some time into studying this Report, I would characterize it as semi-competent. That is an enormous improvement over every other effort on this subject that I have seen from green energy advocates. But despite their promising start, the authors come nowhere near a sufficient showing that wind plus solar plus storage can make a viable and cost-effective electricity system. In the end, their quasi-religious commitment to a fossil-fuel-free future leads them to minimize and divert attention away from critical cost and feasibility issues. As a result, the Report, despite containing much valuable information, is actually useless for any public policy purpose.
As noted previously wind and solar resources will be at their lowest expected availability during periods when the electric load peaks. When heating and transportation is electrified this problem is exacerbated, peak loads will occur in the winter when solar resources are inherently low. The Scoping Plan glossed over this challenge and nothing since directly addresses the challenge. The rational thing to do would be to develop demonstration projects to prove feasibility and cost of the new technology needed before dismantling the current system. Francis Menton explains why this is necessary and how it could work.
Conclusion
Ed Reid explains how OSW developers describe the output of their projects in terms of the number of homes served. He found issues with their calculations. The developers ignore the support needed to provide electricity to the homes served when the wind isn’t blowing.
Supporters of OSW tout the higher capacity factors of this resource as a big benefit. Ed Reid describes deficiencies in their arguments using average data. This article explains that the problem becomes more acute when shorter-term extended renewable resource lulls are considered. OSW will perform better than other renewable resources during periods when the energy is not critically needed. The conundrum is that when it is needed most, OSW will fail at the same time New York’s onshore wind resources fail so an as yet commercially unavailable energy storage technology is needed. All indications are that this problem extends into the adjoining control areas so they cannot be counted on. Addressing this issue is a critical reliability consideration. If not addressed correctly then the grid will fail when needed most and people will freeze to death in the dark.
