

This is my 400th article on the Climate Leadership & Community Protection Act (Climate Act) net-zero transition. It seems appropriate to look at where the state stands relative to the time when I started writing these articles and the Climate Act targets. This summary supplements the progress status summary described by Francis Menton and the generation trend status prepared by Nuclear New York by looking at Greenhouse Gas (GHG) emissions.
I have followed the Climate Leadership & Community Protection Act (Climate Act) since it was first proposed, submitted comments on the Climate Act implementation plan, and have written 400 articles about New York’s net-zero transition. The opinions expressed in this post do not reflect the position of any of my previous employers or any other organization I have been associated with, these comments are mine alone.
Overview
The Climate Act established a New York “Net Zero” target (85% reduction in GHG emissions and 15% offset of emissions) by 2050. It includes an interim 2030 reduction target of a 40% reduction by 2030 and a requirement that all electricity generated be “zero-emissions” by 2040. The Climate Action Council (CAC) is responsible for preparing the Scoping Plan that outlines how to “achieve the State’s bold clean energy and climate agenda.” In brief, that plan is to electrify everything possible using zero-emissions electricity. The Integration Analysis prepared by the New York State Energy Research and Development Authority (NYSERDA) and its consultants quantifies the impact of the electrification strategies. That material was used to develop the Draft Scoping Plan outline of strategies. After a year-long review, the Scoping Plan was finalized at the end of 2022. In 2023 the Scoping Plan recommendations were supposed to be implemented through regulation, PSC orders, and legislation. Not surprisingly, the aspirational schedule of the Climate Act has proven to be more difficult to implement than planned. Many aspects of the transition are falling behind, and the magnitude of the necessary costs is coming into focus. When political fantasies meet reality, reality always wins.
Nuclear New York – Generation Trends
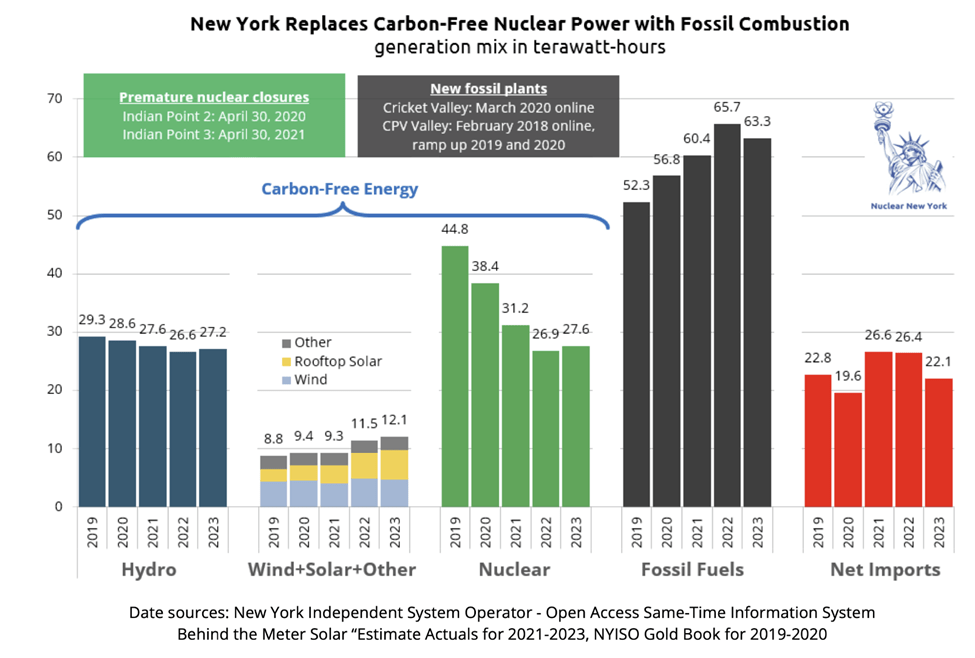
In a press release on January 8, 2024 Nuclear New York, “Independent Advocates for Reliable Carbon-Free Energy” explained that “four years since passing the Climate Act, New York struggles to replace shuttered clean energy “. Their release stated (foot notes removed):
In 2023, nuclear power was once again the largest single source of clean energy in New York State. Electricity generation from this carbon-free source totaled 27.6 terawatt hours (TWh), up 2.7% over 2022. Nuclear covered 18.1% of the state’s total electricity demand (including behind-the-meter “rooftop” solar generation), and amounted to 42.7% of in-state clean electricity.
Hydro, the second largest source of carbon-free power, recovered 2.1% in 2023 to 27.2 TWh, covering 17.9% of demand. These two ‘firm clean’ generation sources provide on-demand power regardless of the time of day or weather.
Despite increasing deployed wind capacity in 2022 by 13% over 2021, generation from this source declined 3.9% in 2023 over 2022 to 4.7 TWh, demonstrating the perils of relying on weather-dependent renewable energy. New York Independent System Operator (NYISO) does not report grid-connected solar as a separate category, given its currently minuscule contribution to the generation mix. However, rooftop solar generation increased 18% to 5.2 TWh, covering 3.4% of demand.
New York’s electricity demand declined by 4.8 TWh over 2022 (-3.1%), which enabled the state to reduce net imports by 4.3 TWh. In-state fossil fuel combustion decreased by 2.3 TWh, but remained 11.0 TWh (21%) above 2019 levels, when clean energy generation peaked.
Updates on the March to the New York Great Green Future
Francis Menton’s update on the net-zero transition asks the question where are we and responds:
The Manhattan Contrarian Energy Storage Report of December 1, 2022, led off by sounding a clear alarm: getting electricity from intermittent wind and solar well past 50% of total generation would require enormous quantities of energy to be stored, with technical requirements, including duration of storage, well beyond the capability of any battery currently existing or likely to be invented any time soon. Essentially, if fossil fuels are to be eliminated, there is only one realistic possibility for meeting the storage requirements: hydrogen.
In mid-2023, the New York Independent System Operator, to its credit, recognized the problem — although it buried that recognition deep in a report when it should be shouting about the problem from the rooftops. From NYISO’s Power Trends 2023 Report, revised August 2023, page 7, starting in the middle of a paragraph and without any emphasis:
“[T]o achieve the mandates of the CLCPA, new emission-free generating technologies with the necessary reliability service attributes will be needed to replace the flexible, dispatchable capabilities of fossil fuel generation and sustain production for extended periods of time. Such emission-free technologies, either individually or in aggregate, are not yet available on a commercial scale.“
With hydrogen as the only possible such “emissions-free generating technology,” how much would hydrogen cost as the solution to this problem, particularly if one follows the hypothesis that it must be created without any use of fossil fuels? My Report, page 14, noted that existing commercial production of this so-called “green” hydrogen was “negligible,” leaving no good benchmark for understanding what the costs might be. As a substitute, I ran some rough numbers based on cost of wind and solar generators to make the electricity and efficiency of the electrolysis process. The result was a very rough estimate that this “green” hydrogen would cost “somewhere in the range of 5 to 10 times more” than natural gas (page 17).
Well, now some new precision has come into view. In July 2022 the UK government launched what it calls its First Hydrogen Allocation Round (HAR 1), to obtain bids and award contracts to produce this so-called “green” hydrogen using wind power. The process took a while, but here from December 14, 2023 is the announcement of the first round of contract awards. Excerpt:
“Following the launch of the first hydrogen allocation round (HAR1) in July 2022, we have selected the successful projects to be offered contracts. We are pleased to announce 11 successful projects, totalling 125MW capacity. HAR1 puts the UK in a leading position internationally: this represents the largest number of commercial scale green hydrogen production projects announced at once anywhere in Europe. . . . The 11 projects have been agreed at a weighted average strike price of £241/MWh.“
£241/MWh? At today’s exchange rate of 1.27 $/£, that would be $306/MWh. Prices of natural gas are generally quoted in $/MMBTU rather than per MWh, but here is EIA’s latest Electricity Monthly Update, dated December 21 and covering the month of October 2023. It gives natural gas prices in the per MWh units. The “price of natural gas at New York City” is given as $11.32/MWh. That would make the price that the UK has just agreed to pay to buy this “green” hydrogen stuff approximately 27 times what we can buy natural gas for here in New York to obtain the same energy content.
And that $306/MWh is just for the hydrogen. It includes nothing for the massive new facilities (underground salt caverns?) to store the stuff, for a new pipeline network to transport it, and for a new collection of power plants to burn it.
Electric Generating Unit Emission Trends
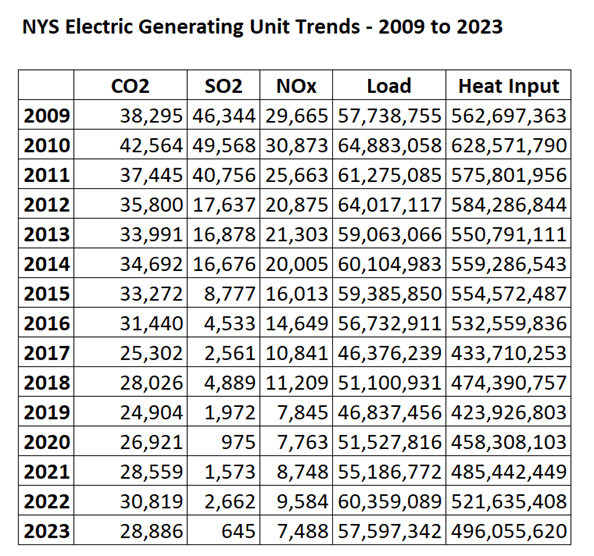
Electric generating units report emissions to the Environmental Protection Agency Clean Air Markets Division as part of the compliance requirements for the Acid Raiin Program and other market-based programs that require accurate and complete emissions data. The 2023 emissions data submittal date was January 31 and I downloaded the data the next day. Something has changed in the data access system so I could not check to see if all the facilities reported on time. If some facilities had to ask for a delayed submittal this could mean that the totals are lower that actual emissions.
The following table lists the emissions since 2009 when the Regional Greenhouse Gas Initiative started. Emissions of CO2, SO2, and NOx are down dramatically over this period. The primary reason is that the fracking revolution made the cost of natural gas so cheap relative to other fuels that every facility that could convert to natural gas did so. New York banned the use of coal in 2021 which forced the retirement of the remaining coal plants. The state still has some facilities that primarily burn residual oil but those run infrequently. The takeaway message is that the fuel switching options are no longer available so future reductions will only come as zero-emissions resources displace facilities burning fossil fuels.
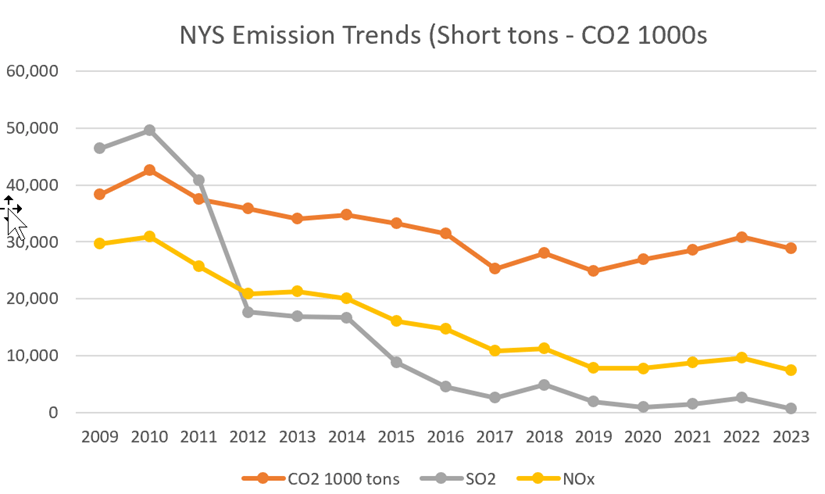
The following graph shows the emission trends. Note that I divided the CO2 emissions by 1,000 so that all the parameters would show up on the same plot. The impact of the closure of the Indian Point nuclear facility mentioned in the Nuclear New York presentation is clearly shown as CO2 rose over the last three years until the 2023 emissions started down. Importantly that could be mostly due to weather variations and not necessarily the addition of the renewables shown above.
New York State GHG Emission Trends
A relevant question is where we stand in regards to the Climate Act mandate for a 40% reduction from a 1990 baseline in GHG emissions by 2030. Unfortunately, that is not easily answered in sufficient detail to be able to figure out what is going on.
The regulation setting the 1990 baseline emissions values that form the basis for the 2030 40% reduction and the 2050 85% reduction was promulgated in 2020. It sets the limits
§ 496.4 Statewide Greenhouse Gas Emission Limits
(a) For the purposes of this Part, the estimated level of statewide greenhouse gas emissions in 1990 is 409.78 million metric tons of carbon dioxide equivalent, using a GWP20 as provided in Section 496.5 of this Part.
(b) For the purposes of this Part, the table below establishes statewide emission limits for the year specified, as a percentage of estimated 1990 statewide greenhouse gas emissions of 60 percent and 15 percent, respectively, measured in millions of metric tons of carbon dioxide equivalent gas using a GWP20 as provided in Section 496.5 of this Part.
| Year | Statewide greenhouse gas emission limit (in million metric tons of carbon dioxide equivalent) |
| 2030 | 245.87 |
| 2050 | 61.47 |
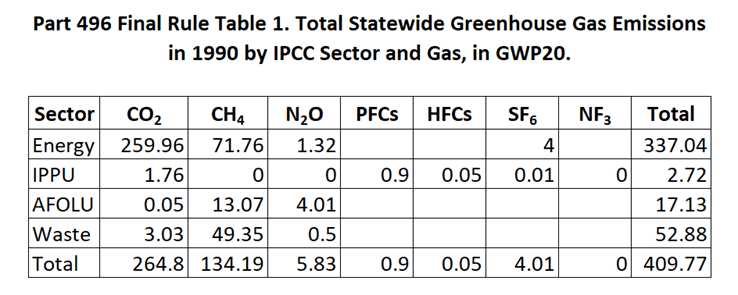
The Regulatory Impact Statement for the regulation included a table that breaks down the 1990 emissions by Intergovernmental Panel on Climate Change Sectors and gases. As shown below there is not much of a breakdown. Note that all the rest of the emissions will be reported as the CO2 equivalents so you do not need to worry about the component gases.
According to the 2023 Statewide GHG Emissions webpage “The Climate Act requires the New York State Department of Environmental Conservation (DEC) to issue an annual report on statewide greenhouse gas emissions, pursuant to Section 75-0105 of the Environmental Conservation Law.” The most recent report covering the years 1990 through 2021 was released in late December 2023. The following reports were released at that time:
- Summary Report (PDF)
- Sectoral Report 1: Energy (PDF)
- Sectoral Report 2: Industrial Processes and Product Use (PDF)
- Sectoral Report 3: Agriculture, Forestry, and Land Use (PDF)
- Sectoral Report 4: Waste (PDF)
- Appendix: CLCPA Emission Factors (PDF)
I extracted summary data from each of the sectoral reports to provide some idea of where New York stands relative to the 2030 targets in the following table. The Part 496 1990 column lists the regulatory baseline numbers. The estimated emissions in the 2023 Statewide GHG Emissions are listed for 1990, 2005, and the last five years. I list the sector 2030 targets (40% of 1990 emissions) and the percentage reduction necessary to meet the targets.
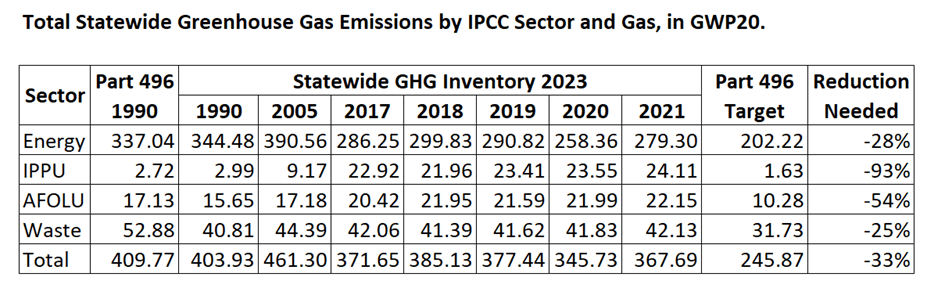
The first thing that pops out is that the 2023 inventory has a different estimate for 1990. GHG emission inventories require indirect estimates of many of the emission sources and the assumptions regarding the emission factor that estimates emissions with an activity and the activity rate. This is a fundamental problem with emission factors and means that for full transparency all the emission factors and associated activity levels should be clearly documented.
The second thing of note is that none of the IPCC sectors are even close to the 2030 targets. The Scoping Plan’s quantitative assessment in the Integration Analysis essentially is a list of control strategies, presumed control efficiencies, and expected emission reductions that when added up meet the limits. That assessment was poorly documented, contains inconsistencies with similar New York Independent System Operator (NYISO) analyses, and there has never been any response to comments about inconsistencies and other issues identified in the Scoping Plan comments. There is no feasibility analysis to determine if those targets can be met with any assurance.
I tried to analyze the data used for the 2023 Statewide GHG Emissions. Those data are available for download from Open Data NY. This is another instance where it is not easy to break down the components of the IPCC sectors to determine if it is realistically possible to meet the 2030 targets because state agencies do not provide consistent data.
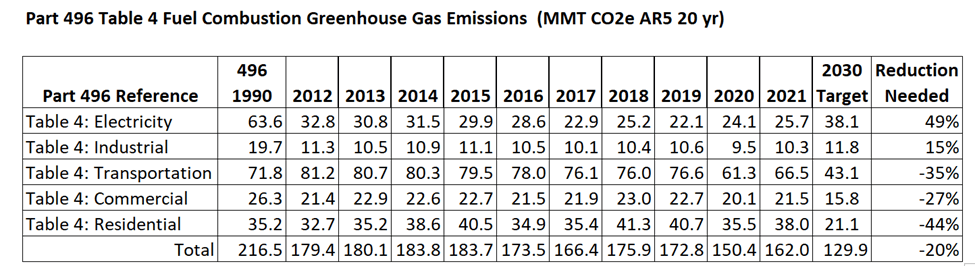
The Regulatory Impact Statement for Part 496 included Table 4 that broke down fuel combustion GHG emissions within the IPCC energy sector. Because I used the dataset itself, I picked the sector categories that I believe match the Table 4 categories. Note that I did not include fuel combustion from petroleum refining in the table because I could not find categories that I thought matched it. The following table lists the results for the last ten years and compared the 2021 emissions to the 2030 target. Fuel combustion in the electric and industrial sectors are already lower than the equivalent 2030 targets. On the other hand, transportation and fuel combustion in the commercial and residential sectors will require significant reductions to meet the targets.
Is that feasible? Consider what is needed for just one parameter. To determine if the transportation fuel combustion reductions are feasible, the expected reductions per gasoline vehicle must be estimated. Miles per gallon and the annual mileage need to be estimated for a range of users and locations so that a reasonable estimate of state-wide fuel use can be estimated. Once you know that then you can determine how many zero-emissions vehicles must be deployed. Is that estimate realistic? That is not all because zero-emissions vehicles also require charging infrastructure and that affects the distribution infrastructure. It is easy to say the model projections meet the 2030 targets but the range of parameters that can be tweaked is so large that any pre-conceived answer can be produced.
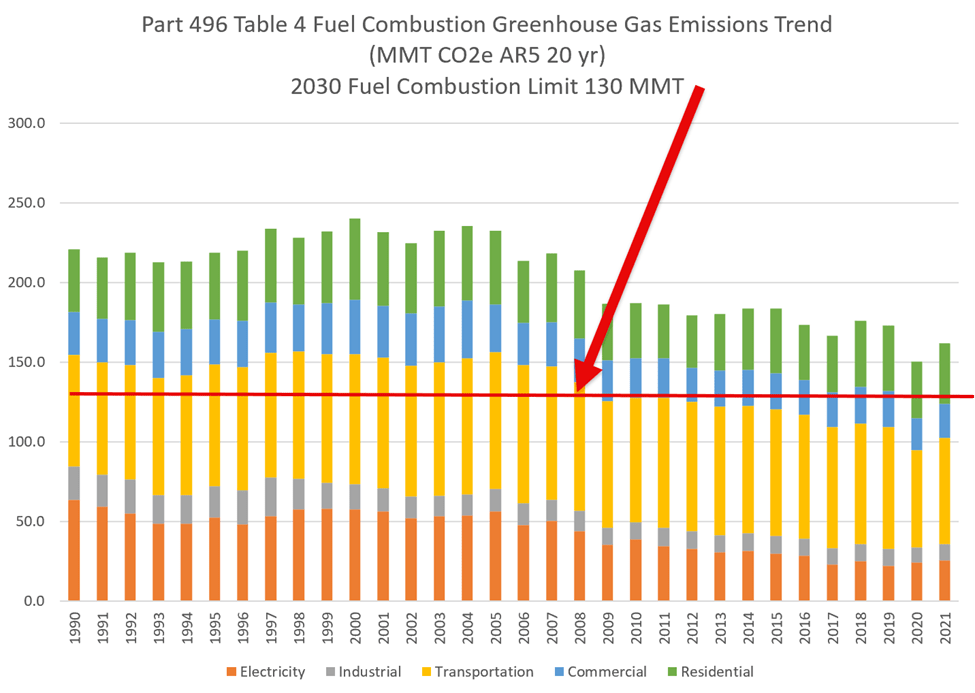
I also put these data in a graph. I am not sure it adds much value, but I spent enough time on it that I don’t want to waste the effort. The overall trend suggests that it might be possible to meet the targets if, and only if, the historical rate of emission reductions can be replicated. Given that the electricity and industrial sectors have achieved the greatest reductions but have no readily available additional reductions, I am not optimistic.
Conclusion
The 400 articles I have written on the Climate Act all lead to the same result. When you look at the numbers as shown in this post, the enormity of the challenge is clear. Paraphrasing Francis Menton:
No person looking at these charts would ever conclude that New York has spent the past five years embarked on a crash program to replace fossil fuels with wind and solar. That process is going absolutely nowhere.
