

On January 26, 2024 the New York State Department of Environmental Conservation (DEC) and the New York Energy Research & Development Authority (NYSERDA) hosted the third webinar (slides and recording) of this year’s New York Cap-and-Invest (NYCI) Program stakeholder engagement process. I described the first webinar “The Role of Cap and Invest” in an earlier post. This post presents my initial impressions of the third webinar of the series, “Preliminary Scenario Analyses”, with particular emphasis on the projected costs.
I have followed the Climate Leadership & Community Protection Act (Climate Act) since it was first proposed, submitted comments on the Climate Act implementation plan, and have written over 380 articles about New York’s net-zero transition. The opinions expressed in this post do not reflect the position of any of my previous employers or any other organization I have been associated with, these comments are mine alone.
Overview
The Climate Act established a New York “Net Zero” target (85% reduction in GHG emissions and 15% offset of emissions) by 2050. It includes an interim 2030 reduction target of a 40% reduction by 2030 and a requirement that all electricity generated be “zero-emissions” by 2040. The Climate Action Council (CAC) is responsible for preparing the Scoping Plan that outlines how to “achieve the State’s bold clean energy and climate agenda.” In brief, that plan is to electrify everything possible using zero-emissions electricity. The Integration Analysis prepared by the New York State Energy Research and Development Authority (NYSERDA) and its consultants quantifies the impact of the electrification strategies. That material was used to develop the Draft Scoping Plan outline of strategies. After a year-long review, the Scoping Plan was finalized at the end of 2022. In 2023 the Scoping Plan recommendations were supposed to be implemented through regulation, PSC orders, and legislation. Not surprisingly, the aspirational schedule of the Climate Act has proven to be more difficult to implement than planned. Many aspects of the transition are falling behind, and the magnitude of the necessary costs is coming into focus. When political fantasies meet reality, reality always wins.
Cap-and-Invest
The Climate Action Council’s Scoping Plan recommended a market-based economywide cap-and-invest program. The program works by setting an annual cap on the amount of greenhouse gas pollution that is permitted to be emitted in New York: “The declining cap ensures annual emissions are reduced, setting the state on a trajectory to meet our greenhouse gas emission reduction requirements of 40% by 2030, and at least 85% from 1990 levels by 2050, as mandated by the Climate Leadership & Community Protection Act (Climate Act).” In addition to the declining cap, it is supposed to limit potential costs to New Yorkers, invest proceeds in programs that drive emission reductions in an equitable manner, and maintain the competitiveness of New York businesses and industries. The stakeholder engagement process will refine the proposal over the next several months, DEC will and NYSERDA will propose regulations by summer, and the final rules are supposed to be in place by the end of the year.
The reality is different particularly because the proposal changes components that have worked in other jurisdictions and environmental activists want to remove certain components that have made similar programs work in the past. The proposed regulations keep many of the necessary features but still make changes that threaten viability. Further background information is available at my carbon pricing initiative page.
Preliminary Scenario Analysis Webinar
The slides and recording for the webinar are available. Note that in the following text there are links to sections of the webinar recording corresponding to specific topics.
The entire webinar was scripted. Each presenter read their remarks and it even appeared that the responses to questions were vetted. Vlad Gutman-Britten (NYSERDA) read the script that gave an overview of the webinar outline. The goal of this webinar was to describe the preliminary scenario analysis that projects how the NYCI allowance market will operate, present expected costs to households, and describe potential benefits of associated emission reductions. I focus on the costs to households in this post.
NYCI Modeling
The preliminary scenarios analysis relies on econometric models. The presentation was pretty vague on exactly which models were used and who did the work. It appears that it relies heavily on the analyses done for the Scoping Plan. If that is true then note that there was no suggestion that those analyses had been updated since they were done in 2022.
To give context for the cost results I briefly describe the modeling. The analyses must project allowance supply and demand. Gutman-Britten described the following slide that gives an overview of the analysis approach.
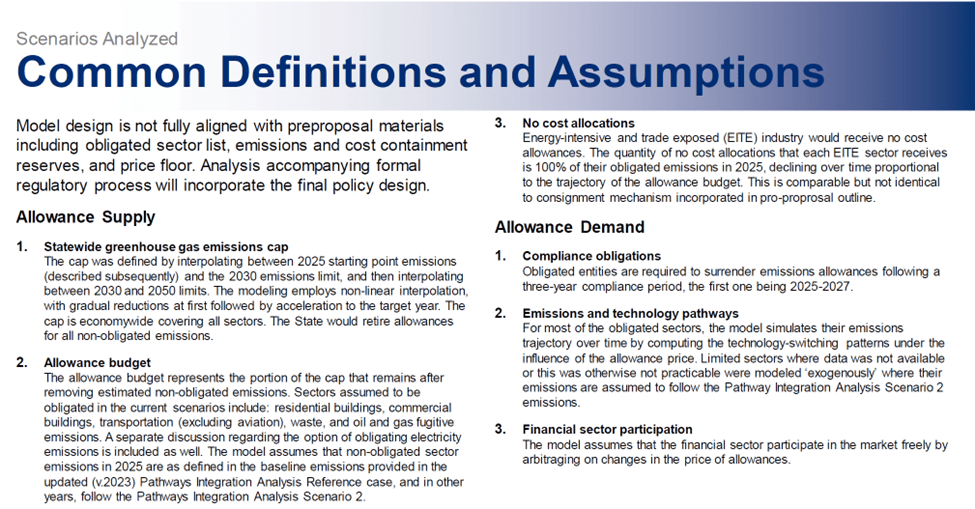
Allowance supply is based on the statewide greenhouse gas emissions cap:
The cap was defined by interpolating between 2025 starting point emissions (described subsequently) and the 2030 emissions limit, and then interpolating between 2030 and 2050 limits. The modeling employs non-linear interpolation, with gradual reductions at first followed by acceleration to the target year. The cap is economywide covering all sectors. The State would retire allowances for all non-obligated emissions.
In general, the allowance budget represents the allowable number of tons for each year of the emissions cap. However, the NYCI proposal treats different sectors of the economy differently to address distinctions between the sectors. To appease particular political constituencies, specific exemptions to all or part of sector allowance requirements have been incorporated into the proposed plan.
The modeling analysis balances the cap with expected emissions to estimate allowance demand for each sector. All the obligated entities will be required to “surrender emissions allowances following a three-year compliance period, the first one being 2025-2027.” For each ton emitted they must submit one allowance. The modeling estimates the expected emissions based on “technology pathways”. I think this technological jargon hides the fact that feasibility is not incorporated into these modeling results.
The final aspect of this modeling is financial sector participation: “The model assumes that “the financial sector participates in the market freely by arbitraging on changes in the price of allowances.” This is an aspect of the modeling where I think theory is not fully aligned with what actually happens in a market-based pollution control program.
The point I wanted to make in this summary of the modeling is that all these projections are subject to enormous uncertainty. There are many aspects of each energy sector transition that are subject to interpretation and the biases of the modelers. As a result, it is easy to get results that coincide with the pre-determined outcomes consistent with the political narrative.
At this time, the modeling analyses for the auction project that 2030 total revenue is “estimated to be between $6 and $12 billion per year ($4-8 billion available for investments).” Sparse details for this calculation were provided and I was not able to reproduce those numbers.
Household Costs
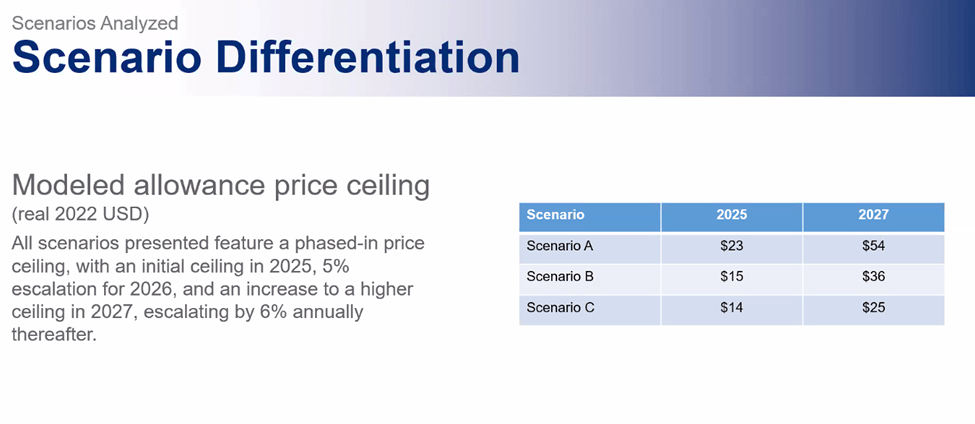
The projected costs from the modeling analysis are included for three scenarios described by Gutman-Britten in the following slide. The analysis modeled three different price ceiling trajectories. The price ceiling value represents the allowance price that triggers a safety valve that would make additional allowances available “for buyers until demand is fully met limited to actual emissions.” The scenarios “follow similar paths but have different price levels for each one.” No explanation was provided justifying the initial price ceiling for each scenario or the timing of the jump step in allowance prices in 2027.
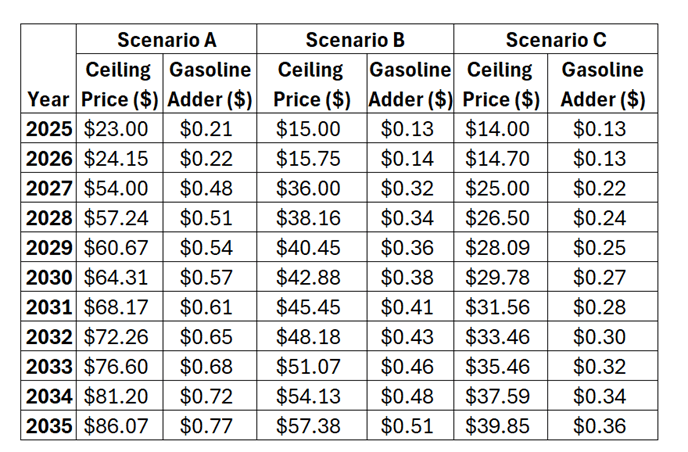
I have always maintained that the primary concern of the general public is Climate Act costs. This presentation does not provide comprehensive cost estimates. In the following table I list the ceiling prices by year for the different scenarios and the corresponding gasoline cost adder as an example of potential costs. According to the US Energy Information Administration, 17.86 lbs of CO2 are emitted per gallon of finished motor gasoline which means that 112 gallons burned equals one ton.
At first glance the 2025 gasoline price adder is not that large. However, the market price for allowances has always been noticeably higher at the start of all allowance trading programs. The uncertainty of a new program lead to higher prices that typically fall back as the program matures. I think the actual price adder at the start of the program will be higher. The other notable feature is the step change increase in 2027. The values listed in 2027 are comparable to the California/Quebec and Washington program allowance prices so I think those prices are more reasonable for eventual New York prices. I suspect there is a connection between the proposed low ceiling prices through 2026 and the 2026 gubernatorial election year that explains the timing of the step change in 2027.
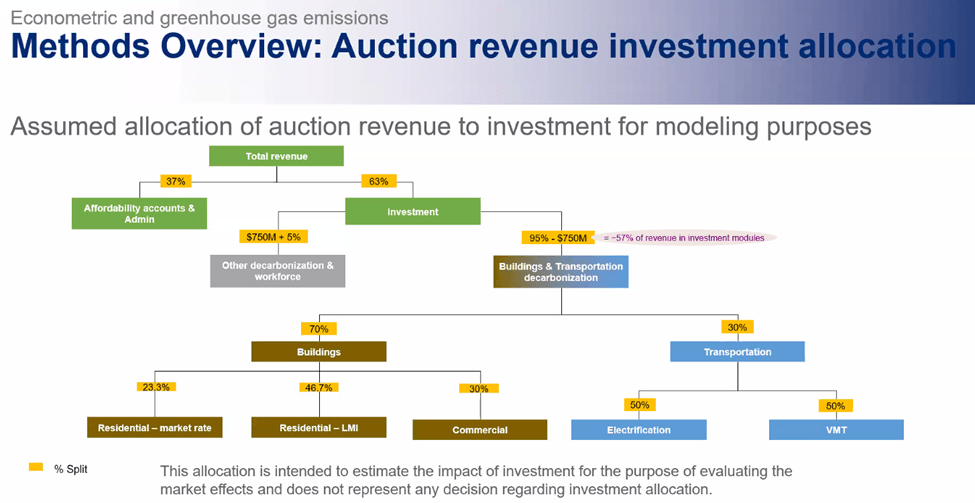
Last year legislation mandated that funds be allocated to the Consumer Climate Action Account (CCAA) as part of the overarching investment framework established for NYCI. As noted in the following slide and explained by Guttman-Britten the first 37% of revenue generated by NYCI auctions is “set aside for the affordability accounts, the Consumer Climate Action Account, the industrial small business climate action account and administrative expenses.” The Consumer Climate Action Account itself is supposed to get 30% of the revenues. Recall that 2030 total revenue is “estimated to be between $6 and $12 billion per year” so the Consumer Climate Action Account should get between $3.3 and $1.5 billion in 2030.
In the summary of the modeling overview Gutman-Britten read the script claiming that NYCI has the ability to effectively manage total costs:
- Initial analysis shows that millions of households would break even after NYCI, especially lower income and low energy use households.
- Although some households, especially high fossil fuel users, are likely to have residual costs after benefits, total cost impacts may be managed for a very large percentage of households.
- In addition to driving emission reductions, NYCI investments are an essential affordability strategy. The program’s support for EV, heat pump, transit, and other related incentives and programs reduces cost exposure for households across New York, with a growing share receiving more benefits than costs.
The analysis relies on the 30% of revenues allocated to the CCAA to offset much of the cost. Insufficient detail was provided in the webinar to evaluate those claims and if the past is any guide there will never be sufficient documentation to verify them. In my opinion this modeling was designed to get specific answers consistent with the Hochul Administration narrative.
Household Impacts
James Wilcox read the script for the Household Impacts discussion. His presentation emphasized the point that these estimates were illustrative examples and not a formal proposal. The following slide is an overview and makes the point that these results are “focused on the impact of NYCI on affordability for low and middle- income households”. Those households are defined as follows:
- Low income is identified as all income bands entirely below 60% of state median annual household income, i.e., below $35,000 for the purpose of this analysis.
- Middle income is identified as the income band that contains the median annual household income in NYS, i.e., $50-75,000 for the purpose of this analysis.
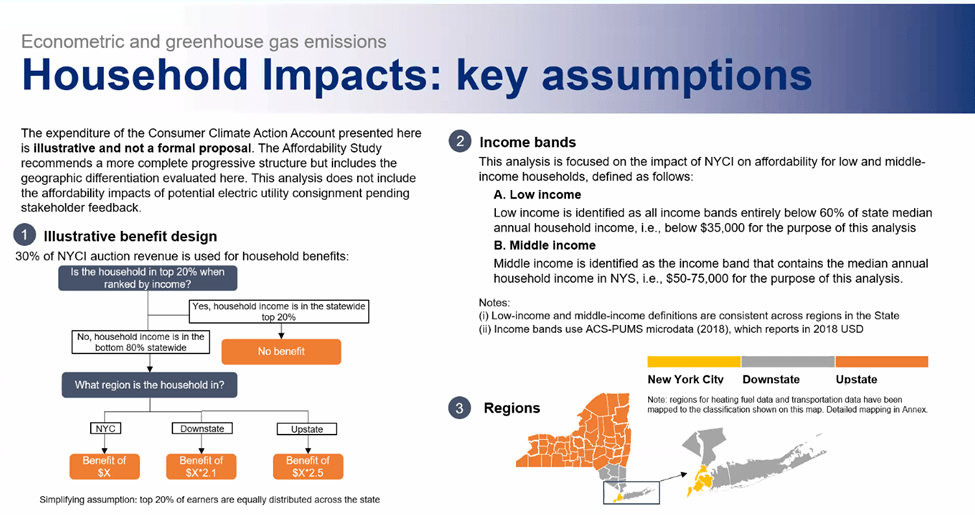
The illustrative benefit design flow chart from the key assumptions slide deserves more discussion especially because if you are like me these numbers have no context. I found an overview of New York household income at Statistical Atlas that included two graphs. I combined data from the income percentiles and webinar income distribution graphs in the following table. The webinar assumes that there will be no benefit for households in the top 20% which according to the table corresponds to an income exceeding $126,900. There are six million households under that threshold which means that 1.5 million households in the top 20% of income will get no benefit. Low-income households are those below $35,000 and there are 2.3 million households in that category. There are 2.1 million households above $35,000 but below $75,000. Middle income is identified as the income band that contains the median annual household income in NYS, i.e., $50-75,000 for the purpose of the NYCI analysis. That leaves 1.6 million households with income between $75,000 and $126,900. No information for expected benefits was provided for this last category. Left unsaid was how the CCAA funds are distributed across these categories.
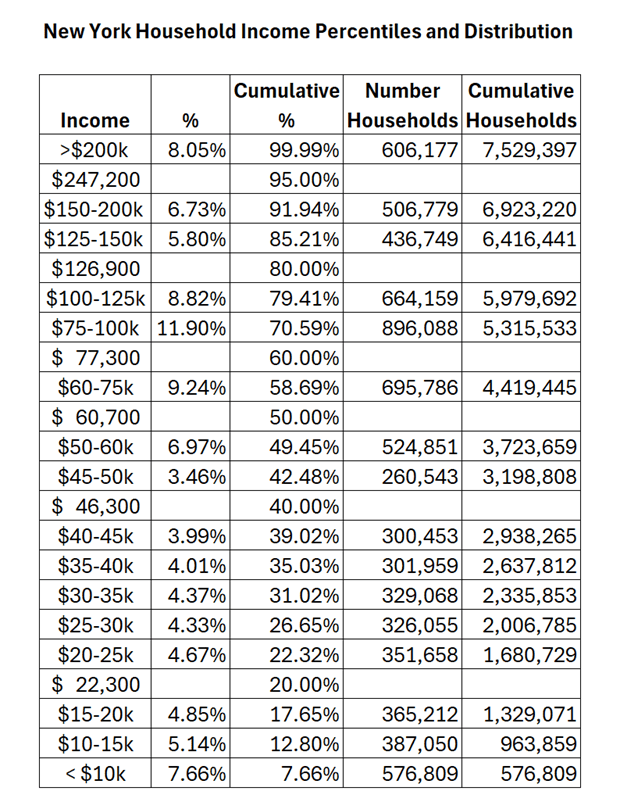
I have not been able to find a reference for the expected CCAA monthly distribution. The household numbers can be used to guess at the distribution. Previously I noted that the CCAA should get between $3.3 and $1.5 billion in 2030. According to this table about six million households are eligible for a CCAA distribution so if every eligible household gets the same share, then the monthly distributions will range between $45 and $21 per month.
The script for the household impacts by type, location, and income slide described the monthly program net impacts for the first year of the program. The title “monthly program net impact” says that the values are netted out from something, but it is not clear what. It is likely that these are net relative to the costs less the CCAA benefit. It is also possible that the values are relative to the Reference Case. However, the Reference Case includes the costs of New York City Local Law 97 and the advanced clean car rule among other things. It is not clear how those could be separated out in the analysis. The net impact costs table is excerpted below.
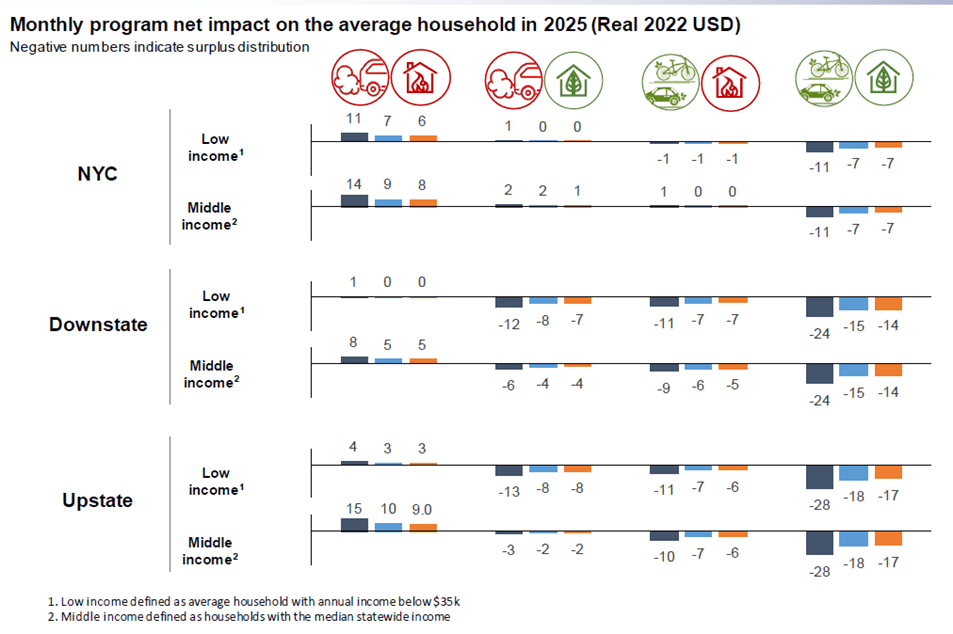
This is a busy slide that describes the monthly net cost impacts. The rows list the regions (NYC, Downstate, and Upstate) including the low- and middle-income household categories. There are four categories of columns. The first column covers households that use gasoline vehicles and heat with fossil fuels. The second column covers households that use gasoline vehicles but use “green” electric heating. One of the unexplained details is whether using electricity for heating was limited to heat pumps or includes resistance heating. The third column is households that do not use gasoline vehicles but use fossil heating. Another detail is whether hybrid vehicles that are not zero-emissions vehicles are considered green. The fourth column is for the small number of households that do not use gasoline vehicles or fossil heat. Within each of those four columns the results for the three allowance scenarios are shown.
The script explanation for the first column stated that:
Depending on the household income level and the part of the state, the cost may range. From as little as $12 a year to up to $180 with net impacts lower under Upstate scenarios B and C.
Infuriatingly, the script description describes annual benefits, but the graph lists monthly values. For example, the Scenario A monthly net cost impact ranges from $1 per month ($12 a year) for Downstate, Low Income to $15 per month ($180 per month) for Upstate, Middle Income. Inconsistent nomenclature makes it difficult to figure out exactly what is proposed.
The script narrative is that as people transition away from fossil fuels people will be financially better off. In the rightmost column for both green alternatives the Scenario A monthly benefits range from $11 to $28 per month or $132 to $336 per year. Presumably this represents an incentive to convert but it is left unsaid whether converting to an EV and a heat pump will cost less than this program benefit.
The script for this concludes that “It’s essential to remember that NYCI investments will be designed to move state households from the right column to the left column.” This appears to be a mis-statement because the left column is all fossil and the right column is all “zero-emissions” so the goal should be opposite direction. The narrative also argues that revenues raised will provide support for households to electrify their homes and cars and the CCAA rebates will be an additional incentive.
Wilcox provides a couple of more slides that break out the household impacts. The following is the second slide that describes the Upstate “middle-income household journey” to decarbonized nirvana as envisioned by this modeling. For a household with two internal combustion vehicles and a home that is not weatherized and uses gas heating the slide describes two decarbonization scenarios: moderate and increased decarbonization. The graphs list the NYCI program impact per month (Real $ 2022) for the net program impact faced by household; increases cost due to NYCI; the surplus benefit; decreased cost for efficient appliances, weatherization, switching one of two cars to an electric vehicle and switching to a heat pump; and program impact covered by differentiated distribution.
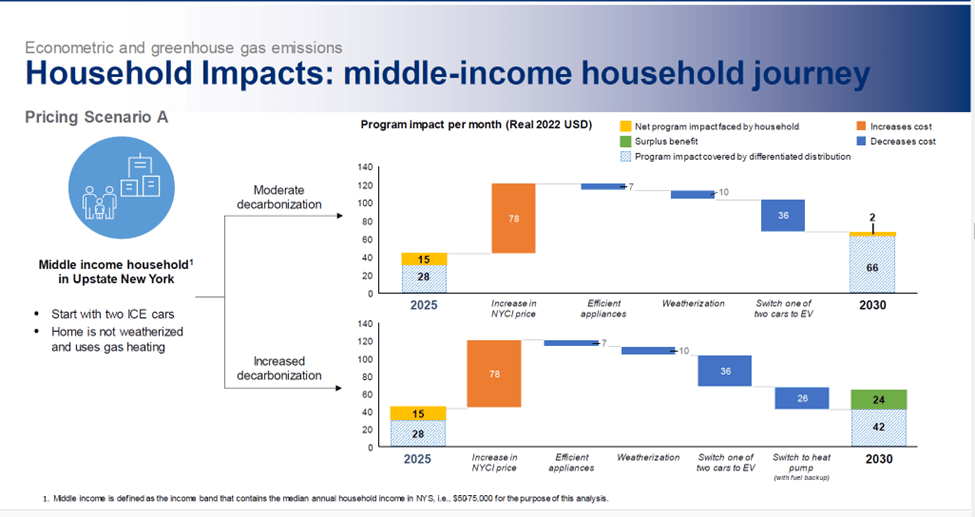
I cannot say that I can fully explain these household impacts values. The script states:
This household sees an initial net cost. The consumer climate action account offsets approximately two thirds of the total NYCI impact.
The increase in NYCI price is $78 which I assume is the total NYCI impact. The sum of the net program impact faced by household ($15) and program impact covered by differentiated distribution ($28) is $43 and that is about two thirds of the total NYCI impact. But the graph states that the net program impact is $15. I cannot figure out what the program impact covered by differentiated distribution represents. Recall that if every eligible household gets the same share the monthly distributions will range between $45 and $21 per month in 2030 but the 2025 estimated revenues were not provided.
The graphic and the script describe the household journey:
However, under a moderate decarbonization journey where this household installs efficient appliances, weatherizes their home, and switches one of the 2 cars to an EV.
They nearly break even. Facing a small net cost of $2 after receiving an illustrative consumer climate action account benefit.
The graphic claims that efficient appliances save $7 a month, weatherizing the home saves $10, and switching one of the 2 cars to an EV saves $36 for a total of $53 in savings per month. In 2030 the sum of the net program impact faced by household ($2) and program impact covered by differentiated distribution ($66) is $68. In this instance the differentiated distribution is described as the “illustrative consumer climate action account benefit” but that estimate is at odds with my calculated CCAA benefits of around $45 per month. This is another inconsistency that I cannot explain.
The script goes on to say:
Again, in addition to NYCI offering direct support for energy affordability, program revenue can be used to reduce the cost to households of investments like residential heat pumps and EVs.
This is an addition, and this applies to both slides to support from federal programs to the Inflation Reduction Act.
While others will see some costs that the consumer climate action count helps to manage. However, taking even moderate steps to decarbonize by 2030 leads to surplus benefits in nearly every region and income level analyzed, while taking increased measures leads to significant surplus benefits across all regions and income levels analyzed.
I have not been able to reproduce these claims. Note that the claim that there are “surplus benefits in nearly every region and income level analyzed” ignores the fact that the 1.6 million households with incomes lower than the no-benefit threshold and above the middle-income $75K threshold are not addressed in their presentation of results.
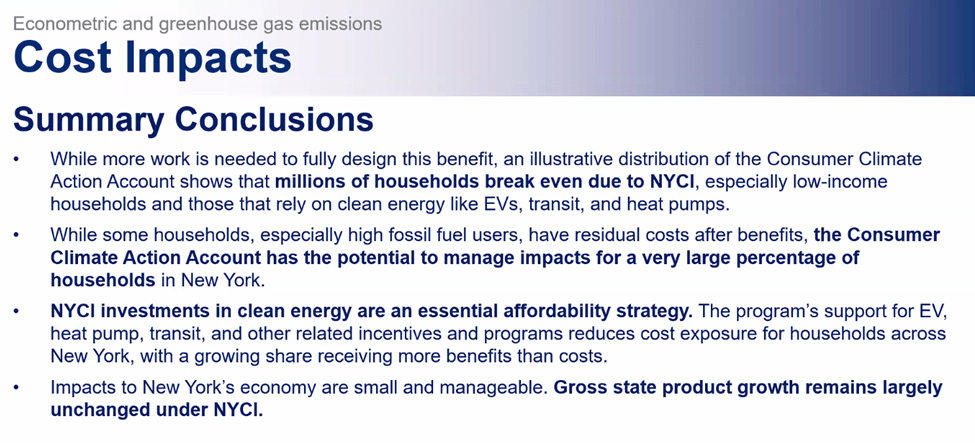
Wilcox summarized the cost impact results in the following slide. The script says that this “illustrative distribution of the Consumer Climate Action Account shows that millions of households break even due to NYCI, especially low-income households and those that rely on clean energy like EVs, transit, and heat pumps.” These are average values. The distribution of impacts that would describe costs for those households that do not have the option for EVs, transit, and heat pumps is not available. The summary claims that the “Consumer Climate Action Account has the potential to manage impacts for a very large percentage of households in New York” but does not quantify that percentage. The modeling analysis notes that the building and transportation sector modeling was custom built. Optimistic implementation assumptions can easily be used to torture the data into the result desired. Without complete documentation I do not think that the results are credible, so I am reserving judgement on these claims.
Discussion
I have always maintained that the primary concern of the general public is Climate Act costs. As far as I can tell the Hochul Administration deliberately hid those costs in the Scoping Plan and that politically motivated approach is apparent in this webinar.
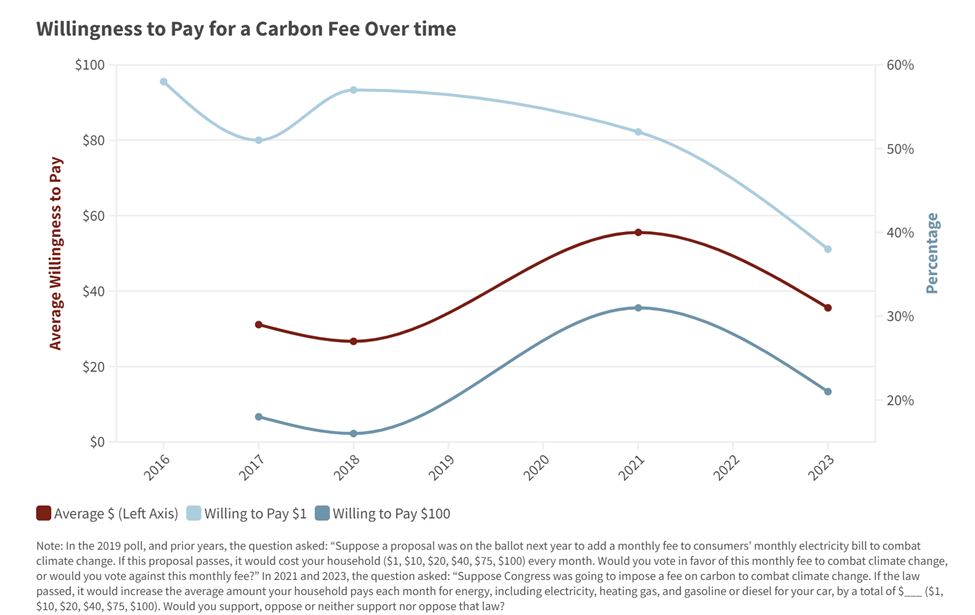
The Energy Policy Institute at the University of Chicago did a poll in early 2023 poll with “the Associated Press–NORC Center for Public Affairs Research” explored Americans’ attitudes on climate change, their views on key climate and energy policies, and how they feel about electric vehicles and the policies to encourage them. The following chart from that report shows that 38% would be willing to pay an additional $1 a month for a fee to combat change and only 21% would be willing to pay $100 a month.
This webinar talked about a single component of the total cost of the net-zero transition. When NYCI starts auctioning allowances the price of energy is guaranteed to go up. The Upstate “middle-income household journey” states that households in that category will pay at least $73 a month before the rebates are applied. The rebates are subject to the whim of Albany politicians, so the rebate amounts are not guaranteed. In addition, the electric bill supply costs are not included in these modeled costs. I recently discussed the Central Hudson revisions to its double-digit gas and electric delivery rate increases. The public outcry has been intense and the costs described here are in addition to the rate case costs. There is insufficient documentation available to determine exactly what costs were included in the heat pump and electric vehicle examples given.
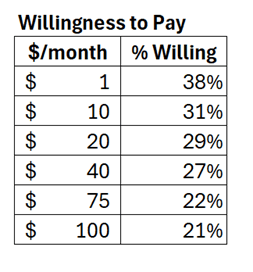
The Energy Policy Institute poll described above found that less than a third of respondents were willing to pay even $10 a month. The willingness to pay at other levels in the poll shows that less than a third are willing to pay as little as $10 a month for a carbon fee. Little wonder that the true costs are a closely guarded secret.
The Climate Action Council’s Scoping Plan has been described as a “true masterpiece in how to hide what is important under an avalanche of words designed to make people never want to read it.” Similarly, the modeling analysis portrayal in this webinar uses an avalanche of technical jargon and impressive sounding phrases to suggest credibility and discourage questions. In reality, all the modeling relies on guessing how society will react to incentives and regulations using parameters that can lead to wildly different results depending upon the biases of the model developer. John von Neumann allegedly summed up the problem with parameters stating that “With four parameters I can fit an elephant, and with five I can make him wiggle his trunk”[1]. In other words, he could develop a mathematical model that described an elephant simply by fudging the parameters. In this instance the model parameters produce the politically correct result that people will, for example, switch to electric vehicles in response to the incentives but don’t account for the many people who have weighed the pros and cons of an electric vehicle and decided never.
Conclusion
“A goal without a plan is just a wish.”, Antoine de St. Exupery. The Scoping Plan should properly be called the Scoping Goals because there is no plan. There has been no accountability for proving that the control strategies proposed are feasible on the schedule mandated by the Climate Act and that the costs of all the components of the energy system that must be changed to achieve the net-zero transition will maintain current standards of affordability. It is just wishing.
[1] Attributed to von Neumann by Enrico Fermi, as quoted by Freeman Dyson in “A meeting with Enrico Fermi” in Nature 427 (22 January 2004) p. 297
