

This is my annual update of electric utility sector emission trends in New York State. The data presented are derived from the Environmental Protection Agency Clean Air Markets Division database.
I am convinced that implementation of the New York Climate Leadership & Community Protection Act (Climate Act) net-zero mandates will do more harm than good if the future electric system relies only on wind, solar, and energy storage because of reliability and affordability risks. I have followed the Climate Act since it was first proposed, submitted comments on the Climate Act implementation plan, and have written over 500 articles about New York’s net-zero transition. The opinions expressed in this article do not reflect the position of any of my previous employers or any other organization I have been associated with, these comments are mine alone.
Overview
The Climate Act established a New York “Net Zero” target (85% reduction in GHG emissions and 15% offset of emissions) by 2050. It includes two electric sector targets: 70% of the electricity must come from renewable energy by 2030 and all electricity must be generated by “zero-emissions” resources by 2040. The Climate Action Council (CAC) was responsible for preparing the Scoping Plan that outlined how to “achieve the State’s bold clean energy and climate agenda.” The Scoping Plan was finalized at the end of 2022. Since then, the State has been trying to implement the Scoping Plan recommendations through regulations, proceedings, and legislation. Not surprisingly, the aspirational schedule of the Climate Act has proven to be more difficult to implement than planned. This article shows that electric sector emissions increased in 2024 relative to 2023.
Electric Generating Unit Emission Trends
Electric generating units report emissions to the Environmental Protection Agency Clean Air Markets Division as part of the compliance requirements for the Acid Raiin Program and other market-based programs that require accurate and complete emissions data. The 2024 emissions data submittal deadline was January 31, and I downloaded the data on 2/3/2025.
The following table lists emissions and operating data since 2009 when the Regional Greenhouse Gas Initiative started. Emissions of CO2, SO2, and NOx are down dramatically over this period.
Table 1: New York State Emissions and Operating Parameter Trends
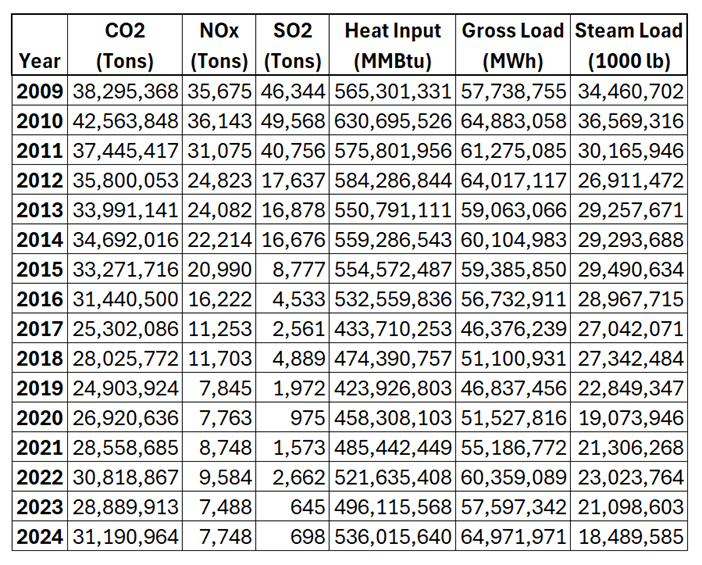
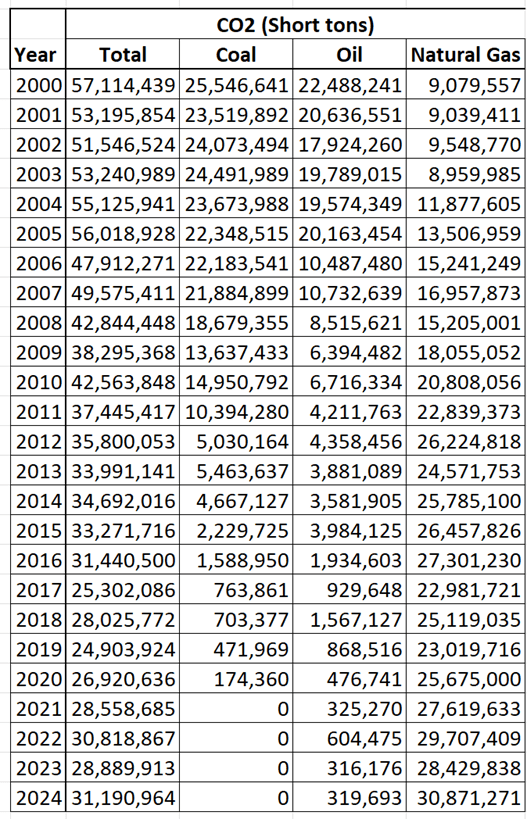
Table 2 lists CO2 emissions by fuel type since 2000. It shows the impact of fuel switching. The primary reason for the observed fuel switching is that the fracking revolution made the cost of natural gas so cheap relative to other fuels that every facility that could convert to natural gas did so. New York banned the use of coal in 2021 which forced the retirement of the remaining coal plants. The state still has some facilities that primarily burn residual oil but those run infrequently. The takeaway message is that the fuel switching options are no longer available so future reductions will only come as zero-emissions resources displace facilities burning fossil fuels.
Table 2: New York State CO2 Emissions by Fuel Type
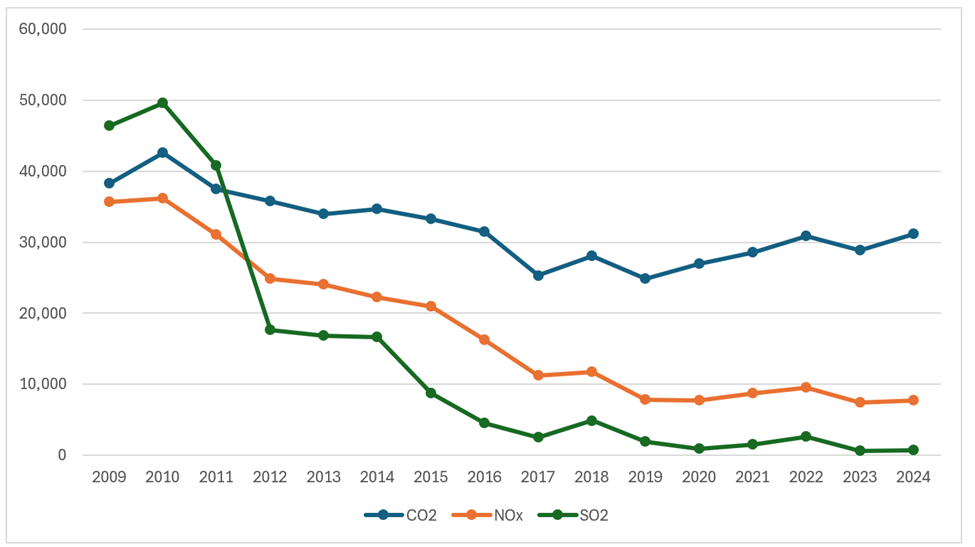
The following graph illustrates emission trends. Note that I divided the CO2 emissions by 1,000 so that all the parameters would show up on the same plot. The impact of the closure of the Indian Point nuclear facility starting in 2020 is clearly shown. CO2 levels in 2024 were nearly as high as the 2016 levels. Inter-annual variability is primarily due to weather variations but the primary reason for the higher CO2 emissions is the closure of Indian Point.
Figure 1: NYS Emission Trends – SO2 (tons), NOx (tons) & CO2 (1000 tons)
New York State GHG Emission Trends
The Climate Act requires the Department of Environmental Conservation to issue an annual report on statewide greenhouse gas emissions. The current report covers the years 1990 through 2022 and was posted late last year. Inexplicably, the emission data are unavailable. When it is available for download from Open Data NY I will update this summary to include GHG emission trends.
Discussion
New York has significantly reduced pollution emissions from the electric sector. However, the reductions were due to fuel switching to natural gas. There are two implications. There are no more significant opportunities to reduce emissions via fuel switching. That means New York State must provide the emission reductions by investments in zero-emissions technology that can displace existing generation. New York’s policy decisions for emission reductions have been poor to date. The natural gas fuel switching was driven by the economics of fracking natural gas which drove prices down elsewhere but not in New York because fracking is prohibited. The other emissions policy error was the closure of Indian Point. According to the 2024 data, that decision set back emissions progress by years.
Conclusion
When you look at the numbers shown in this post, the enormity of the emissions reduction challenge is clear. The Climate Act has been in place for five years. The crash program to replace fossil fuels with wind and solar has shown no sign of emission reduction success.
