

A version of this article was published at Watts Up With That
In October 2023 an article of mine was published that addressed the wind is always blowing somewhere fallacy used by green energy proponents to argue that large amounts of storage and any new dispatchable emissions-free resources are not necessary in a future electric system that relies on wind and solar generating resources. I recently discovered the US Energy Information Administration Hourly Electric Grid Monitor that provides hourly net generation by energy source for the Lower 48 states. This article describes 2024 energy source data with an emphasis on wind energy relative to the “wind is always blowing somewhere” claim.
I am convinced that implementation of the Climate Act net-zero mandates will do more harm than good if the future electric system relies only on wind, solar, and energy storage because of reliability and affordability risks. I have followed the Climate Act since it was first proposed, submitted comments on the Climate Act implementation plan, and have written over 500 articles about New York’s net-zero transition. The opinions expressed in this post do not reflect the position of any of my previous employers or any other organization I have been associated with, these comments are mine alone.
Overview
The Climate Act established a New York “Net Zero” target (85% reduction in GHG emissions and 15% offset of emissions) by 2050. Two targets address the electric sector: 70% of the electricity must come from renewable energy by 2030 and all electricity must be generated by “zero-emissions” resources by 2040. The Climate Action Council (CAC) was responsible for preparing the Scoping Plan that outlined how to “achieve the State’s bold clean energy and climate agenda.” The Scoping Plan was finalized at the end of 2022. Schussler’s article is relevant because the Scoping Plan proposes to meet the zero-emissions mandate using wind, solar, and energy storage. In 2040, the Scoping Plan projected that39% of the electric energy would be provided by wind generation and 30% by solar.
Wind Lulls
CAC member Dr. Robert Howarth claims that he played a key role in the drafting of the Climate Act and his statement at the meeting where the Scoping Plan was approved claims that: ”A decade ago, Jacobson, I and others laid out a specific plan for New York (Jacobson et al. 2013). In that peer-reviewed analysis, we demonstrated that our State could rapidly move away from fossil fuels and instead be fueled completely by the power of the wind, the sun, and hydro. We further demonstrated that it could be done completely with technologies available at that time (a decade ago)”. More recently, Mark Jacobsen of Stanford acknowledges that wind intermittency is a challenge but claims that it can be simply addressed by developing interconnections, a mix of renewable energy sources, including wind, water, and solar, and implementing energy storage solutions. The question addressed here is the extent of the interconnections needed to get to the wind blowing somewhere from New York
In the real world most analysts are not claiming that there is a simple solution to extended periods of low wind and solar resources. In September Parker Gallant noted that industrial wind turbines (IWT) in Ontario “show up at the party, almost always, after everyone has left” in a post that described poor performance of the province’s wind turbines over a five day period in September 2024. I evaluated the performance of New York’s 2,454 wind turbine fleet and found that there was an hour when the total generation was 0.2 MW during this September event. David Theilen directly addressed the wind is always blowing somewhere argument with this graph using data from the US Energy Information Administration Hourly Electric Grid Monitor.

Figure 1: US Energy Information Administration Hourly Electric Grid Monitor December 2024
EIA data
I used the data dashboard at the US Energy Information Administration Hourly Electric Grid Monitor as the source of the hourly 2024 generation by energy source data used in this analysis. EIA notes that this is “Hourly total net generation and net generation by energy source for the Lower 48 states.” The settings widget enables a user to change the time and period albeit hourly data are only available for up to 31 days, so I had to import data by month. There is another issue. January generation categories included Wind, Solar, Hydro, Unknown, Other, Petroleum, Natural Gas, Coal, and Nuclear. December generation categories changed to Battery storage, Solar with integrated battery storage, Pumped storage, Unknown energy storage, Wind, Solar, Hydro, Unknown, Other, Petroleum, Natural Gas, Coal, and Nuclear. I made no attempt to account for the different categories when I downloaded the data.
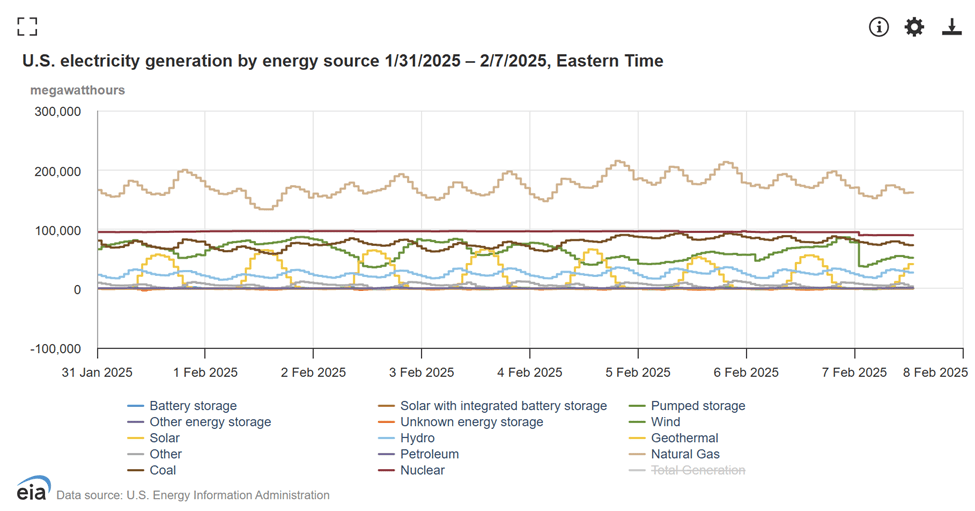
Figure 2: US Energy Information Administration Hourly Electric Grid Monitor
I wanted to show the installed capacity for the different energy sources but I was only able to find EIA values for solar – 107,400 MW. Figure 3 shows the Maximum Hourly Generation (MW) in 2024 for the primary energy source categories that gives an idea how much capacity is installed for each energy source. Note the maximum solar is 75% of the EIA installed capacity. I expect the percentage of installed wind relative to the observed maximum hourly MW would be even less.
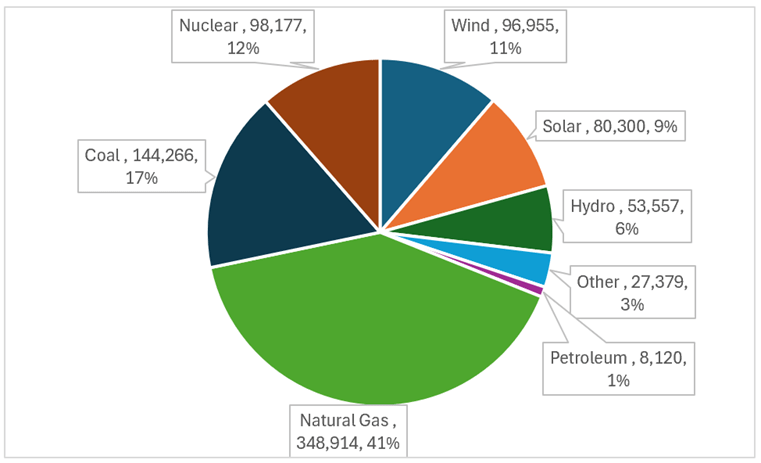
Figure 3: US Energy Information Administration Hourly Electric Grid Monitor 2024 Maximum Hourly Generation (MW)
Figure 4 lists the US Energy Information Administration Hourly Electric Grid Monitor 2024 Total Energy (GWh). I was frankly surprised how much wind capacity was generated on an annual basis. However, totals and averages are not the primary planning issue – determining how much energy is needed in the worst case is a prerequisite for reliability planning.

Figure 4: US Energy Information Administration Hourly Electric Grid Monitor 2024 Total Energy (GWh)
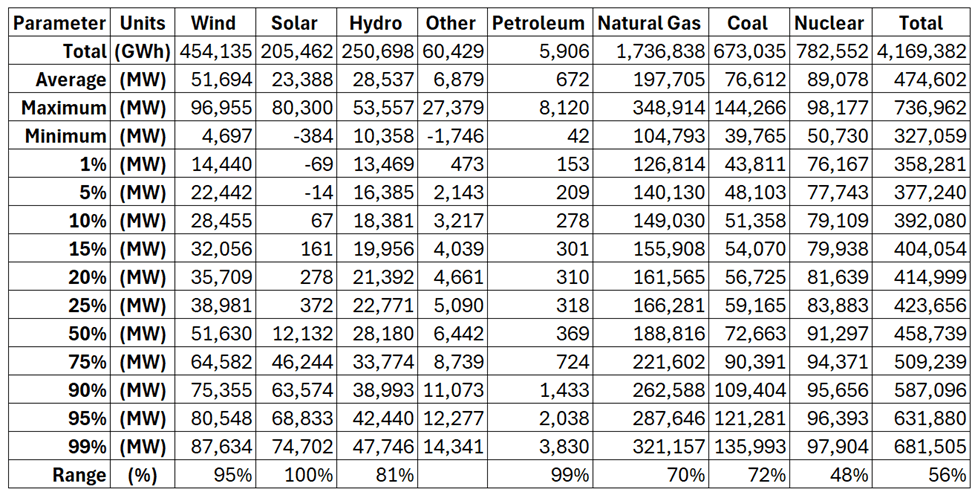
Table 1 summarizes nationwide energy source hourly data for 2024. Solar has the most hourly variability because it is unavailable at night. Wind has 95% variability and petroleum that is used for peaking purposes has 99% variability. Only nuclear has less variability than the total energy. The distribution of wind energy hourly output is notable.
Table 1: US Energy Information Administration Electric Grid Monitor 2024 Hourly Data Distribution
For a general idea of the variability of the wind resource across the Lower 48 consider Figure 5 a graph of annual hourly data.

Figure 5: US Energy Information Administration Hourly Electric Grid Monitor 2024 Hourly Wind Energy Production (MW)
I could not find a map of wind energy facilities at the EIA website. Synapse Energy has developed an interactive map of U.S. power plants, including wind facilities which is shown as Figure 6.
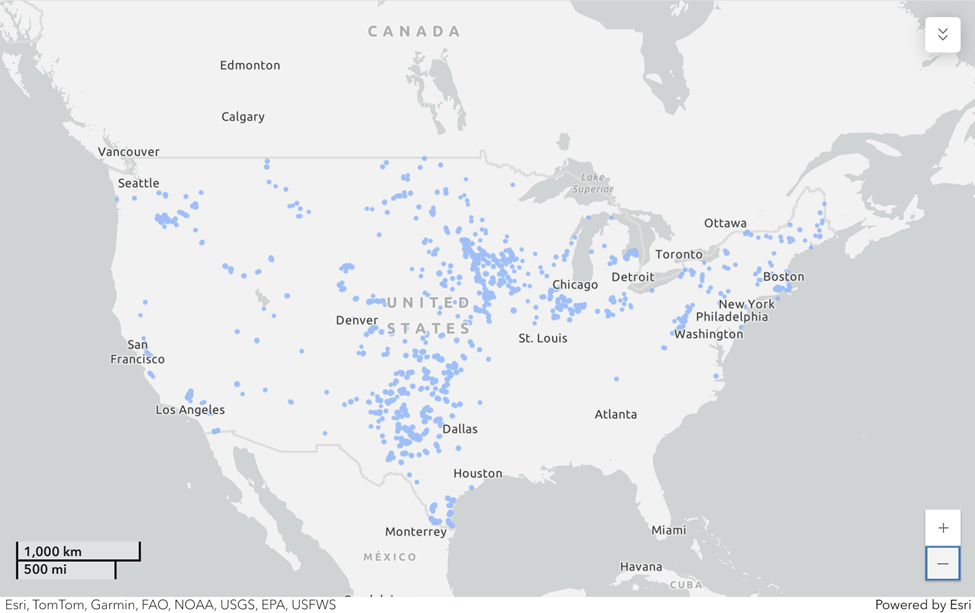
Figure 6: Synapse Energy Map of U.S. Wind Power Plants
Assuming that the EIA wind energy facilities are similar to those used by Synapse Energy, it is clear that there is a wide spatial distribution across the Lower 48. Consider that if a wind lull in New York City was caused by a high-pressure system that covers everything east of the Mississippi that dedicated transmission to dedicated wind turbines 1,000 miles away would be required to ensure that New York State wind energy could be supplanted by wind elsewhere. In the next step I analyzed temporal variation.
Table 2 provides an estimate of wind lulls at different thresholds. I evaluated the hourly data to determine the total available wind energy (GWh) available when the total available wind capacity was less than six percentile thresholds. At the first percentile only 14,440 MW or less was generated. This level is 15% of the maximum observed hourly wind capacity. There were 14 episodes that met this threshold and total energy generated during those periods was 988 GWh. From a planning standpoint the maximum duration is important. There was a 14-hour period when all the Lower 48 wind facilities produced less than 15% of the maximum observed capacity and the total energy generated was only 29 GWh which is only 2% of the capability over that period. At the 25th percentile, all the wind facilities produced 40% of the maximum observed capacity. There were 180 episodes that met this threshold and total energy generated during those periods was 63,430 GWh. For the maximum duration there was a 115-hour period when all the Lower 48 wind facilities produced less than 40% of the maximum observed capacity and the total energy generated was 2,319 GWh which is 21% of the capability over that period.
Table 2: US EIA Electric Grid Monitor 2024 Hourly Wind Lulls

Discussion
It is a stretch to try to extrapolate these data for planning purposes to determine the resource gap for a specific area. A sophisticated analysis that addresses the location of the wind facilities, the interconnections between the facilities, and the generation from other resources on an hour-by-hour basis is required. Nonetheless, using the data to guess the impacts is instructive.
To take advantage of the wind blowing somewhere argument it would be necessary to upgrade the transmission system. Assuming that transmission is available there is still a clear need for backup energy. If the entire wind energy system would need to produce 50% of the maximum observed capacity to cover both local and distant energy needs note that this analysis found that 25% of the time only 40% of the maximum was available. The worst case was a 115-hour period when all the Lower 48 wind facilities produced only b2,319 GWh of a possible 11,150 GWh. Assuming 50% of the maximum is needed to support the system there would be an energy gap of 3,256 GWh over this 115-hour period. At a cost of $148/kWh to $400/kWh the storage needed for this event would be $482 to $1,302 billion.
Recently, Russ Schussler (the Planning Engineer) published an article that argued that the intermittency issue addressed here might be solvable: “The long-term problems associated with wind and solar due to their intermittency could and may likely be made manageable with improved technology and decreasing costs.” In my opinion, practically speaking it is not possible. It would be necessary to upgrade the electric transmission system, deploy short-term storage, and develop and deploy a dispatchable emissions-free resource all to address short and infrequent periods and to somehow finance those resources with those constraints.
Importantly, even if intermittency can be addressed Schussler argues that there is a fatal flaw:
Overcoming intermittency though complex and expensive resource additions at best gets us around a molehill which will leave a huge mountain ahead. Where will grid support come from? Wind, solar and batteries provide energy through an electronic inverter. In practice, they lean on and are supported by conventional rotating machines. Essential Reliability Services include the ability to ramp up and down, frequency support, inertia and voltage support. For more details on the real problem see this posting. “Wind and Solar Can’t Support the Grid” describes the situation and contains links to other past postings provide greater detail on the problems.
Conclusion
Green energy advocates who minimize the challenge of transitioning the electric grid to wind and solar rely on the claim that the “wind is always blowing somewhere”. The 2024 wind energy data suggest otherwise. I have no doubt that a proper electric reliability resource planning analysis would verify that my intermittency concerns are real and that revolving the issues would be prohibitively expensive. Coupled with the grid support issues, the green dream of a wind and solar electric generating system is a fantasy that will never be viable.
