

The New York Draft State Energy Plan prepared by the New York State Energy Research & Development Authority (NYSERDA) is currently out for comments. This is one in a series of posts describing my concerns about the Health Benefits chapter that I am planning to consolidate and submit as a written comment. This post puts the benefit claims in context with the observations.
I am convinced that implementation of the New York Climate Leadership & Community Protection Act (Climate Act) net-zero mandates will do more harm than good if the future electric system relies only on wind, solar, and energy storage because of reliability and affordability risks. The primary emphasis of my career was air pollution meteorology and air quality analysis which is the focus of my planned comments. I have followed the Climate Act since it was first proposed, submitted comments on the Climate Act implementation plan, and have written over 575 articles about New York’s net-zero transition. The opinions expressed in this article do not reflect the position of any of my previous employers or any other organization I have been associated with, these comments are mine alone.
Net-Zero Aspirations
The Climate Act established a New York “Net Zero” target (85% reduction in GHG emissions and 15% offset of emissions) by 2050 and has two electric sector targets: 70% of the electricity must come from renewable energy by 2030 and all electricity must be generated by “zero-emissions” resources by 2040.
According to the New York State Energy Plan website: “The State Energy Plan is a comprehensive roadmap to build a clean, resilient, and affordable energy system for all New Yorkers.” This is the first update of the Energy Plan since the Climate Act was passed in 2019, so it is being revised to incorporate the net-zero mandates. I have provided more background information and a list of previous articles on my Energy Plan page.
Health Benefit Chapter Comments
I am drafting the components of my planned written comments in a series of posts. The first post described my oral comment at the virtual Draft State Energy Plan Public Hearing on September 13, 2025. I noted that NYSERDA is using a new modeling approach to project the air quality impacts associated with Climate Act implementation that are used to determine health benefits. Although they claimed that they had validated the approach, the methodology used was invalid, thus undermining the credibility of all the health benefits claims.
The crux of the NYSERDA health benefit claim is that various health effects are exacerbated by air pollution. If that is true, then observed inhalable particulate matter (PM2.5) should correlate with observed health outcomes. In my second post I compared observations of the same metrics cited in the Health Benefits chapter. I found no observed relationship between annual average PM2.5 and emergency room visits related to asthma for the New York State monitoring stations used.
Air Quality and Health Impact Context
One of the key findings in the Health Benefits chapter states:
All communities in New York State would experience public health benefits as a result of implementing State energy policies that would substantially reduce air pollutant emissions relative to the No Action scenario and therefore lower pollutant concentrations. As a result of policies in the Draft Plan’s core planning scenario, Additional Action, population-level health risks associated with exposure to air pollutants would be lower, including cumulatively from 2025–2040 reducing premature mortality by approximately 9,700 cases, along with an estimated 4,100 fewer nonfatal heart attacks and nearly 12,500 fewer emergency room visits for asthma, and further improvements in other metrics. Under all planning scenarios, health benefits are expected to increase over time from 2025 to 2040 and continue beyond 2040.
There is no question that reducing air pollutant emissions will provide health benefits but the relationship is complex, and in my opinion usually exaggerated. My comments address whether the claimed asthma emergency room visit health benefits from the inhalable particulate air pollution improvements related to Climate Act implementation are credible. Claimed public health effects are listed in Table 2 of the Draft Energy Plan Health Effects chapter. I address the avoided emergency room visits due to asthma benefits which range from 1,100 to 3,600 fewer cases per year.
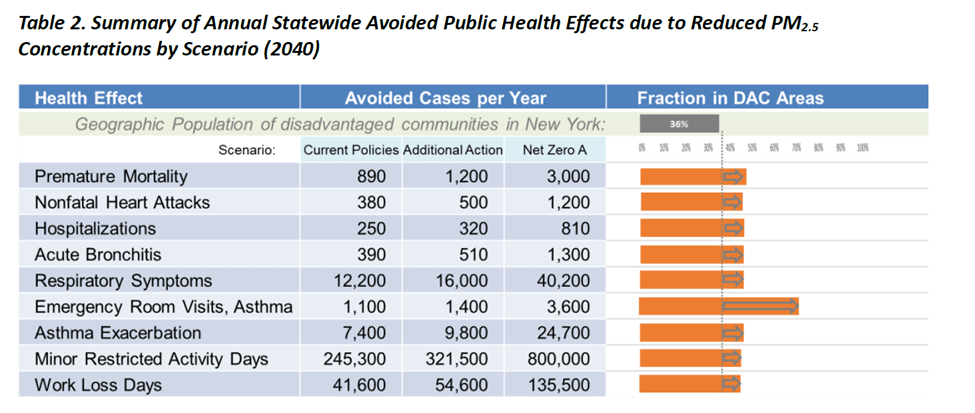
Source: Draft Energy Plan Health Effects Chapter
This analysis compares the emergency room visits due to asthma health effect relative to observed data. As documented in my previous post the New York State Department of Health (NYSDOH) New York State Asthma Dashboard provides these data. The Asthma Dashboard provides state-level data for 11 indicators in the “asthma emergency department visits” component. There is an export function tab on the Main State Dashboard that I used to download a file with state-level data in the Asthma dashboard to the “Asthma Data Dashboard – State” tab in my AD-State Trend Data RC spreadsheet. I extracted the asthma emergency department data in the “Data” tab. Note that no data were reported for 2015. The “Summary” tab describes the data. Table 1 lists the annual asthma emergency room visits for different age groups. All my analyses used the total asthma emergency department visits. Of particular interest note that the Covid Pandemic changed the identification of asthma. In my opinion, limiting the comparison data from 2009 to 2019 would be more representative of an actual relationship.
Table 1: NYSDOH New York State Asthma Dashboard Asthma Emergency Department Visits
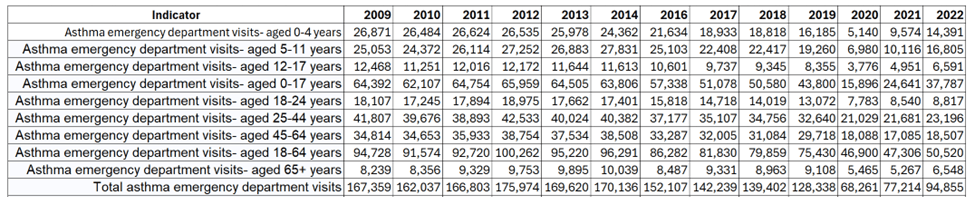
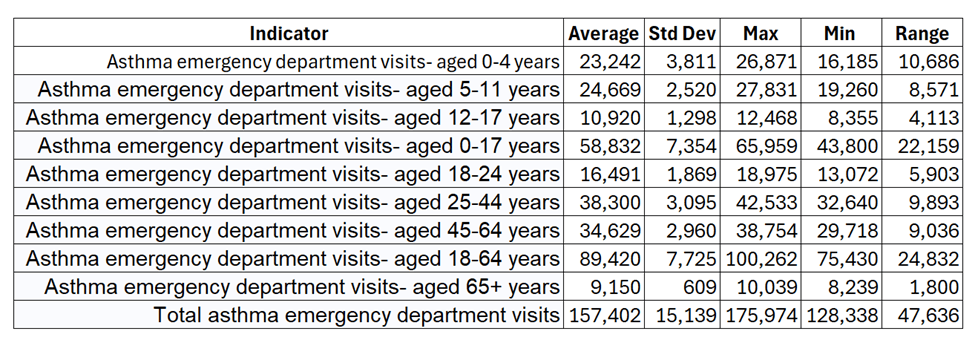
Table 2 lists some simple statistics describing these data for the entire data record. NYSERDA modeling claims that avoided emergency room visits due to asthma improve from 1,100 to 3,600 cases per year. The range between maximum and minimum annual emergency room visits over all 13 years of available data is 107,713. Importantly, the improvement of 3,600 avoided emergency room visits is 10% of the standard deviation and 3.3% of the range of observed emergency room visits. I believe the predicted improvement is a negligible fraction of the observed emergency room visit variation.
Table 2: NYSDOH Asthma Dashboard Asthma Emergency Department Visits Statistics 2009-2022

Emergency room asthma reporting changed in 2020 due to Covid. Because this changed the reporting metric, I re-ran the statistics for the data available from 2009 to 2019. Table 3 lists the same statistics describing these data for that period. The range of emergency room visits over all 10 years of data before Covid is reduced to 47,636. The maximum number of avoided emergency room visits is 24% of the standard deviation and 7.6% of the range of observed emergency room visits. Even with this data set, the predicted improvement is a small fraction of the observed emergency room visit variation.
Table 3: NYSDOH Asthma Dashboard Asthma Emergency Department Visits Statistics 2009-2019
Societal Value
The Draft Energy Plan health benefits chapter includes a section on societal value. The introductory paragraph notes: “The public health benefits from reductions in air pollutant concentrations described above are also evaluated as a monetized societal value that can be combined into a single metric to evaluate and compare total public health benefits.” The final key finding states: “The combined societal value of the public health benefits from reductions in PM2.5 and ozone concentrations from 2025 to 2040 is estimated to be nearly $65 billion for Additional Action (net present value 2024$)”. This section puts the societal values in context.
First, I want to make a general point about NYSERDA documentation. Jim Shultz described the Scoping Plan as “a true masterpiece in how to hide what is important under an avalanche of words designed to make people never want to read it.” That extends to the spreadsheet documentation. In my opinion, spreadsheet documentation should be provided for every graph in the document. That is not the case. My tables in this section include numbers derived by interpolating numbers off graphs. In my jaded opinion, NYSERDA is hiding important but inconvenient numbers by not providing the numbers directly.
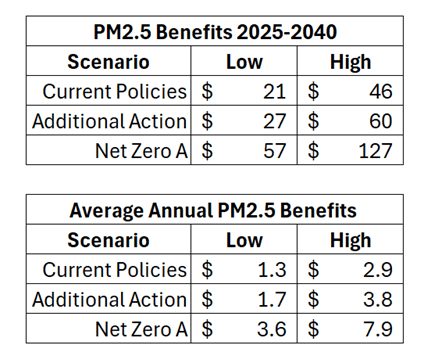
Figure 11 shows the estimated public health benefits for 2025–2040 (net present value 2024$) from reduced PM2.5 concentrations under each scenario relative to the No Action scenario. Table 4 lists the PM2.5 net present values for the different scenarios shown on the Health Benefits chapter figure. To compare the Health Benefits chapter benefits to the air pollution reductions I calculated the average annual benefit by dividing the total by the number of years in the range 2025-2040. The NYSERDA annual societal benefits range from $1,3 billion for the Current Policies scenario low end estimate to $7.9 billion for the Net Zero A scenario high end estimate. The aforementioned $65 billion total benefit claim is over 16 years for the Additional Action scenario.

Source: Draft Energy Plan Health Effects Chapter
Table 4: PM2.5 Net Present Value (Billions 2024$) Derived from Figure 11
Health Benefits chapter Figure 4 presents the population-weighted average PM2.5 concentration reductions by scenario relative to the No Action Scenario, 2040 (μg/m3). Table 5 lists the interpolated concentration values I estimated from the graph.
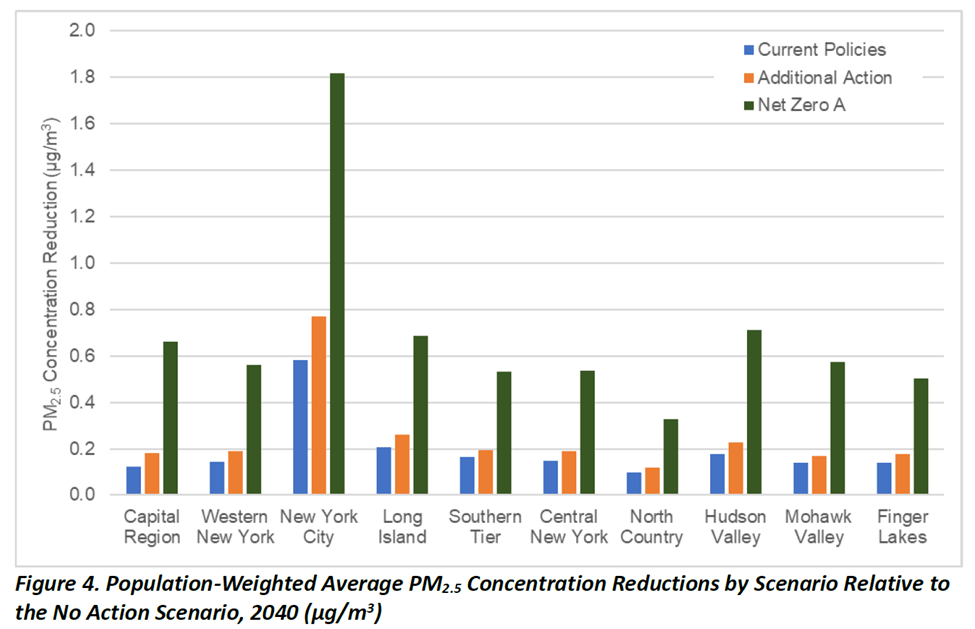
Source: Draft Energy Plan Health Effects Chapter
Table 5: Population-Weighted Average PM2.5 Concentration (μg/m3) Reductions by Scenario
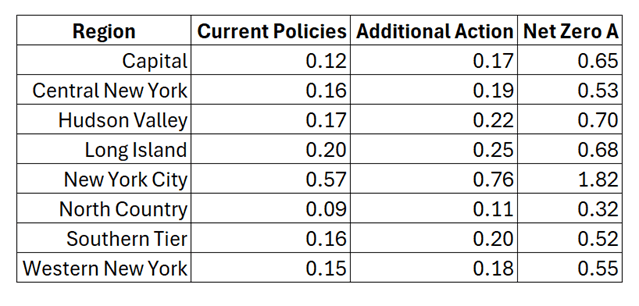
Table 6 lists the observed (2017-2022) inhalable (PM2.5) particulate matter concentration data included in the Appendix to the Health Benefits chapter. I calculated the average, standard deviation, and range for each monitor and for the regions used in the chapter.
Table 6: Observed (2017–2022) PM2.5 Concentrations (μg/m3) in New York State

The point of this exercise is to compare the predicted concentrations with the observed concentration variations (Table 7). The average predicted concentration reduction for all three scenarios is less than the range of observed annual concentrations. This means that the predicted reductions are within the range of inter-annual variation. I therefore conclude that is not a significant impact.
Table 7: Population-Weighted Average PM2.5 Concentration Reductions by Scenario Compared to Observed PM2.5 Concentrations

There is another point of emphasis. The Health Benefits chapter claims annual benefits of $7.9 billion for emission reductions of up to 1.8 μg/m3. Although the lack of detail precludes a refined valuation, note that the observed interannual variation exceeds the largest predicted concentration reduction. If the NYSERDA modeling is correct, then the societal benefits should be observable in the observed annual variation of societal costs. To prove this is an appropriate approach, NYSERDA should document the observed benefits and how they vary with observed pollution concentrations.
Discussion
The Public Health Impacts Overview states “The draft analysis shows that implementation of State energy policies would continue to provide substantial public health benefits throughout the State in all communities, with the greatest benefits realized in disadvantaged community areas.” I do not assert this analysis disproves NYSERDA’s claim of substantial public health benefits . However, I do conclude that NYSERDA justification of their claim for ”substantial public health benefits” has not been adequately justified.
The rationale to reduce fossil-fired emissions because of the relationship between inhalable particulates and asthma is touted in this analysis and is commonly used in other emission reduction proposals. This analysis shows that when the NYSERDA numbers are compared to observations, that observed interannual variations exceed the projected changes in PM2.5 concentrations and number of avoided emergency room visits related to asthma. If these claims are accurate and substantive, then the societal benefits claims should also be observed. In the absence of any data, I believe that the only value of these efforts is to feel good about an emission reduction. They are not substantive enough to claim that the net-zero transition is providing health benefits that justify the enormous costs of the proposed emission reductions.
Conclusion
My recent posts address three shortcomings of the NYSERDA analysis of health benefits of the net-zero transitions. NYSERDA used a new procedure to estimate health impacts that needs to be validated but the alleged verification process was fatally flawed. One of the key health concerns is the effect of inhalable particulates on asthma related emergency room visits but there is no observed relationship between annual average PM2.5 and emergency room visits related to asthma for the New York State monitoring stations used in the NYSERDA analysis. This post shows that the predicted impacts on emergency room visits, and inhalable particulate air quality reductions are within the range of observed variations. This means that the impacts do not justify the investments.
