Rebecca Lewis has posted two City and State articles that found that the Hochul Administration recognizes that the Climate Leadership & Community Protection Act (Climate Act) is so expensive that the Governor will propose changes to the Climate Act to reduce the costly clean energy transition.
In the first article she explains that state budget director Blake Washington described the cost burdens of the green energy requirements on average New Yorkers as “own goals” at the Citizens Budget Commission breakfast on 2/25/26. This apparently precipitated an update on the “likely costs of CLCPA compliance” documented in a memo dated Feb. 26 that Lewis notes “lays out average costs to New Yorkers by 2031 under a hypothetical cap-and-invest system that would be necessary to meet the emissions benchmarks laid out in the Climate Act.” This memo references my work that suggests that even these costs are underestimated.
I am convinced that implementation of the Climate Act net-zero mandates will do more harm than good if the future electric system relies only on wind, solar, and energy storage because of reliability and affordability risks. I have followed the Climate Act since it was first proposed, submitted comments on the Climate Act implementation plan, and have written over 600 articles about New York’s net-zero transition. The opinions expressed in this article do not reflect the position of any of my previous employers or any other organization I have been associated with, these comments are mine alone.
Overview
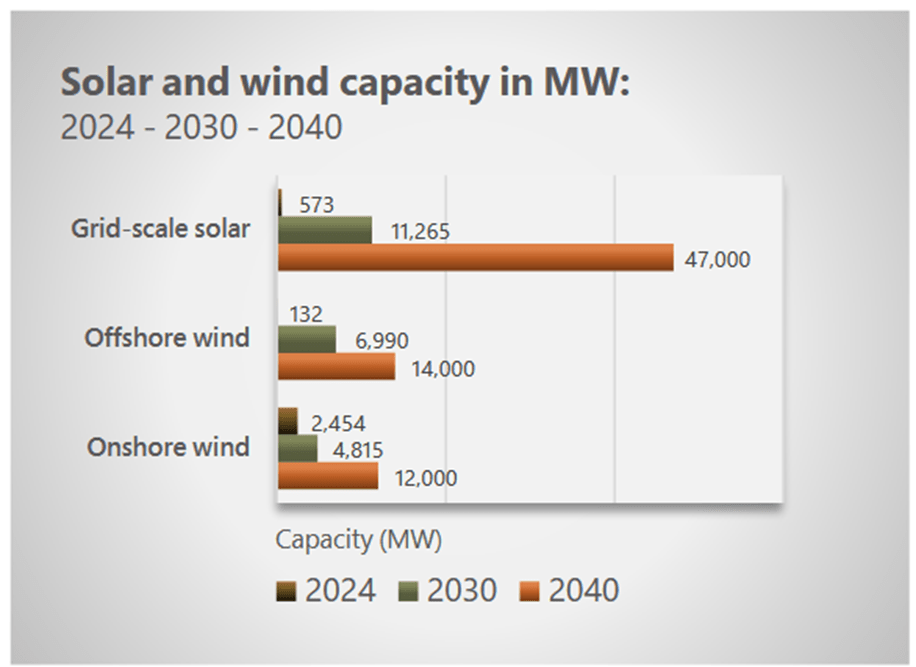
The Climate Leadership & Community Protection Act (Climate Act) established a New York “Net Zero” target (85% reduction in GHG emissions and 15% offset of emissions) by 2050. Among its interim 2030 targets is a reduction target of 40% less GHG emissions and a 70% renewable energy electricity mandate.
My recent article describing current Climate Act issues described some of the issues raised. I explained that there are significant Climate Act issues that can no longer be ignored. Most targets are behind schedule, and the increased costs of the Climate Act will exacerbate the existing energy affordability crisis. DEC needs to respond to the New York Cap-and-Invest (NYCI) economy wide emission reduction initiative requirements and will have to eventually respond to the litigation saying that the State must implement the regulations or amend the law. PSC must also address the safety valve provisions of Publc Service Law 66-P.
These latest revelations are nothing more than acknowledgement of reality.
Budget Director Remarks
In the first article, Lewis describes remarks made by Hochul’s Budget Director at the Citizens Budget Commission breakfast on 2/25/26. Her article states:
Blake Washington called the Climate Leadership and Community Protection Act “well-intentioned,” but said circumstances had changed since former Gov. Andrew Cuomo signed the law in 2019. “Sometimes you can change governmental rules to just fit the times and actually adapt to the realities, the realities before us, not how we wish them to be,” Washington said. He added that the estimated average cost to New Yorkers of the energy transition under current rules comes to roughly $3,000, a number the governor finds “unacceptable.”
Lewis noted:
Speaking to City & State after the CBC breakfast, Washington said state officials must have “honest conversations” about the goals currently in place the state must meet. “It’s important that we highlight the inequities that are before us,” Washington said. “If you were to follow the current law … follow the goals, you’re looking at upwards of $1.90 extra at the pump, which is not something the governor’s willing to tolerate.”
Washington strongly implied the governor wants to include changes to the climate law as part of the budget, though he stopped short of stating so explicitly and didn’t say when she would release her proposal. The executive chamber didn’t include the potential policy reforms as part of Hochul’s 30-day budget amendments, which are typically where a governor introduces new items they wish to negotiate.
Clearly, the Hochul administration is going to do something regarding the Climate Act.
NYSERDA Cost Memo
In the second article Lewis described the contents of a NYSERDA memo from President and CEO of the New York State Energy Research & Development Authority Doreen Harris to Jackie Bray, Director of State Operations. This appears to update some of the numbers that Washington quoted the day before. Lewis notes also that Hochul commented on the cost issues in an unrelated press conference at the same time the memo was released.
Gov. Kathy Hochul suggested on Thursday that the cost of fully complying to the state’s climate law could cost average New Yorkers up to $3,500 each. A new memo shared with City & State from the New York State Energy Research and Development Authority places the estimated cost for upstate gas and oil households even higher.
Lewis also notes that the memo emphasizes affordability concerns:
“If fully implemented with regulations to meet the 2030 targets, CLCPA’s original design – differing accounting standards from the internationally-accepted approach and inflexible near-term targets – would combine to yield high costs to New York households and businesses,” the memo reads. “Addressing this cost escalation is essential to deliver a policy that supports affordability and economic competitiveness and is necessary to ensure continued progress on decarbonization policy.”
She explains the ramifications and hints that there will be changes in the law:
“If fully implemented with regulations to meet the 2030 targets, CLCPA’s original design – differing accounting standards from the internationally-accepted approach and inflexible near-term targets – would combine to yield high costs to New York households and businesses,” the memo reads. “Addressing this cost escalation is essential to deliver a policy that supports affordability and economic competitiveness and is necessary to ensure continued progress on decarbonization policy.”
I was particularly interested in the cost impacts described.
Absent changes, by 2031, the impact of CLCPA on the price of gasoline could reach or exceed $2.23/gallon on top of current prices at that time; the cost for an MMBtu of natural gas $16.96; and comparable increases to other fuels. Upstate oil and natural gas households would see costs in excess of $4,000 a year and New York City natural gas households could anticipate annual gross costs of $2,300. Only a portion of these costs could be offset by current policy design.
The assumptions are not available. However, the memo states “The estimated allowance price would begin in the neighborhood of $120/ton and rise to $179.80/ton by 2031 in real terms.” I believe that the analysis assumes that NYCI is implemented such that the modeling forces compliance with the 2030 emission reduction target by not putting limits on the cost of allowances. (As an aside, that presumption assumes that high allowance prices will force emission reductions which is a stretch and topic for another post.)
The memo concludes
Current CLCPA targets escalate costs for New Yorkers as a result of a combination of factors. Primarily, the greenhouse gas accounting approach incorporated in statute and regulation, in combination with current emission reduction targets, mean that current law attributes higher emissions to New York than other leading jurisdictions do for the same activity, as well as higher emissions than under accepted science. This includes emissions from out-of-state fossil fuel production, which is not incorporated in jurisdictional inventories by the IPCC; attributing to bioenergy its combustion emissions and thus ignoring the treatment of the short carbon cycle by scientists and the IPCC; and the use of Global Warming Potential 20 (GWP-20), which the IPCC states is not standard practice in the scientific community and doesn’t comport with the Paris Agreement Rulebook. In addition, the targets as adopted in 2019 could not have foreseen the substantial reversal in the federal policy landscape, the disruptive and lingering impacts of COVID-19 and the subsequent supply chain crisis, the return of an inflationary economy, and the influence of geopolitical events on energy costs generally.
All this is fodder for arguments that Hochul will apparently use to claim that the Climate Act must be modified because of the expected costs.
NYSERDA Cost Underestimates
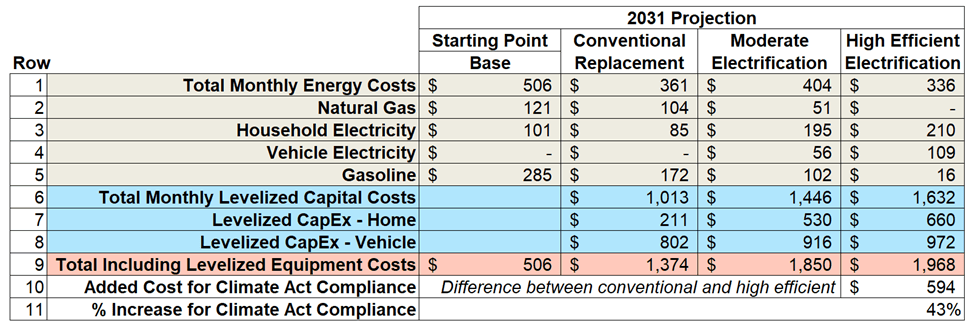
As high as these numbers are, I believe that the admitted costs in the memo are underestimated. The State Energy Plan December 2025 Energy Affordability Data Annex spreadsheet (Annex Spreadsheet) and the Energy Affordability Impacts Analysis (Impact Analysis) document provide the supporting documentation for the Fact Sheet. Using that data I compared costs for an Upstate New York moderate income household that uses natural gas for heat for replacement with conventional equipment and electrification equipment consistent with Climate Act goals. The difference in monthly energy costs and levelized equipment costs necessary to comply with the Climate Act would be $594 a month greater as shown in Table 1. Details of the table contents are available here. I believe that the cost of Climate Act compliance is the difference between replacement of conventional equipment and the highly efficient electrification equipment. Row 10 shows this difference. It lists the $594 increase in costs necessary for Climate Act compliance. On an annual basis this is about $7,200.
Table 1: Upstate New York Moderate Income Household That Uses Natural Gas for Heat Projected Monthly Costs and Costs Necessary to Comply with the Climate Act
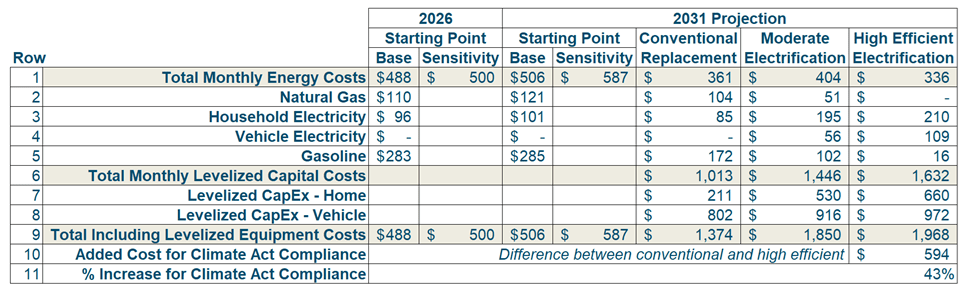
The articles and memo cost estimates are inconsistent with my evaluated cost of $7,200 per household. Budget Director Davidson said that “the estimated average cost to New Yorkers of the energy transition under current rules comes to roughly $3,000.” Lewis says that Gov. Kathy Hochul suggested that “the cost of fully complying to the state’s climate law could cost average New Yorkers up to $3,500 each.” The memo states “Upstate oil and natural gas households would see costs in excess of $4,000 a year and New York City natural gas households could anticipate annual gross costs of $2,300.” My costs are by household and the other numbers may be by person or household so that is a confounding factor.
A Perplexity AI search of the “entire Energy Affordability Impacts Analysis section of the adopted 2025 Energy Plan confirms zero mentions of cap-and-invest, carbon pricing, allowance costs, or the Clean Air Initiative anywhere in the affordability chapter.” This means that my estimate of Climate Act costs do not include the cap-and-invest costs described in the NYSERDA memo. For the Upstate natural gas household in the NYSERDA State Energy Plan analysis that included the costs of equipment necessary for Climate Act compliance the costs would be $11,200 a year.
Discussion
NYSERDA has never been upfront about Climate Act costs. The NYSERDA CLCPA costs estimates use a “no action” baseline that excludes programs in place before the CLCPA was enacted but are necessary to achieve the CLCPA mandates. That means that their analyses underestimate the costs of compliance even more than described here. I described this misleading approach used in the State Energy Plan here and here.
Lewis described the initial response from the ideologues who unequivocally support Climate Act implementation:
Washington’s new comments also drew immediate condemnation from climate activists, who have criticized Hochul for delays in releasing key climate regulations and her willingness to expand natural gas use. Liz Moran, New York policy advocate for Earthjustice, said targeting the climate law isn’t the way to address the real utility squeeze residents are feeling. “The main driver of those increases is the cost of gas and gas pipes – not our climate law,” she said in a statement. “Failing to address gas as the problem is the actual ‘own goal.’ With the federal government decimating science-based climate protections every day, now is not the time for New York to do the same to our nation-leading climate law.”
With regards to the memo Lewis noted an even more unhinged response:
Environmental advocates immediately blasted the memo. Justin Balik, Evergreen Action’s vice president for states, said rather than running away from clean energy, Hochul should expand initiatives and programs she has already deployed, and seek opportunities for innovative clean energy solutions. “The answer here is, again, leaning into clean energy and not buying into some of these false claims from the fossil fuel community and the business lobby that somehow renewables are why people’s bills are going up,” Balik said. “And it’s troubling that those assertions are being entertained by the state right now.”
Most troubling to me is this Democratic lawmaker’s response:
“Yes we can address climate change, reduce costs for ratepayers, increase generation and create tens of thousands of good-pay jobs in the process,” state Sen. Pete Harckham, chair of the Senate Environmental Conservation Committee, said in a statement. “What we need is the political courage to do so.”
This is so wrong on so many levels that it beggars the mind.
Conclusion
Richard Ellenbogen summed this up well when he told me: “When you try to execute policies that defy physical law, costs are going to spiral out of control which is what has happened. He concluded that “The entire CLCPA is fatally flawed, and that’s what you get when you turn energy planning over to ideologues with no knowledge of energy systems or economics.”
I have been advocating for an implementation pause for months. Clearly the PSC must conduct a hearing to suspend or temporarily modify the Renewable Energy Program in Public Service Law 66-P.