My last post described comments submitted by the New York Independent System Operator (NYISO) on the New York Draft State Energy Plan prepared by the New York State Energy Research & Development Authority (NYSERDA). This post summarizes the NYISO recommendations.
Net-Zero Aspirations
The Climate Leadership & Community Protection Act (Climate Act) established a New York “Net Zero” target (85% reduction in GHG emissions and 15% offset of emissions) by 2050 and has two electric sector targets: 70% of the electricity must come from renewable energy by 2030 and all electricity must be generated by “zero-emissions” resources by 2040.
According to the New York State Energy Plan website: “The State Energy Plan is a comprehensive roadmap to build a clean, resilient, and affordable energy system for all New Yorkers.” This is the first update of the Energy Plan since the Climate Act was passed in 2019, so it will incorporate the net-zero mandates. I have provided more background information and a list of previous articles on the Energy Plan on a page dedicated to the process.
NYISO Overview of System Trends
The NYISO comments point out that there are three “structural trends” that create significant uncertainty about the future electric system:
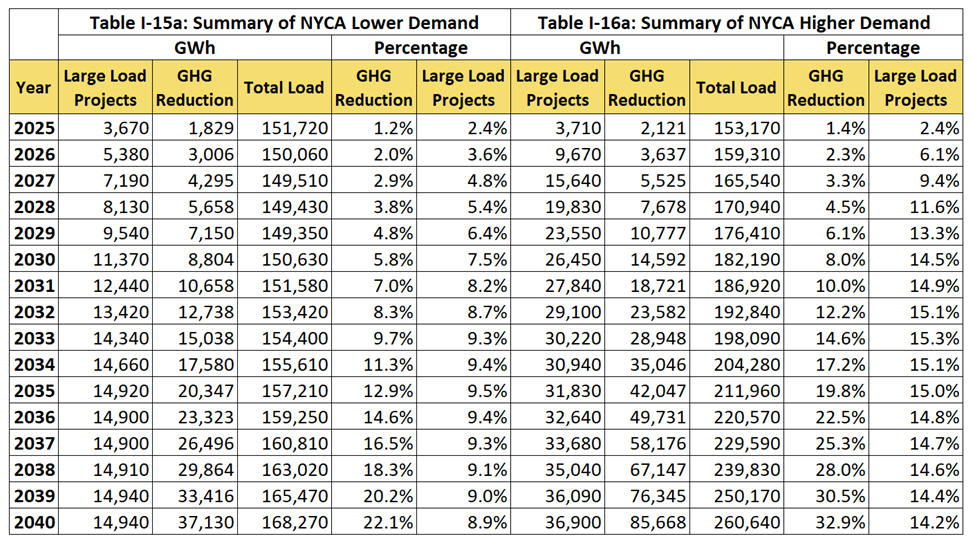
The New York grid is at an inflection point, driven by the convergence of three structural trends: the aging of the existing generation fleet, the rapid growth of large loads, and the increasing difficulty of developing new dispatchable resources. These trends are not isolated, they are compounding. Generators in New York are among the oldest in the country. Large energy-intensive economic development projects, such as semiconductor manufacturing plants and data centers, are driving up demand for electricity significantly after relatively flat demand trends over the last decade. Collectively, all these elements create uncertain conditions today, in the near term, and in the longer term, and each uncertainty has the real potential to cause major impacts on electric system reliability. All electric industry stakeholders, including the state agencies involved, must be aware of and factor these concerns into their planning and strategy.
The NYISO comments describe the electric grid inflection point driven by several structural trends. I believe their comments and recommendations also represent a Climate Act inflection point. The NYISO comments and the Draft Energy Plan include statements that contradict the heretofore sacrosanct underlying assumptions of the authors of the law. The majority of the Climate Action Council supported Dr. Robert Howarth who believed that the transition away from fossil fuels would require no new technology, could be done quickly, could “be fueled completely by the power of the wind, the sun, and hydro”, that it would “be cost effective, that it would be hugely beneficial for public health and energy security, and that it would stimulate a large increase in well-paying jobs.” I have argued that none of these beliefs are supportable but state organizations have not forcefully agreed with my comments.
It is encouraging that five NYISO concerns described in their comments contradict those fundamental presumptions:
- Electric Grid Concerns Exist Today
- Repowering Existing Generation and Introducing New Generation Will Prove Critical to Maintaining Electric System Reliability
- Existing Nuclear Generation is Critical to Meeting the Demands of New Yorkers
- Emerging Technologies and Other Resource Development
- Key Risk Factors Shaping the Grid
Furthermore, there are six extensive quotations from the Draft Energy Plan that NYISO supports. I have included those quotes in an addendum to this article. They represent previously unacknowledged NYSERDA departures from the Climate Act ambition and schedule:
- The State will need to be strategic about the pace of combustion unit retirements and/or replacement
- Combustion generating units will remain essential parts of electric grid reliability and affordability. Retirement of these units will not be able to occur until resources that provide the same grid reliability attributes are put in place.
- A primary challenge for New York’s energy system is its advancing age, which creates unique risks for reliability.
- The State will need to be strategic in identifying and integrating clean firm technologies that have the attributes necessary to support the achievement of a zero emissions electric grid by 2040.
- For the electricity system, continue to incorporate the impacts of climate change into future reliability planning scenarios.
- Consider whether the current reliability-related metrics should be supplemented given the evolving nature of the grid and increased risks of high-impact reliability events
This article describes NYISO recommendations associated with their concerns and these quotes. These admissions suggest that the NYSERDA Draft Energy Plan offers hope that reality is finally filtering through to New York energy policy.
Recommendations
This section describes the recommendations from NYISO. I believe they support my hope that we are at an inflection point regarding Climate Act implementation.
To this point the political belief that building as much renewable energy as possible as fast as possible would mean that fossil-fired generating units could quickly be retired. NYISO recommends otherwise:
The final State Energy Plan must include a recommendation consistent with the Draft Plan observations that combustion generating units “remain essential parts of electric grid reliability and affordability, and retirement of these units will not be able to occur until resources that provide the same grid reliability attributes are put in to place.”
Soon after the passage of the Climate Act, the New York State Department of Environmental Conservation, undoubtedly at the direction of the Hochul Administration and cheered on by all the environmental organizations in the state, denied permits for new natural gas-fired power plants at Danskhammer and Astoria (including my thought) because they were inconsistent with the Climate Act. The NYISO suggests that this was a fatal conceit because there were no plans to maintain reliability, just the presumption that the transition was only a matter of political will. Frankly, it was disappointing that the NYISO did not comment during the permitting process and say it would be premature to reject the applications until all the ramifications were considered. Now NYISO says:
The electric system needs all existing generation resources and needs new generation resources before the current fleet suffers a catastrophic failure that jeopardizes the health, safety, and welfare of New Yorkers. The final State Energy Plan must include a recommendation removing barriers to new resources to address the age of the generation resources that are critical to maintaining electric system reliability.
Better late than never but in my opinion, NYISO could have submitted the following comment as part of the permitting process for the proposed facilities that were rejected:
The age of the existing generation fleet and the lack of viable alternative technologies require steps to use the best technology currently available. The final State Energy Plan must include a recommendation to facilitate development of natural gas-fired combustion generation to immediately support electric system reliability and be available until new, dispatchable, emission-free generating technologies are commercially available to support electric system reliability, e.g., hydrogen and advanced nuclear.
Anyone who understands the electric system understands that nuclear resources must be part of a lower carbon electric system. Ideological zealots do not accept that and still demand no nuclear power in the future. I agree with NYISO’s recommendation to keep existing nuclear facilities in operation:
The reliability attributes and overall energy production that nuclear resources provide to
the electric system unquestionably demonstrate the need for these resources to remain available in New York. The final State Energy Plan must include the recommendation from the Draft Plan to complete the ZEC program “evaluation prior to any federal relicensing application deadlines, to ensure the continued operation of the existing nuclear fleet to contribute to climate goals and help maintain fuel diversity and fuel security.
The NYISO made a pragmatic recommendation for emerging technologies and noted that continued investments in current technologies are needed:
Given the significant need for resources demonstrated by the Outlook and contemplated in the Draft Plan, the final State Energy Plan should explore all emerging technologies, while focusing on promising technologies that will be readily available sooner and continuing to invest in current technologies including repowering fossil-fuel-fired generation to support fuel diversity and overall electric system reliability
The Recommendations section in the NYISO comments makes suggestions for inclusion in the Final State Energy Plan:
The NYISO applauds the Draft Plan’s efforts to holistically consider the multiple goals and long-range planning objectives around New York’s energy systems. The NYISO maintains that a reliable electric system supported by competitive wholesale markets must serve as the cornerstone to meet New Yorkers’ daily needs and advance broader economic objectives. The final State Energy Plan must focus on energy system reliability and acknowledge that both the near- and long-term future of the electric system are subject to numerous uncertainties. These uncertainties must be continually reevaluated through impactful, independent analysis, and planning processes like the NYISO’s Reliability Planning Process.
Schedule Inconsistencies
Problems associated with the Hochul Administration’s blind adherence to the Climate Act law are occurring today. The NYISO comments stated:
During the summer of 2025, the NYISO was forced to declare several energy emergencies due to tight supply conditions as heat waves affected much of the Eastern Interconnection and real-time demand approached the seasonal 90/10 forecasts.
Reliability studies have shown that current and future electric system reliability in New York is, in part, dependent on scheduled imports and emergency assistance from neighboring control areas. New York’s eroding statewide reliability margins assume that all firm scheduled imports from neighboring systems are available when needed. However, these neighbors are experiencing tighter margins for many of the same reasons as New York and may not be able to deliver power to New York due to their own system needs.
The NYISO comments point out that the implementation schedule is falling behind and that it is unlikely to get better anytime soon.
Supply chain issues are currently driving long lead times for the delivery of equipment needed to construct energy infrastructure and delays in receiving necessary permits to build projects increase risk for planned projects to meet their proposed in-service dates. Projects facing these uncertainties could include key transmission projects like Champlain Hudson Power Express (“CHPE”) and Propel NY Alternate Solution, which are expected to be necessary to improve and maintain overall electric system reliability.
The NYISO’s Reliability Planning Process currently assumes that more than 4,400 MW of new resources will be in service by the end of 2028, a majority of which are comprised of solar resources and offshore wind resources. Recent actions taken by the federal government have drastically impacted the prospective development and construction of offshore wind and other renewable resources.
Potential delays for these types of projects have become more likely since the Draft Plan was prepared and issued. Any delay or cancellation of these resources coming into service will have adverse effects on system reliability.
Discussion
I think there are indications that the realistic approach recommended in the NYISO comments are being considered as illustrated by some NYSERDA statements in the Draft Energy Plan. Unfortunately, the ideological environmental organizations who take credit for the passage of the Climate Act vociferously argue that the Climate Act law requires that the Act’s mandates must be met. However, they do not acknowledge New York Public Service Law § 66-p (PSL 66-P) “Establishment of a renewable energy program” that includes safety valve conditions for affordability and reliability.
In my opinion, the Hochul Administration has excuses that they can use to deflect the maniac response. In early August I co-authored a filing to New York Public Service Commission (PSC) Case 22-M-0149 – Proceeding on Motion of the Commission Assessing implementation of and Compliance with the Requirements and Targets of the Climate Leadership and Community Protection. The filing argued that there are sufficient circumstances to warrant the PSC commencing a hearing process to consider modification and extension of New York Renewable Energy Program timelines consistent with PSL 66-P. If the PSC were to act on our filing, then they could pause implementation.
Given that the entire process has always been about politics the more likely excuse is to blame the Trump Administration. Draft Energy Plan Section 1 of the Summary for Policymakers at p. 3 provides a draft rationale for this approach. It states:
The federal administration’s energy and unpredictable tariff policies bring additional political and regulatory uncertainty, which threatens critical federal support for clean energy development and creates barriers to private investment. This includes the rollback of tax credits provided under the Inflation Reduction Act, planned denial of permits for wind generation, and attempts to remove state-based clean car and clean truck rules.
I believe that resolving these constraints is going to come to a head by the end of the year. If the Final Energy Plan incorporates the NYISO recommendations, then it acknowledges that the Climate Act mandates cannot be achieved on schedule. The meltdown of the proponent constituency will be enormous.
Conclusion
I cannot over emphasize how much I agree with the NYISO description of the importance of the electric system:
Progress towards the Climate Act goals, other public policies, and supplying the electricity that New Yorkers demand requires the State Energy Plan to support a well-functioning, reliable electric power sector. Reliable electric power is the foundation of the State’s plans to electrify other aspects of the economy and to reduce emissions. The NYISO urges the Board and NYSERDA to consider these comments and prioritize electric system reliability in the final State Energy Plan.
If the State continues the implementation approach embedded in the Scoping Plan I have no doubts that there will be a blackout. The negative impacts will not be model predictions or value-laden possible societal costs. Instead, there will be real deaths, enormous costs, and unnecessary time and effort fixing the problems identified by the NYISO.
Given that New York cannot solve global warming on its own, it is time for politicians to modify the schedule of the Climate Act and define acceptability limits for affordability, reliability, and environmental impacts. It is also time for the Hochul Administration to grow a spine and incorporate all the NYISO recommendations in the Final State Energy Plan despite the inevitable environmental community backlash. Will the political calculus cater to a constituency that does not understand the electric system and will never be happy or will they move to keep the lights on?
Addendum: NYISO Draft Energy Plan Quotes
This addendum lists the NYISO comments that reference sections of the Draft Energy Plan that are consistent with their concerns.
In the discussion of eroding reliability margins NYISO quotes the Draft Plan saying it “accurately points out” that:
The State will need to be strategic about the pace of combustion unit retirements and/or replacements as it works towards its clean energy goals and to meet reliability needs as quickly and cost-effectively as possible. Combustion generating units will remain essential parts of electric grid reliability and affordability, and retirement of these units will not be able to occur until resources that provide the same grid reliability attributes are put in place. New York will seek to carefully manage the retirement of existing assets and evaluate whether there is a need for new generation that is compatible with long-term policy targets.
NYISO goes on to note that “This theme continues in the Electricity chapter of the Draft Plan.”
Combustion generating units will remain essential parts of electric grid reliability and affordability. Retirement of these units will not be able to occur until resources that provide the same grid reliability attributes are put in place. Additionally, there are specific considerations with respect to the small clean power plants, or “peaking units”, owned and operated by NYPA. By 2030, NYPA will cease production of electricity at its peaking units unless the closure of any specific facility would result in increased emissions in a DAC or the facility is needed for reliability. With these strategic and statutory considerations, New York will seek to carefully manage the retirement of existing assets and evaluate whether there is need for new generation that is compatible with long-term policy targets.
In the section describing the age of the generation fleet NYISO states that it “supports and emphasizes the Draft Plan’s observations around aging generation”:
A primary challenge for New York’s energy system is its advancing age, which creates unique risks for reliability. The NYISO has reported, for example, that by 2028 a quarter of the state’s combustion generators (by capacity) will reach an age at which most such facilities are retired. For several utilities serving the Hudson Valley and Upstate New York, 60 percent to over 95 percent of transmission structures are 70 years old or older. The oldest still operational natural gas pipeline in New York dates to the Centennial, turning 150 years old next year. This aging infrastructure is more prone to failure, requiring more costly repairs, and results in a greater environmental impact than newer technologies.
The discussion of emerging technologies states “The Draft Plan accurately recognizes that”:
The State will need to be strategic in identifying and integrating clean firm technologies that have the attributes necessary to support the achievement of a zero emissions electric grid by 2040. Results from the study described in Section 4.3 will be leveraged to identify and propose pathways for the deployment of those technologies that have the greatest potential to solve the reliability needs expected to arise with the energy transition. The State will also pursue continued support for innovation and demonstration projects, as appropriate. These efforts will be critical, as many of the technologies under consideration to meet system needs for firm, dispatchable capacity (e.g., combustion of alternative fuels, nuclear, long-duration energy storage, etc.) are not commercially available at scale today.
NYISO comments describe key risk factors shaping the grid. Included in the discussion of weather risks is support for the following Draft Plan recommendation:
For the electricity system, continue to incorporate the impacts of climate change into future reliability planning scenarios. Further consider whether the current reliability-related metrics should be supplemented given the evolving nature of the grid and the increased risks of high-impact reliability events. Establishing criteria for metrics like effective unserved energy (EUE) may help supplement traditional criteria based on loss of load expectation (LOLE) by providing information about risks of long-duration outages
Later in the same section NYISO states “The final State Energy Plan should include the related recommendations discussed in the Electricity Chapter of the Draft Plan”:
Consider whether the current reliability-related metrics should be supplemented given the evolving nature of the grid and increased risks of high-impact reliability events. New York should consider whether the current reliability-related metrics (i.e. loss of load expectation) should be supplemented given the evolving nature of the grid and the increased risks of high-impact reliability events. Establishing criteria for metrics like expected unserved energy (EUE) may help supplement traditional LOLE-based criteria by providing information about risks of long-duration outages. As fuel availability will be incorporated into the NYISO’s capacity accreditation framework, additional consideration should be given to whether this adjustment to capacity accreditation provides sufficient incentives and compensation to resources for attributes needed to ensure energy adequacy and resilience to extreme weather events from both a planning and operational perspective (e.g. compensation for fuel storage capabilities).