Dr. Matthew authors the Irrational Fear blog. He frequently writes about issues that I think are important relative to the ultimate need for transitioning off fossil fuels and other aspects of the response to the “climate crisis” that I think are important for everyone to understand. This recommendation to read his work was prompted by several recent articles.
Background
According to Wielicki’s website:
With a Ph.D. in earth science from UCLA and as a professor-in-exile, he bravely challenges the norms that many in the scientific community only whisper about. Fear of losing positions and research funds keeps many silent, but not Dr. Wielicki. He boldly addresses the unfounded fears surrounding climate change, culture, and politics on his Substack, offering a perspective rooted in solid scientific understanding.
I did a search of his background. He resigned from the University of Alabama citing personal family matters but also a frustration with the politicization at the school. The article states:
Wielicki told The Fix via email he takes issue with the narrow scope that the sciences are constricted by with university and government funding priorities.
“The majority of funding within the earth sciences is climate-focused,” he said. “This means that those that don’t do climate science have to compete for fewer and fewer resources as so much is being funneled to climate science.”
Since leaving academia he has positioned himself as an independent geoscientist and commentator, speaking and writing about Earth science and climate issues, including through media appearances and his “Irrational Fear” Substack.
I will briefly describe several recent articles. I only subscribe to his Substack as a free basis. I have limitations on the number of paid subscriptions that I can afford and his free subscriptions generally provide enough information for my purposes.
Climate “Solutions” Are the Real Danger
I have been leery about plans to counter act global warming directly by modifying the atmosphere to “cool” the planet but haven’t spent the time to research an article about the dangers. This post by Wielicki is a great introduction to the plans and the risks. He explains:
For decades, we were told that climate change itself was the looming threat… rising temperatures, extreme weather, catastrophe just over the horizon. But quietly, almost without public debate, the conversation has shifted. The danger is no longer climate change alone. The danger, increasingly, is what powerful institutions now propose to do about it.
What were once fringe, crackpot “solutions” whispered in obscure academic circles are breaking into the mainstream, published in reputable journals and pushed as serious policy ideas. These aren’t just bad ideas… they’re dangerous, hubristic experiments that could cause real harm, all in the name of fighting a crisis that’s more hype than reality.
I’ve been warning about this for years on Irrational Fear. In “Geoengineering Madness,” I exposed how companies like Make Sunsets are proposing to inject sulfur into the atmosphere to “cool” the planet, conveniently ignoring the trillions we’ve already spent scrubbing sulfur from fuels to combat acid rain. In “Exposing the Waste in Climate Solutions,” I detailed how $2 trillion has been flushed down the drain on unproven tech like carbon capture and blue hydrogen, while real environmental issues get ignored. And don’t get me started on Bovaer… the methane-busting additive for cows that sterilizes lab rats and comes with a laundry list of side effects, as I covered in “Follow The Money, And You’ll Find The Science”. The pattern is clear: climate change itself has never directly killed anyone or posed an existential threat, but the so-called “solutions” could unleash environmental, health, and economic disasters on a massive scale.
He goes on to describe two new chilling examples of proposals in mainstream publications for his paid subscribers: one proposing we weaponize a tick-borne disease to force people off meat, and another suggesting we pump sulfur into the skies using jumbo jets.” These are the antithesis of pragmatic solutions to the alleged problems.
Greenland’s Ancient Melt: The Bombshell Study That Buries Climate Alarmism
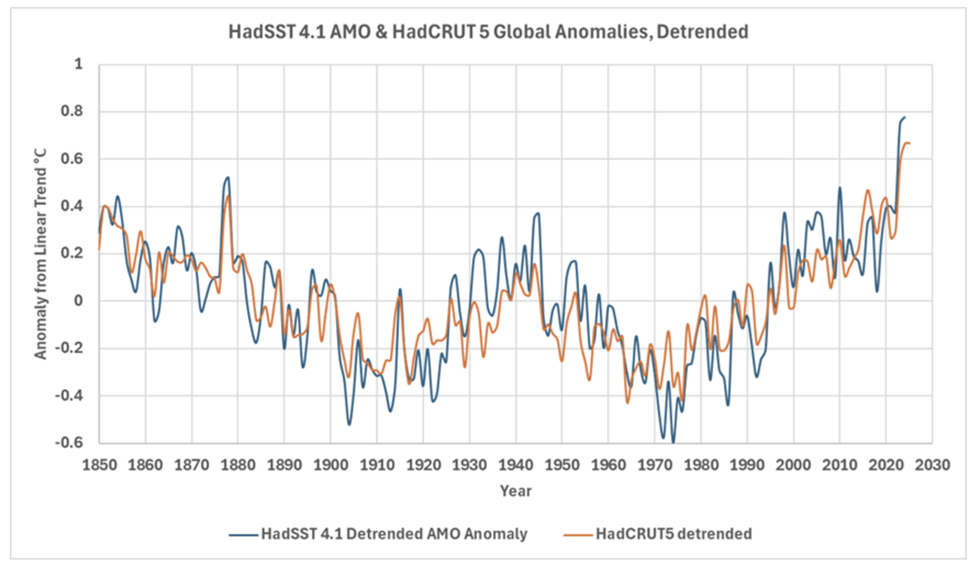
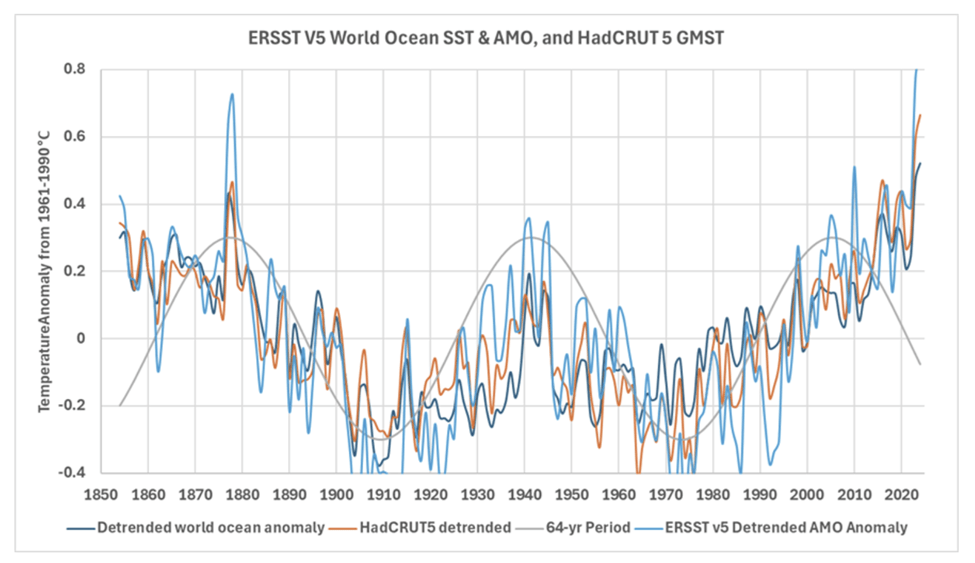
I recently did a post pointing out all the unknown factors affecting natural climate change. I pointed out that there are numerous poorly understood oceanic and atmospheric cycles that are ignored by the Global Climate Models that predict gloom and doom from global warming due to greenhouse gas emissions. The observations of global temperatures correlate well with certain oscillations.
Wielicki describes another inconvenient truth. He describes a new paper that is inconsistent with the existential threat claims. He points out:
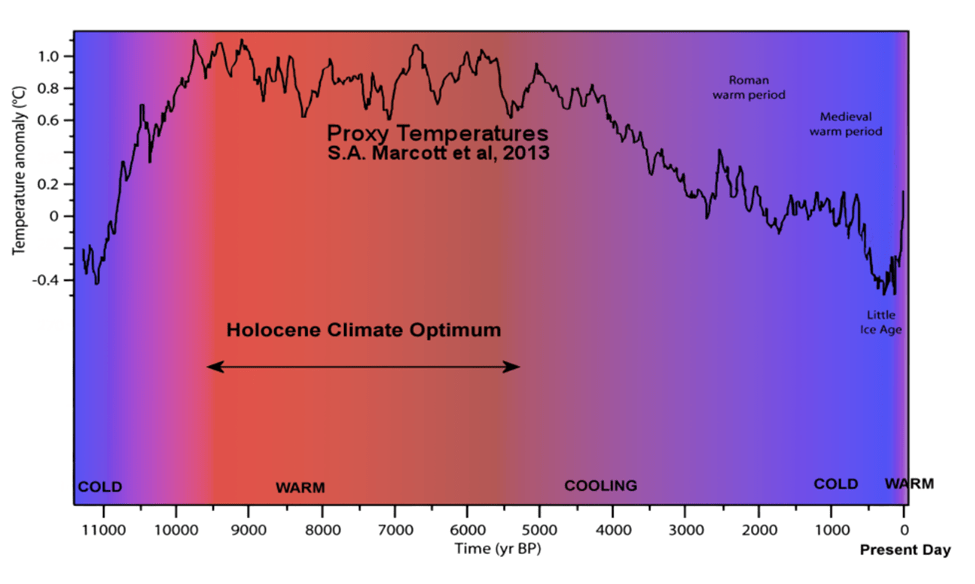
This ties directly into what I’ve called the “Greenland Warming Paradox,” which I detailed in a previous article. In short, Greenland has been dramatically warmer in the past… like during the Holocene Thermal Maximum 9,000 to 5,000 years ago, when temperatures were 4–8.5°C higher than today, yet sea levels were lower. This challenges the alarmist claims that modest modern warming will drown the world.
The new paper reveals that Prudhoe Dome, a key part of northwestern Greenland’s ice sheet, was completely ice-free around 7,000 years ago during the early Holocene. This happened at pre-industrial CO2 levels, under natural warming of just 3–5°C above today’s temperatures. If CO2 is the supposed driver of today’s melting, why was Greenland deglaciating back then without any human emissions?
This is the kind of bombshell that should make headlines for debunking the narrative, but instead, it’s being spun as a warning for future warming.
I doubt that this kind of information will ever get covered by the mainstream media. They wonder why many do not trust them.
Hunga Tonga–Hunga Haʻapai Volcanic Eruption
This is another example of an inconvenient truth. Charles Rotter describes the eruption:
When the Hunga Tonga–Hunga Haʻapai volcano erupted in January 2022, it immediately posed a problem—not merely scientific, but institutional. The eruption was the most explosive in the satellite era, injected an unprecedented quantity of water vapor into the stratosphere, and did so with a chemical signature unlike the canonical climate-cooling eruptions of the late twentieth century. It was followed, inconveniently, by a pronounced surge in global surface temperatures. The timing alone guaranteed scrutiny. What mattered was how that scrutiny would be framed.
The thing to remember is that water vapor is that it is the dominant contributor to the natural greenhouse gas effect. It is ignored by climate activists because it does not accumulate like other greenhouse gases. Wielicki published an article addressing the framing in the response by the climate science activists. He describes the consensus response to the eruption:
This 382-page volume from the Atmospheric Processes and their Role in Climate (APARC) project, involving over 100 scientists worldwide, dissects the atmospheric aftermath of this massive submarine blast. I’ve tackled Hunga before in my article “The Hunga Tonga-Hunga Ha’apai Volcanic Eruption and the Stochastic Nature of Climate Variability,” where I explained how this event – a relatively common geologic occurrence – pumped an astonishing ~146 Tg (teragrams, or millions of metric tons) of water vapor into the stratosphere. That’s equivalent to a sudden 10% increase in the stratosphere’s total water content. Water vapor is Earth’s most powerful greenhouse gas (GHG), trapping far more heat than CO2 ever could.
In that piece, I highlighted how such natural events underscore the chaotic, unpredictable side of our climate system – the “stochastic” nature, meaning random and hard-to-model fluctuations that can override human influences overnight. I also critiqued global mean temperature (GMT) as a metric in “The Absurdity of Global Mean Temperature and Mean Sea Level Metrics,” noting it’s a statistically contrived number based on extrapolating from tiny fractions of actual measurements (just 0.01% of Earth’s surface is directly gauged), masking huge regional differences and uncertainties.
Now, this fresh APARC report claims Hunga’s effects were mostly “minor” on surface climate, despite that massive water injection. But here’s the kicker: If a instantaneous 10% spike in the strongest GHG has negligible warming impact, why the hysteria over CO2’s slow creep upward at about 0.5% per year? Are we witnessing scientific contortions to keep CO2 as the villain, even if it undermines the very case for GHG sensitivity? After all, when careers and funding depend on seeing CO2 everywhere, that’s exactly what you’ll find – ignoring how natural variability like Hunga could explain recent warming spikes without any CO2 surge. And let’s not forget: For years, the climate community has downplayed water vapor as merely a “feedback” to CO2-driven warming, but Hunga injected it independently – exposing that as an oversimplification that inflates CO2’s role.
What Politicians Should Say About Climate and Energy
2026 is going to be a pivotal year for New York’s Climate Leadership & Community Protection Act. Wielicki offers recommendations about messaging for politicians.
Bill McKibben recently published an essay titled “Pretend you’re running for Congress,” offering guidance on how candidates should talk about climate and energy heading into the 2026 midterm elections. His central claim is that elections will hinge on affordability, that energy prices will be decisive, and that candidates should keep the message simple: Republicans are driving demand, blocking clean energy, and raising prices… while renewable energy is cheap, abundant, and inevitable.
On the surface, this sounds pragmatic. But beneath the rhetoric is a familiar problem: the same slogans, the same moral framing, and the same absence of scientific or economic nuance that have defined climate politics for decades.
McKibben tells candidates to keep it simple because energy systems are “intricate and abstruse.” What he really means is that complexity gets in the way of the story. And the story must remain intact.
What’s missing from his essay is striking. There is almost no discussion of climate science itself… no mention of uncertainty, natural variability, or observational constraints. There is no acknowledgment that climate concern has already peaked politically. And there is no recognition that energy is not merely an input to the economy, but the foundation of human flourishing.
That omission matters because voters, especially younger ones, are no longer responding to fear the way they once did.
The uncertainty issue extends to the purported “solutions”. The narrative is that there is no question that wind and solar energy are cheaper but the reality is that the only question is just how much more an energy system that depends upon those resources would cost. It is a lot.
Conclusion
In order to fully appreciate his work a paid subscription is a good investment. However, even the free subscription is useful insight into the climate community’s biases and inconvenient truths. I recommend going to his Substack and subscribing.